


Key Insights
- PEPE remains in a clear downtrend, with persistent lower highs and continued selling pressure keeping the price near key support levels around $0.00000330.
- The TD Sequential indicator signals a possible rebound after an extended decline, suggesting a move toward 0.0000050 if buyers return with stronger volume confirmation.
- Technical indicators, including RSI and Bollinger Bands, reflect weak momentum, with price consolidating in a narrow range without clear bullish control.
Pepe traded near $0.00000332 as selling pressure held firm across the market, with the token slipping over four percent in twenty-four hours. Price action showed repeated rejection near recent highs, while sellers pushed the asset toward lower support levels. The move reflects a broader bearish structure that continues to define short-term sentiment.
Price movement earlier in the session showed brief strength, as the token climbed toward the $0.00000350 range before losing momentum. However, resistance remained intact, and sellers quickly regained control. Consequently, the asset reversed direction and dropped sharply toward the $0.00000330 zone, where buying interest began to appear again.
Lower Highs Continue to Dominate
Additionally, the decline extended further as the price tested levels near $0.00000326 before stabilizing. A small rebound followed, lifting the token back toward $0.00000332, yet the recovery lacked strength. Moreover, the sequence of lower highs and lower lows continued, reinforcing the dominant bearish trend that has persisted since late February.
On the weekly timeframe, the token remains locked in a sustained downtrend, as price has steadily declined from levels near $0.0000070 toward the $0.0000034 region. Besides, most candles reflect strong selling pressure, while bullish attempts appear limited and short-lived. Recent candles show smaller bodies, indicating reduced volatility and signs of seller exhaustion.
Rebound Signal Gains Attention
Significantly, the TD Sequential indicator now signals a potential shift after printing a nine-count on the weekly chart. This pattern often appears after extended declines and points to a possible short-term rebound. Hence, analysts highlight a move toward the $0.0000050 level if buyers return with stronger volume and confirm the signal.
However, confirmation remains uncertain as the current market structure shows limited bullish strength. Price continues to consolidate between $0.00000309 and $0.00000343, reflecting hesitation among participants. Additionally, this narrow range suggests that neither buyers nor sellers have established clear control, keeping the token within a tight consolidation phase.
Indicators Reinforce Weak Momentum
Moreover, technical indicators continue to support the cautious outlook, as Bollinger Bands place the price near the lower boundary around $0.00000309. The middle band near $0.00000343 acts as immediate resistance, limiting upward attempts. Consequently, the positioning signals persistent selling pressure, while price struggles to break above key short-term resistance levels.
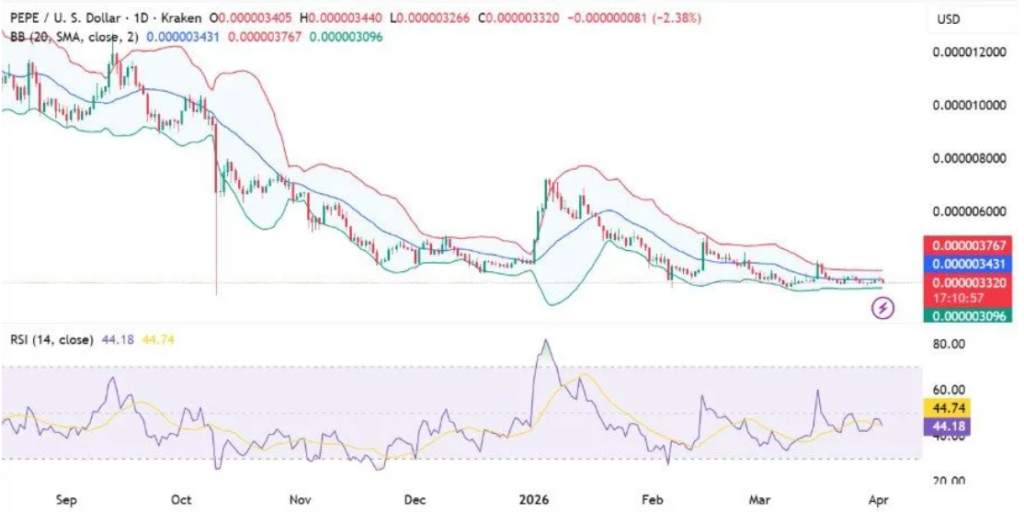
Meanwhile, the Relative Strength Index remains below the neutral fifty mark, hovering near forty-four and indicating weak buying momentum. Its sideways movement reflects a lack of strong directional bias in the short term. Besides, the indicator aligns with ongoing consolidation, reinforcing the view that momentum has yet to shift in favor of buyers.