


- $PENGU’s early chart shows patterns similar to $PEPE’s pre-expansion phase.
- The Ichimoku analysis suggests $PENGU’s compression phase could lead to upward momentum.
- Slow price grind and low volume in $PENGU hint at accumulation before a potential breakout.
Pudgy Penguins ($PENGU) is currently $0.009572. This is after a 1.23% drop in the last 24 hours and a 6.36% decline over the past week. Despite recent declines, the market structure of $PENGU is showing similarities to $PEPE’s pre-breakout phase, suggesting a potential accumulation phase before a breakout.
$PENGU: Echoing $PEPE’s Pre-Breakout Patterns
$PENGU’s market structure is mirroring $PEPE’s pre-breakout phase. Both assets show a long, slow base after a sharp drop. This period is marked by tight price ranges and low volatility, which can be easily overlooked.
However, this is often where accumulation occurs. Much like $PEPE, $PENGU is forming higher lows within a narrow range.
The repeated dips are getting shallower, indicating demand is absorbing sell pressure. Traders who are focused on short-term moves might miss this quiet phase, but it’s a key signal for potential future growth.
The current pattern suggests that $PENGU could be setting up for a breakout. The slow grind and tight range are building energy beneath the surface, much like $PEPE did before its surge.
Ichimoku Indicators Suggest Compression Before Expansion
The 4H Ichimoku chart for $PENGU shows that the price is still below the cloud. This signals a bearish macro trend, but the flattening of the Tenkan (blue line) and Kijun (red line) indicates equilibrium.
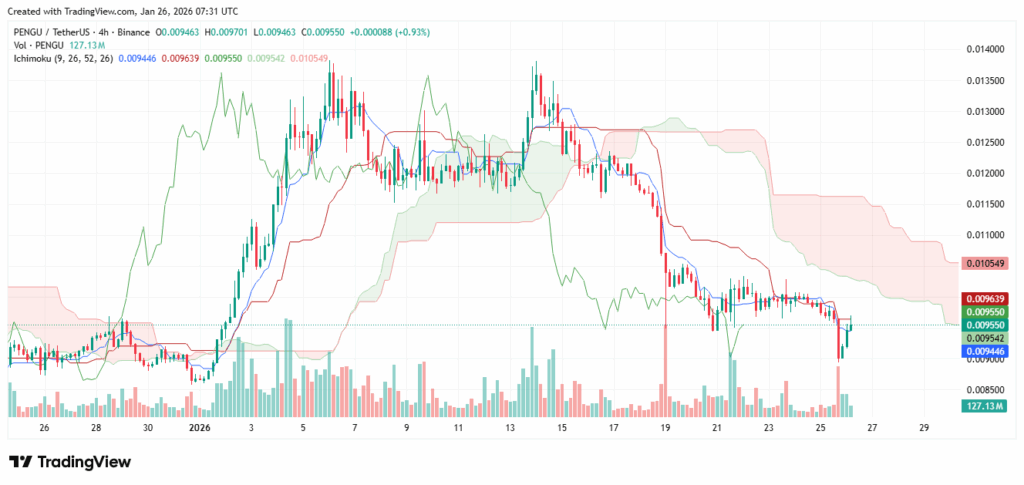
Momentum is no longer accelerating downward, suggesting that selling pressure is subsiding. The price has been stuck in a narrow range of $0.0094 to $0.0096. After a sharp drop, this type of consolidation is typical.
The market is digesting the prior price move, and volume has dropped. This low volume suggests the market is absorbing the selling without pushing the price lower.
This compression phase is often the precursor to a larger move. If $PENGU can break out of this range, momentum could shift quickly.
Slow Burn Prepares $PENGU for Potential Surge
$PENGU’s slow, grinding price action is typical of an asset in accumulation. Like $PEPE, this phase is frustrating for traders expecting quick gains.
But it’s in these moments that the market often sets the stage for significant moves. The low volatility and reduced volume indicate that $PENGU is building a foundation.
If the price can reclaim key levels, such as the Kijun, and approach the cloud, the market structure will shift. This would signal a potential breakout, with the quiet accumulation phase giving way to a more explosive move.