


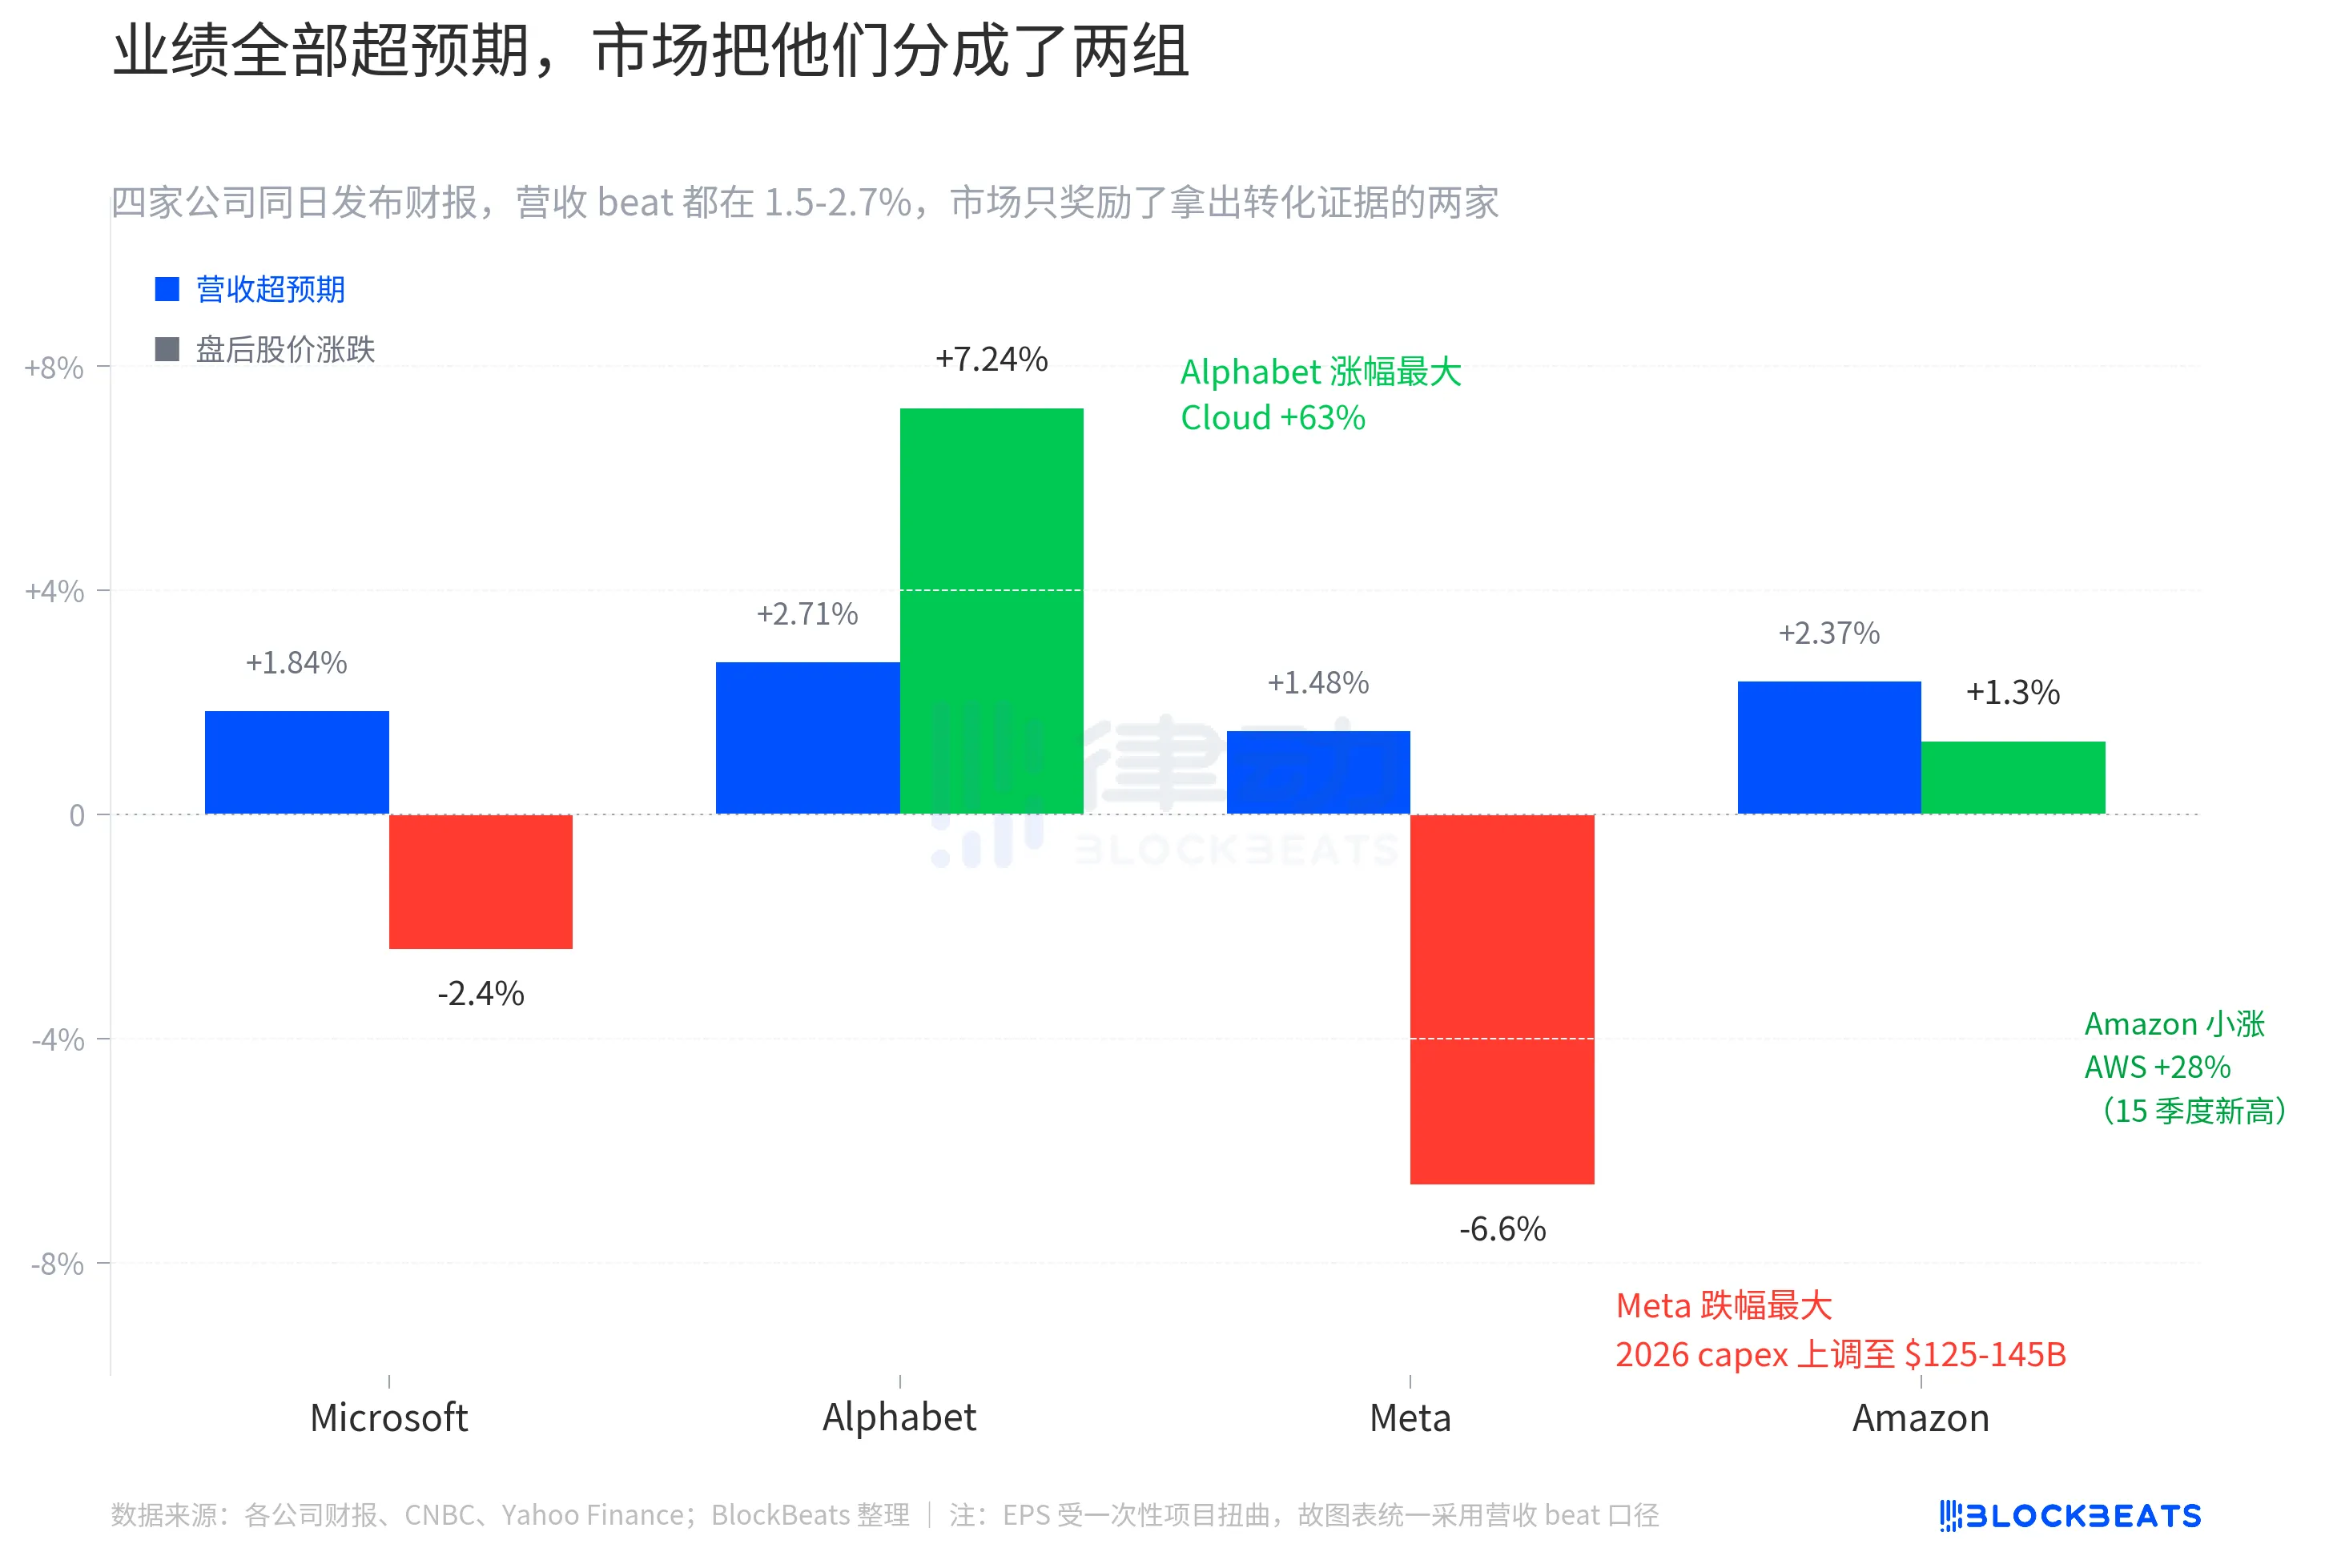
After U.S. markets opened last night, Microsoft, Google, Meta, and Amazon—all four major U.S. tech giants—simultaneously released their latest quarterly earnings reports. This was the first quarter in which the Mag 7 companies nearly all reported on the same day, and the market had anticipated uniformly positive results. Revenue and EPS indeed surpassed analyst consensus expectations across the board. However, market reactions clearly divided them into two groups: Google surged 7.24%, Amazon rose about 1.3%, while Microsoft and Meta declined by approximately 2.4% and 6.6%, respectively.
These four companies have a combined market capitalization of approximately $12 trillion, accounting for more than a quarter of the S&P 500’s weight. When all four earnings reports were released on the same night, the market should have been forced to form a consensus on a common variable. Instead of a unified direction, the results revealed a clear split, grouping the companies into pairs based on their progress in conversion.
"Exceeding expectations" is no longer valuable.
The revenue beats for all four companies ranged between 1.5% and 2.7%. Google reported $109.9 billion in revenue, exceeding consensus estimates by 2.71%. Amazon reported $181.5 billion, beating estimates by 2.37%. Microsoft reported $82.9 billion, surpassing expectations by 1.84%. Meta reported $56.3 billion, outperforming forecasts by 1.48%. These are not four barely adequate earnings reports—they are four consistently strong and impressive results.
EPS figures are even more exaggerated. Google’s GAAP EPS of $5.11 exceeded expectations by 91%. Amazon’s EPS of $2.78 surpassed estimates by 70%. Meta’s GAAP EPS was $10.44. Microsoft’s adjusted EPS was $4.27, beating estimates by about 5%. However, EPS figures cannot be directly compared across companies. Google’s numbers include a distortion from $36.9 billion in unrealized gains on equity investments, Meta includes a one-time $8 billion tax credit, and Amazon’s strong beat primarily stems from analysts underestimating the improvement in AWS profit margins. Therefore, this chart uses revenue beat as the uniform metric to measure “beats” — ensuring all four companies are measured on the same scale.
Strange things happen on this ruler. Amazon, with the second-largest beat, saw only a modest 1.3% gain after hours. Google, with the third-largest beat, posted the largest gain among the four at 7.24%. Meta had the smallest beat and suffered the steepest decline. There is no simple logic that says “the bigger the beat, the higher the rise.”
In other words, the market that night wasn't trading based on the quarterly earnings themselves, but rather on the two subsequent reports that followed.
$710 billion, a record-breaking Capex
Capital expenditure guidance for 2026 shows all four companies increasing their spending.
Microsoft locked its calendar year 2026 capital expenditures at $190 billion during the earnings call. CFO Amy Hood explained that approximately $25 billion of this amount represents incremental costs due to high memory prices. Previously, the consensus estimate from Visible Alpha was only $154.6 billion. Overnight, Microsoft added $35.4 billion to market expectations for spending.
Meta raised its full-year capex range from $115–135 billion to $125–145 billion, shifting the entire range up by $10 billion. The CFO attributed the increase to "rising component prices" and "preparing capacity for future years." The same earnings report also revealed a quarter-over-quarter decline in DAU. Together, these two developments paint a picture of increased spending at a time when growth momentum appears to be weakening.
Google raised its range from $175–185 billion to $180–190 billion, shifting upward by $5 billion—the most restrained increase among the four. The CFO also hinted that capex will continue to "significantly increase" through 2027.
Amazon has maintained its $200 billion guidance set in February. However, Q1 actual capex has already reached $44.2 billion, a 77% year-over-year increase. At this pace, full-year spending is likely to exceed the guidance upper limit. Meanwhile, TTM free cash flow has dropped from $25.9 billion last year to $1.2 billion, a 95% decline.
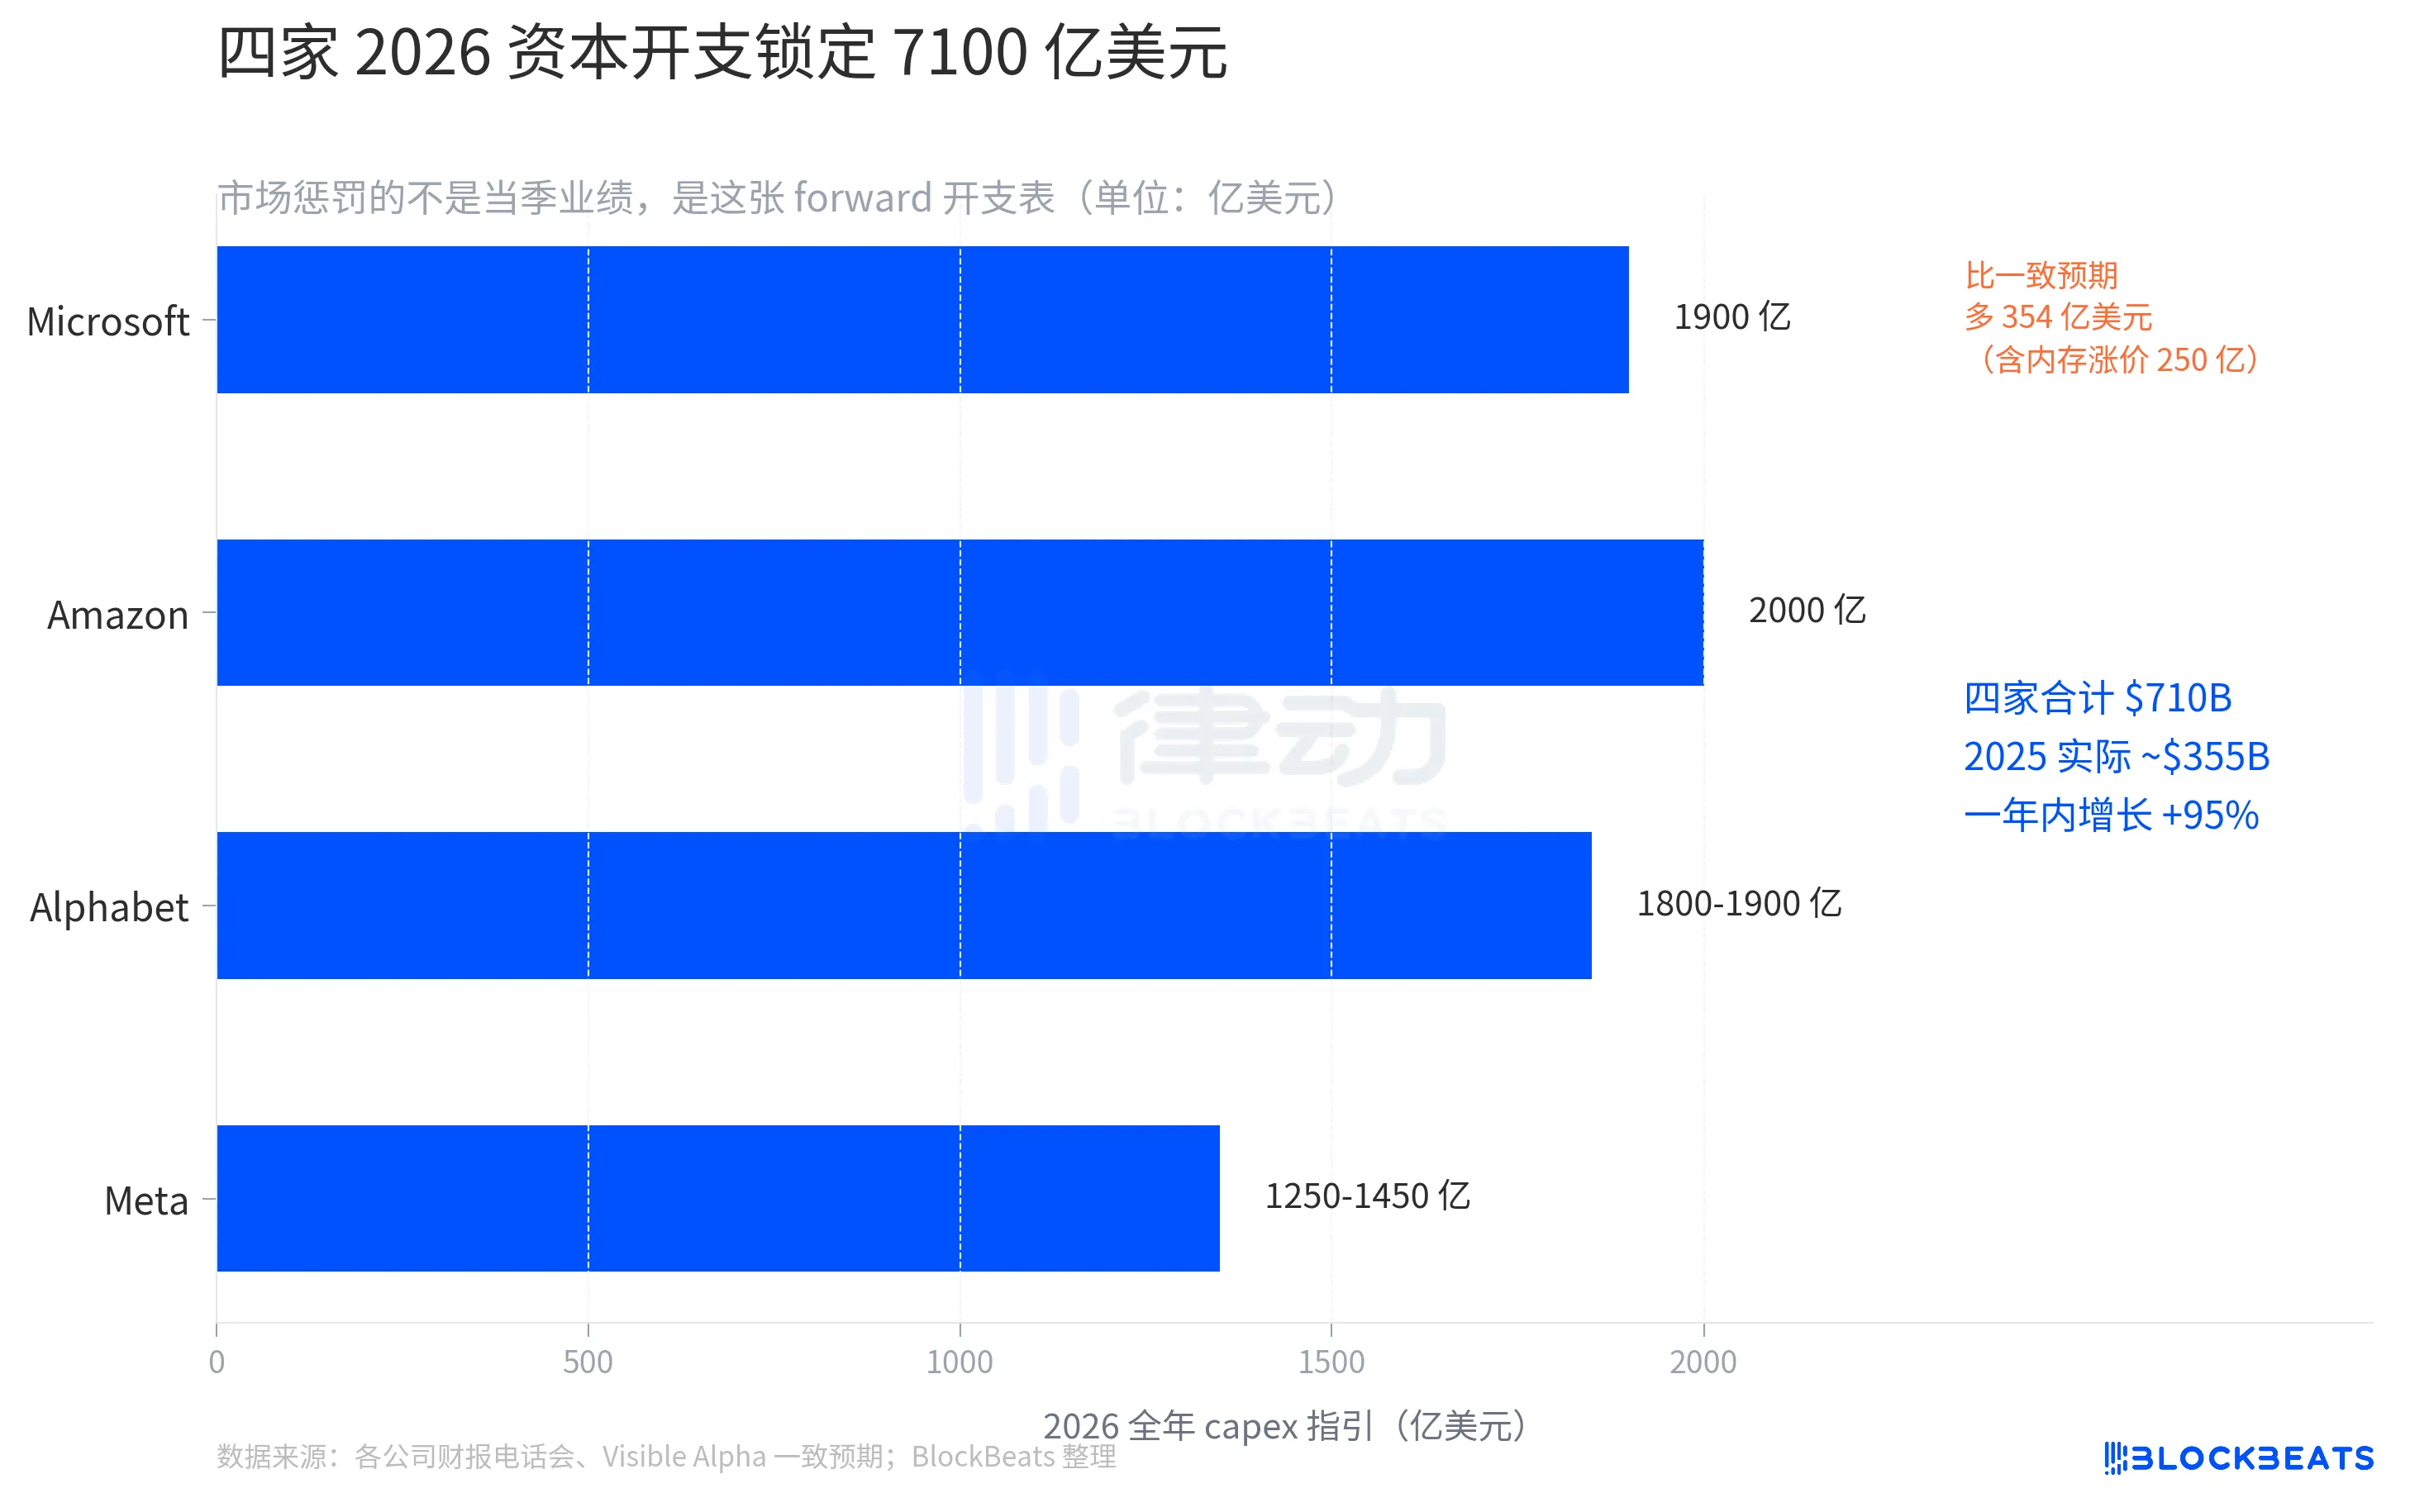
Adding up the midpoint of the 2026 capex guidance for the four companies totals $710 billion. This $710 billion is also exceptionally high by each company’s own historical standards.
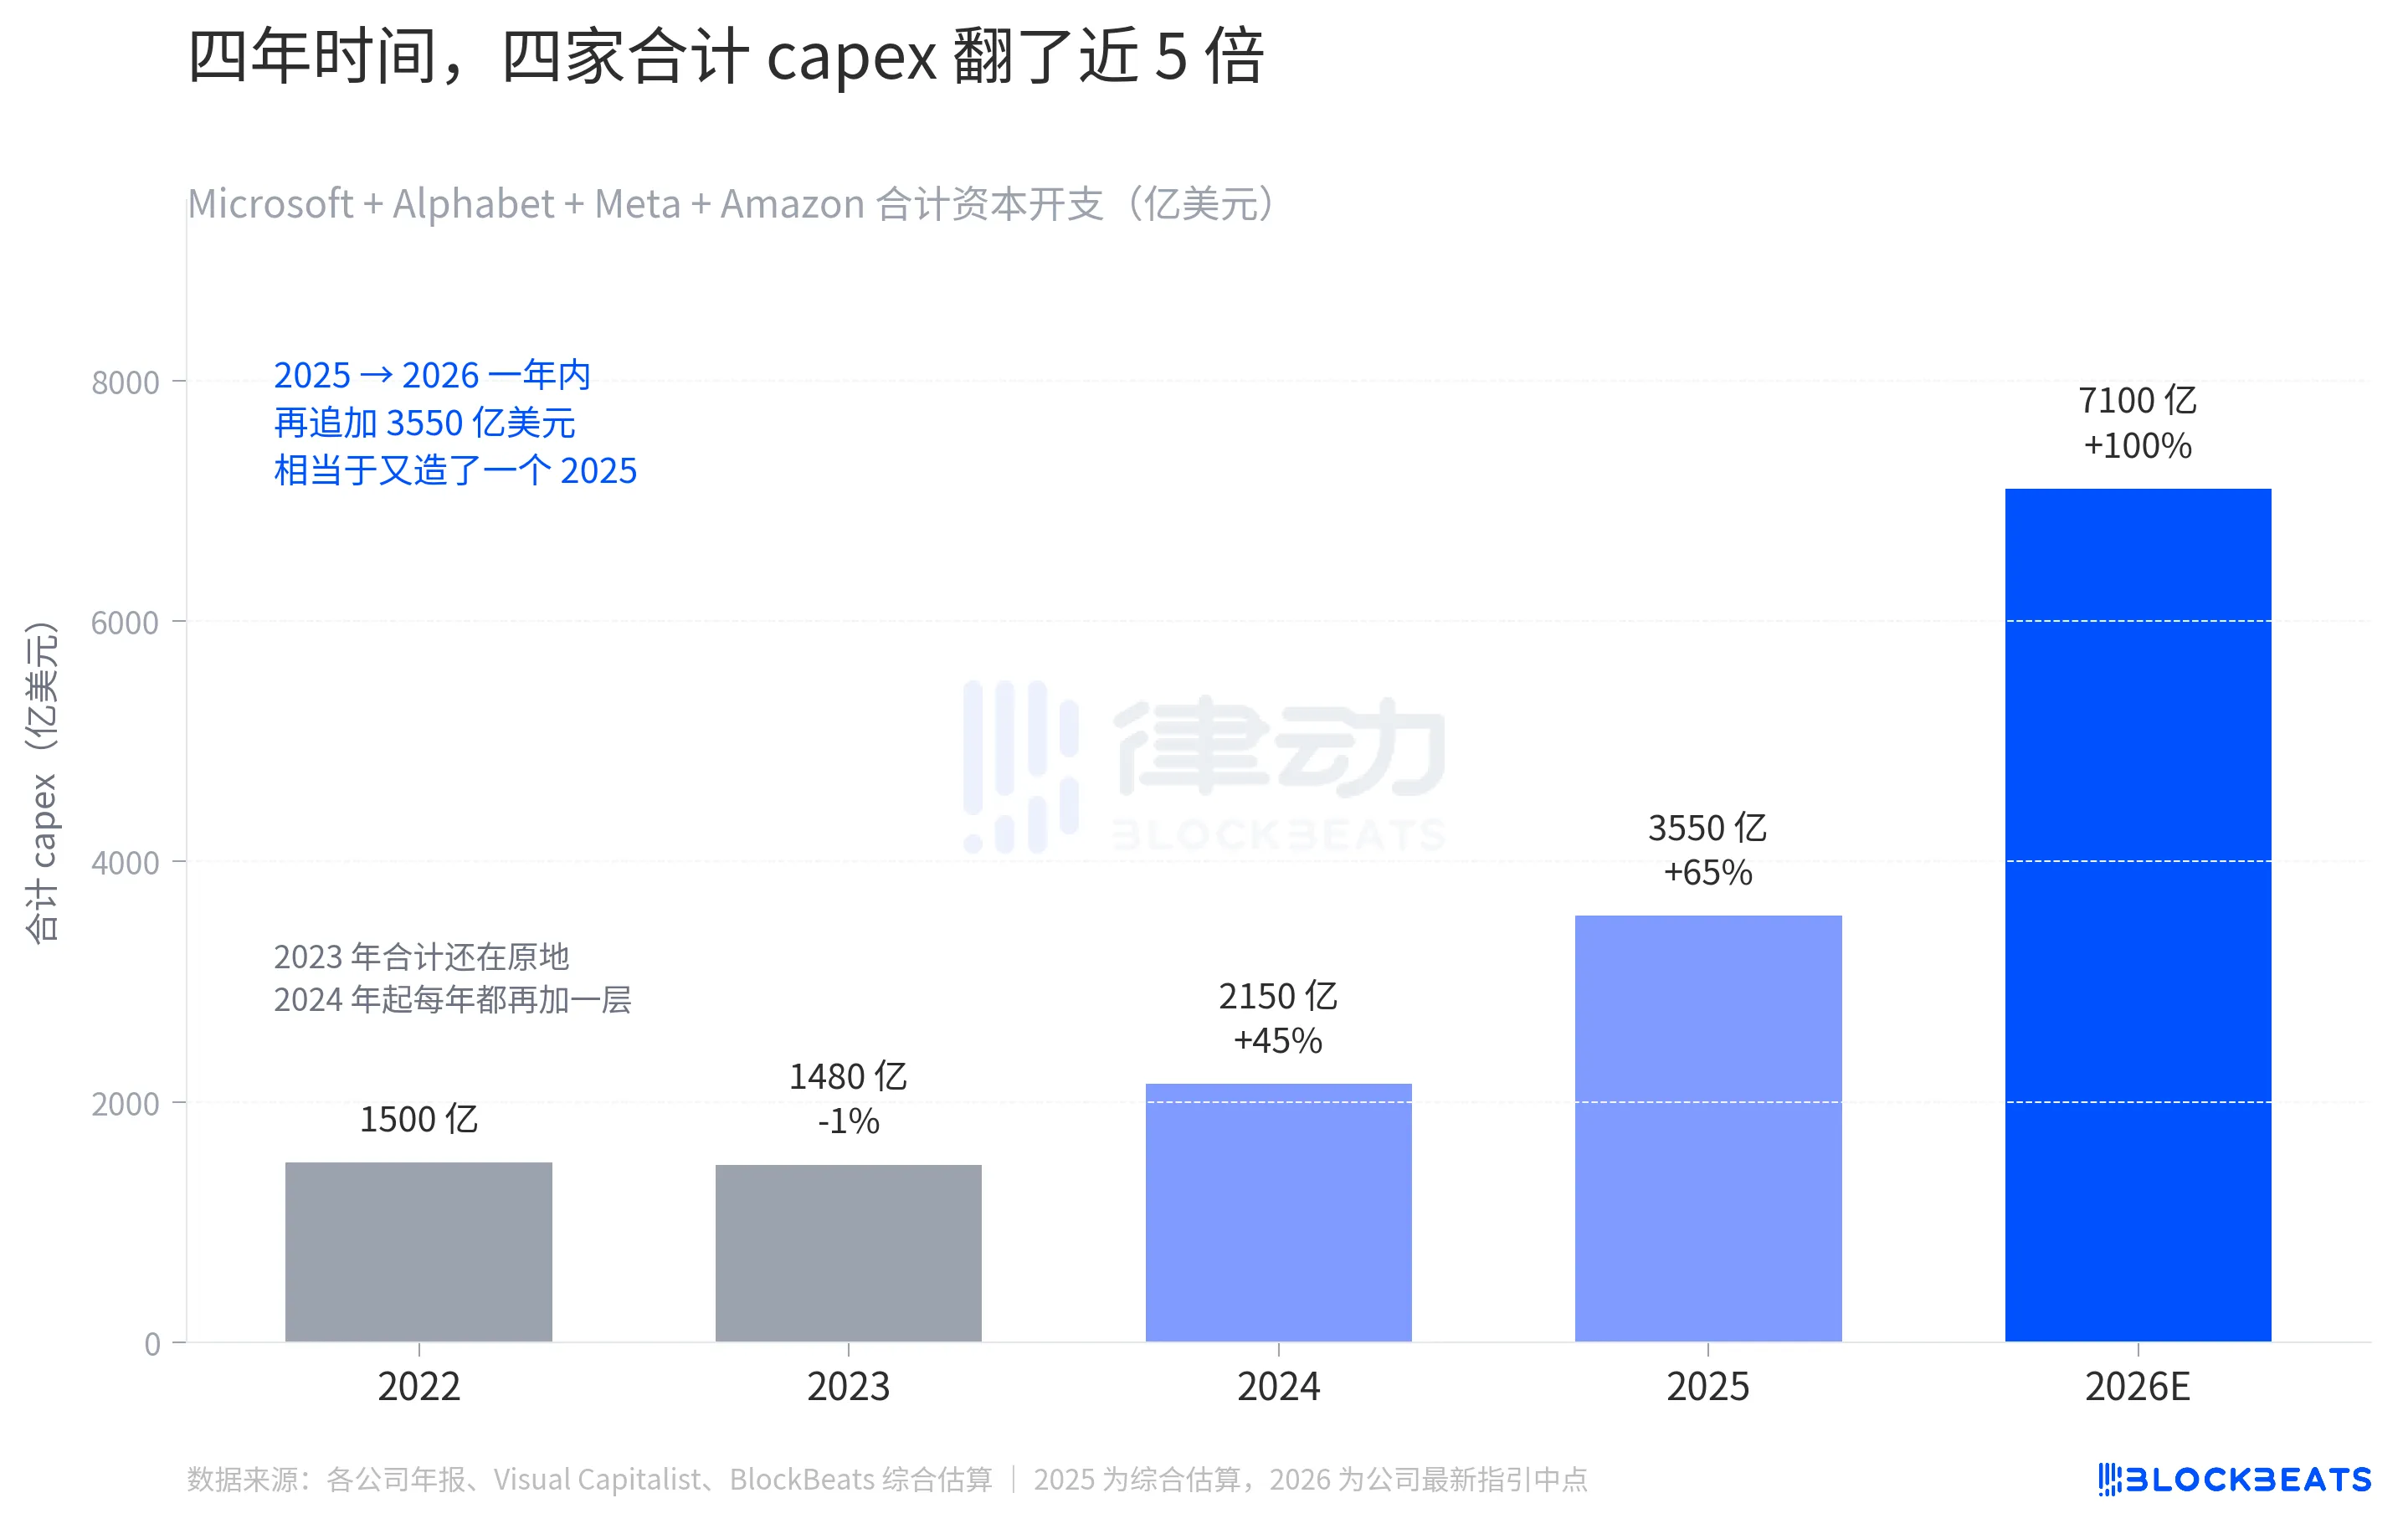
In 2022, these four companies combined spent approximately $150 billion in capital expenditures; in 2023, their total remained roughly flat, and it wasn’t until 2024 that it jumped to $215 billion. Over the two years from 2022 to 2024, these four companies collectively increased spending by $65 billion. 2024 marked the true turning point: starting this year, each year’s spending added another layer on top of the previous year’s. In 2025, the estimated total is $355 billion—nearly doubling the 2024 figure—followed by $710 billion in 2026.
This span is more dramatic than any previous year; the annual increase from 2025 to 2026 is $355 billion—equivalent to creating an entire year’s worth of spending comparable to 2025. In just four years, capex has shifted from “each company building a few data centers per year” to “the combined efforts of four companies building an entire country’s worth in a single year.”
This table is reshaping supply and demand across the entire industry chain. When Microsoft raised its capex, it specifically noted that $25 billion was due to “high memory prices,” and Meta also mentioned rising component costs. While capex figures themselves continue to grow, a significant portion is being siphoned backward up the compute supply chain—prices for HBM, CoWoS packaging, electricity, land, and transformers are all rising. For the same $1 billion, you’ll get less compute power in 2026 than in 2024.
The two that rose—what did they do right?
Four companies are spending the same amount of capex, but only Google and Amazon provided evidence this quarter that the money has started to generate returns.
Google Cloud's revenue this quarter reached $20 billion, a 63% year-over-year increase—the first time Google Cloud has come close to the scale of AWS and Azure. Operating profit surged from $2.2 billion a year ago to $6.6 billion, tripling year over year. The unfulfilled contract backlog increased nearly twofold quarter-over-quarter to $460 billion, significantly boosting revenue visibility for the coming years.
Gemini Enterprise's paid MAU increased by 40% quarter-over-quarter, bringing the company's total paid subscriptions to 350 million, temporarily halting the year's dominant bearish thesis that "AI is stealing search traffic."
Amazon pushed AWS to its highest level in 15 quarters. AWS generated $37.6 billion in revenue this quarter, up 28% year-over-year, exceeding market expectations of 26%. AWS operating profit reached $14.2 billion, surpassing StreetAccount’s consensus estimate by 10%. Meanwhile, advertising revenue stood at $17.2 billion, up 24% year-over-year, also exceeding market expectations. The simultaneous acceleration of these two high-margin businesses is key to why the market is willing to temporarily tolerate Amazon’s $200 billion capital expenditure pace.
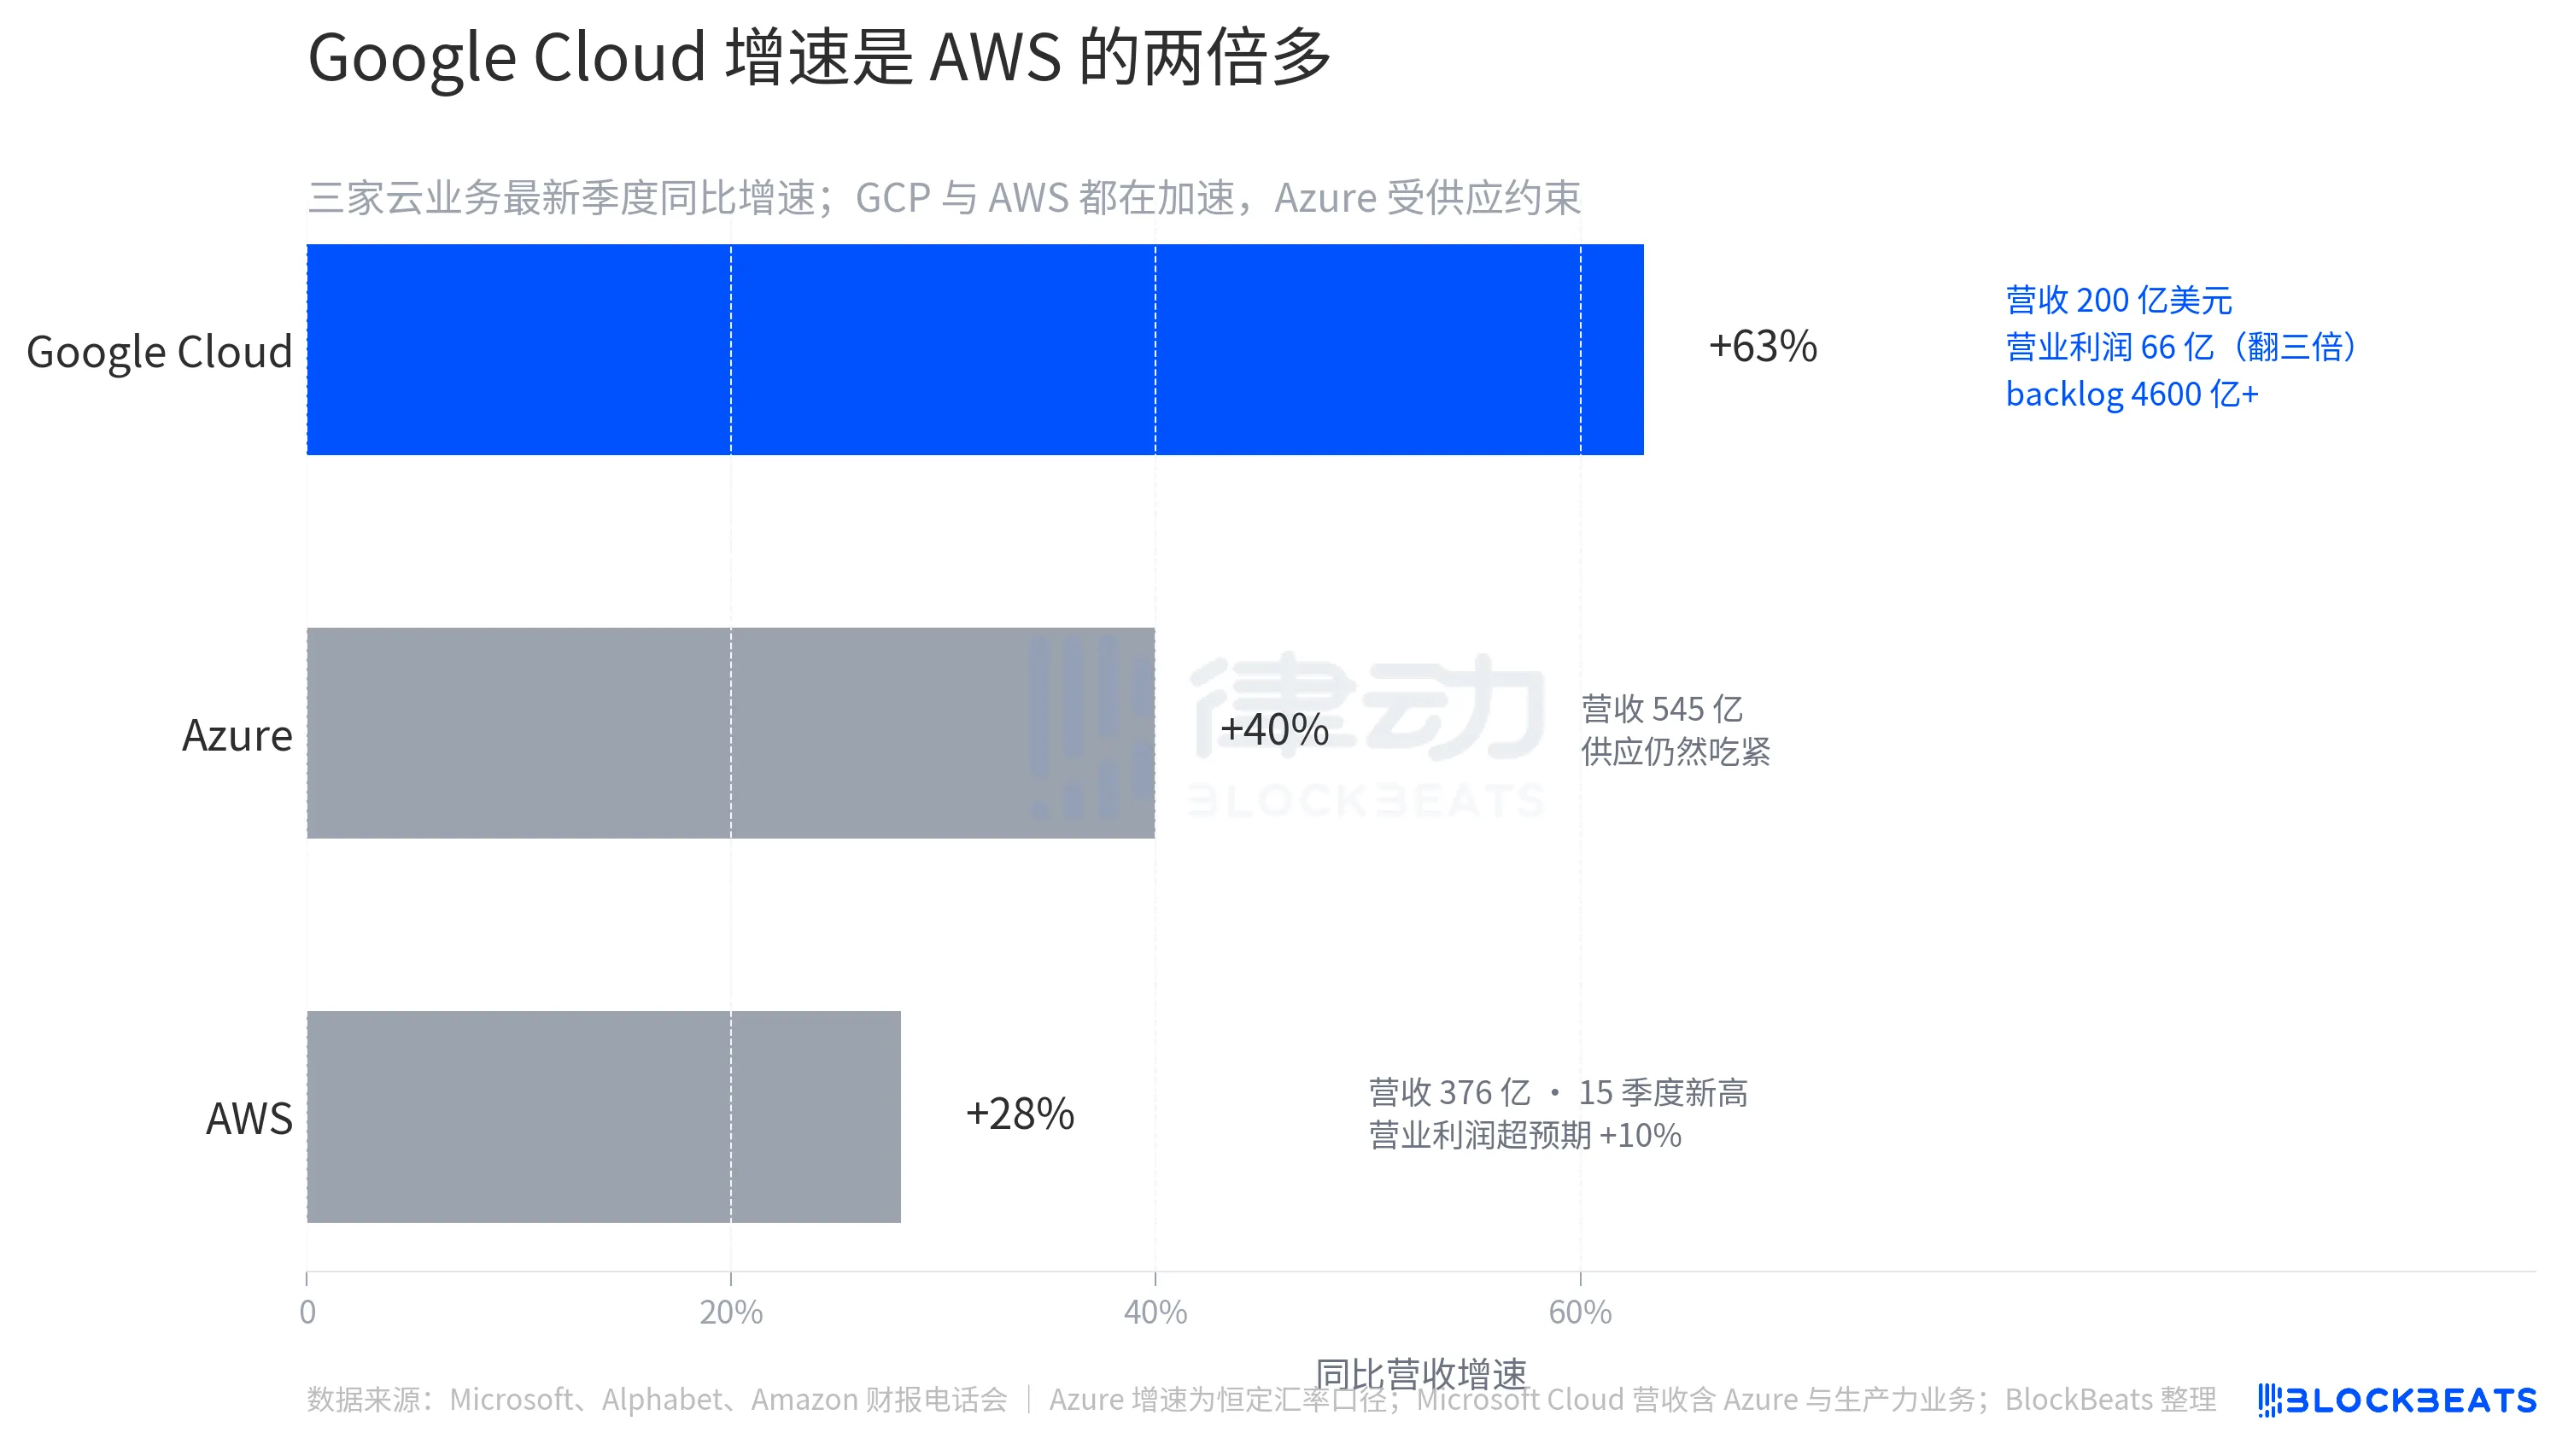
Compare Microsoft and Meta. Microsoft Azure grew 39%-40% (at constant exchange rates), looking strong on paper, but CFO Amy Hood directly told investors that Azure’s compute capacity constraints will persist at least until the end of fiscal year 2026—that is, after June 2026. Customer demand continues to outpace supply, with bottlenecks stemming from GPU availability and data center construction speed. Microsoft will need to wait several more quarters before converting its capital expenditures into billable Azure revenue.
Meta's own performance was strong, but the overall increase in capex combined with a quarter-over-quarter decline in DAU sent a message to the market of “spending more now, while user engagement at the front end is weakening.” This was the worst-performing scenario among the four companies.
Four earnings reports released on the same day made one thing clear: the ability to beat consensus expectations has become oversaturated, and the market is now grouping the four companies based on their conversion progress. Those that can turn capex into revenue or profit within the same quarter are rewarded; those that can only show higher spending are punished.
Source:律动 BlockBeats