


Original author / Castle Labs
Compiled / Odaily Planet Daily Golem (@web 3_golem)

Editor’s Note: This article systematically analyzes the differences in crude oil contract trading data between Hyperliquid and CME during weekdays and weekends, drawing several key conclusions. Currently, Hyperliquid indeed cannot match CME in absolute metrics such as liquidity depth or slippage, with overall liquidity accounting for less than 1%, a reflection of the fact that the primary users of RWA trading platforms remain crypto-native retail traders.
What sets Hyperliquid apart is the significant increase in trading volume for crude oil contracts on weekends. This indicates that, in addition to retail traders seeking speculative opportunities, institutional traders looking to gain exposure to crude oil or hedge their positions before Monday are also active on Hyperliquid. This trend is becoming increasingly pronounced, enabling Hyperliquid to develop price discovery capabilities for commodities.
However, for institutional investors, Hyperliquid’s high trading costs compared to CME remain a major barrier to its expansion in the commodities trading space. If Hyperliquid does not promptly enhance its ability to handle institutional-grade orders, it will remain only a temporary weekend trading venue for traditional traders, ultimately becoming a minor footnote in the traditional financial landscape.
Research methodology and data sources
This analysis evaluates the microstructure of the crude oil market through two studies, covering markets during weekdays and weekends, utilizing tick-by-tick trade data from two trading venues: the xyz:CL perpetual contract on Hyperliquid and the CLJ6 contract (April 2026 NYMEX WTI Crude Oil futures) on the Chicago Mercantile Exchange (CME).
CME data is sourced from Databento’s trade data feed, which captures tick-by-tick trade data rather than order book snapshots. Therefore, all depth and slippage estimates for CME are based on actual traded volume, not quoted depth. Hyperliquid data is sourced from Hyperliquid’s public S3 database, which contains complete on-chain trade records.
Therefore, analysis of both exchanges is based on actual trading volume. All depth data represents explicit liquidity—volume within a specific basis point range around the VWAP midpoint over a 5-minute window—rather than the full resting depth on the order book.
Research period and market context
The research period spans from February 27 to March 16, 2026, a time marked by geopolitical instability following Iran's attack on February 28, 2026.
- Market close prior to the attack: The last CME trading day before the attack.
- Monday open: The market reopens under significant pressure, with CME stock gapping sharply higher, while the Hyperliquid xyz:CL market is constrained by boundary limits.
- The following weekends: Due to persistently high oil prices, market volatility led to sustained high trading volumes on the Hyperliquid platform.
xyz:CL launches in early 2026, meaning this three-weekend observation period covers the early maturation phase of the Hyperliquid market. Observed trends—including improved liquidity depth, increased trading volume, and growing user numbers—partially reflect market maturation. However, we believe that on-chain exchanges currently cannot match traditional exchanges in absolute metrics such as liquidity depth or slippage.
Our research aims to track directional trends: whether the spread between the two is narrowing, how quickly it is narrowing, and under what conditions.
Data analysis
Data analysis is divided into two parts by time period:
- Business day period: Covering the full three-week period, compare the depth, slippage, and premium/discount of trades on Hyperliquid and CME during business days. For Hyperliquid, we also analyze its funding rates throughout the entire period.
- Weekend period: Over the given time frame, which includes three weekends, we analyzed price discovery and the price gap deviation of Hyperliquid relative to the CME opening price.
Weekday time period data analysis
This analysis covers the full three-week period, focusing on the time when both exchanges were active.
Liquidity depth is measured by the dollar volume within ±2, ±3, and ±5 basis points of the VWAP midpoint over each 5-minute interval, aggregated as the median across all weekday intervals. As noted above, this reflects traded volume within the interval rather than resting quote depth. This methodology may understate the liquidity depth of CME and Hyperliquid.
Slippage is estimated using a synthetic order book ranked by execution price. Within each 5-minute period, observed taker trade records are sorted in ascending order of price (simulating a market sell order), and sell orders are executed sequentially until the target order size is reached. The arrival price is set as the lowest executed price during that period (representing the best ask price at order arrival). Slippage is calculated as the difference between the volume-weighted average price (VWAP) of execution and the arrival price, expressed in basis points. This method is applied to order sizes ranging from $10,000 to $1,000,000 in increments.
Hypeliquid-CME basis during business hours: Tracks the signed price difference between the Hyperliquid mid-price and the CME last price within all business hour 5-minute windows. This reflects any structural premium or discount of Hyperliquid relative to the CME reference price during active trading periods. The Hyperliquid mid-price is derived from the volume-weighted average price (VWAP) of trades within each 5-minute interval, not from real-time order book quotes.
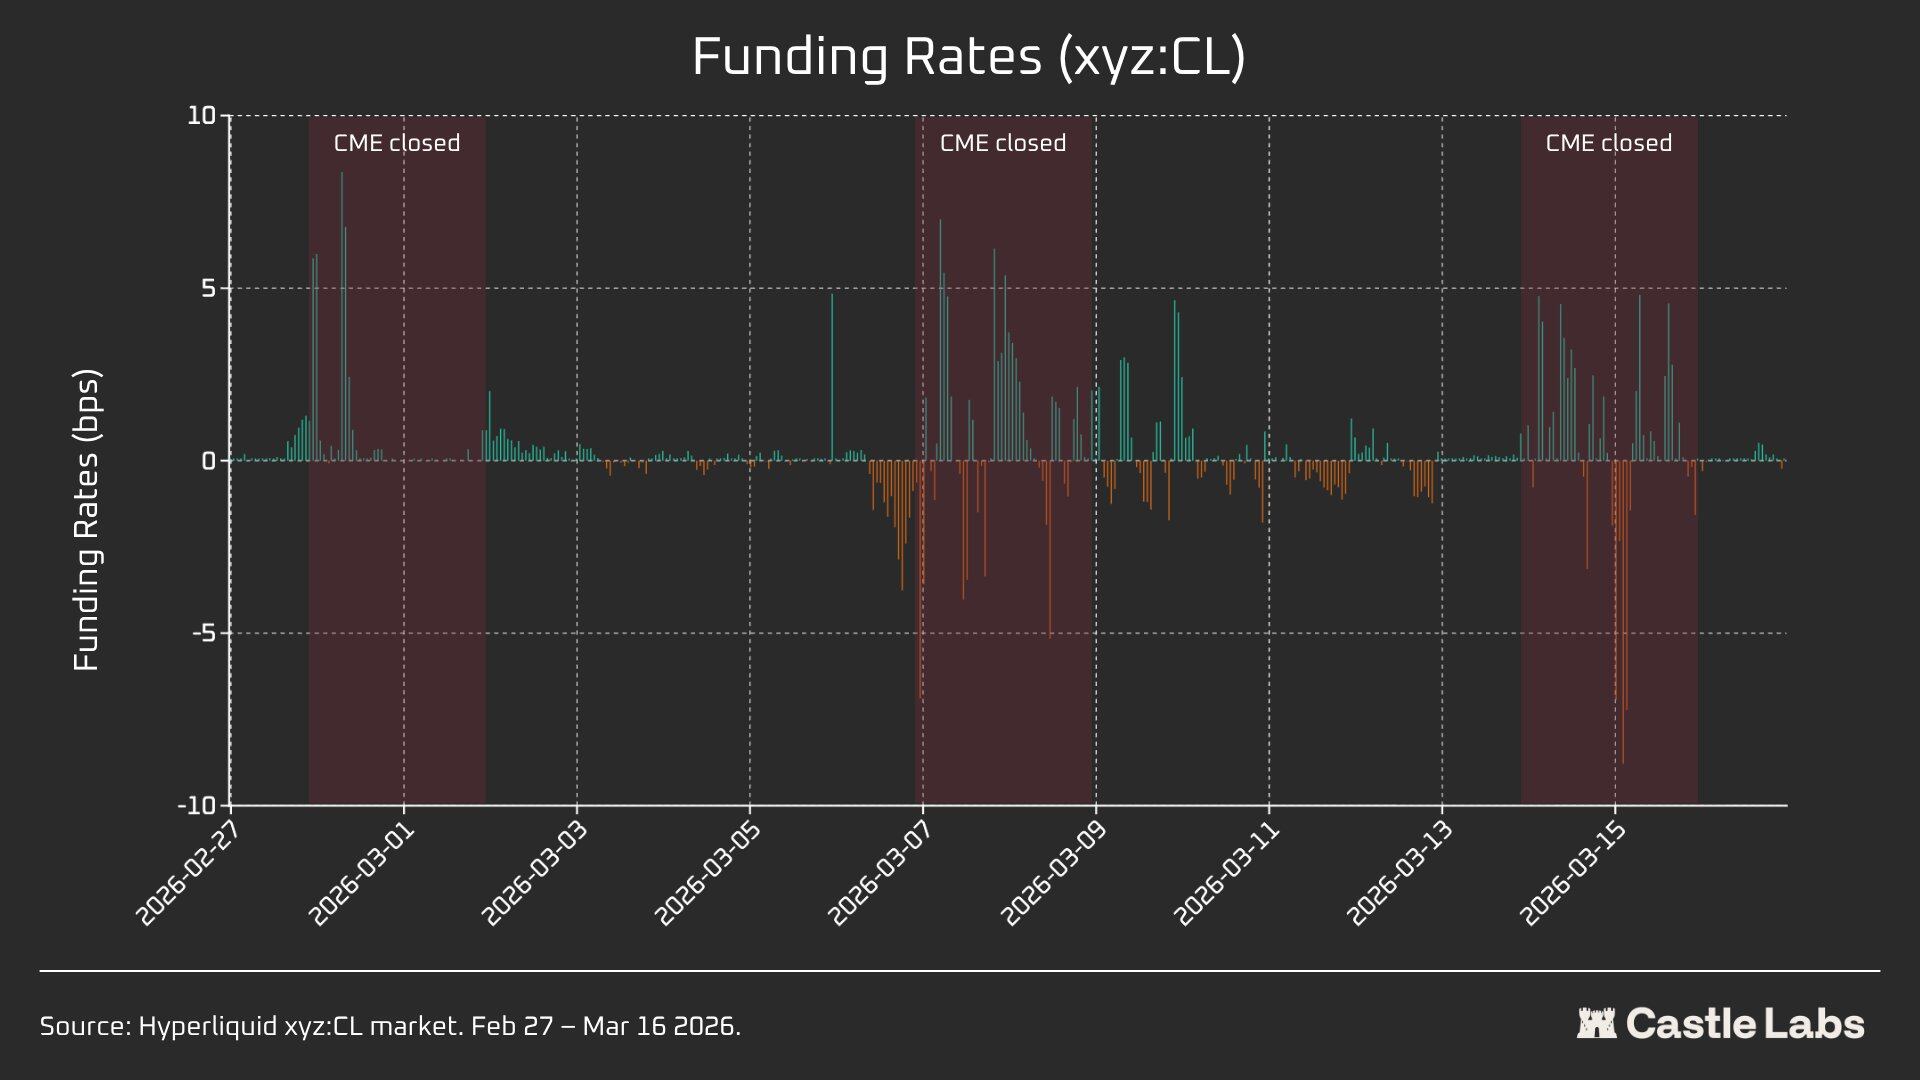
Hyperliquid funding rates are priced hourly, with funding rates expressed in basis points per hour.
Weekend period data analysis
This analysis focuses on three distinct weekend market closure periods at CME:
- W1: February 28 to March 1, 2026
- W2: March 7–8, 2026
- W3: March 14–15, 2026
On W1 and W2, Hyperliquid perpetual contracts are subject to restrictions, so the mark price cannot exceed the "domain boundary" (DB). When the oracle price is frozen—for example, when the primary reference market (CME) is closed and external price data sources stop updating—the protocol effectively constrains the price within a narrow range.
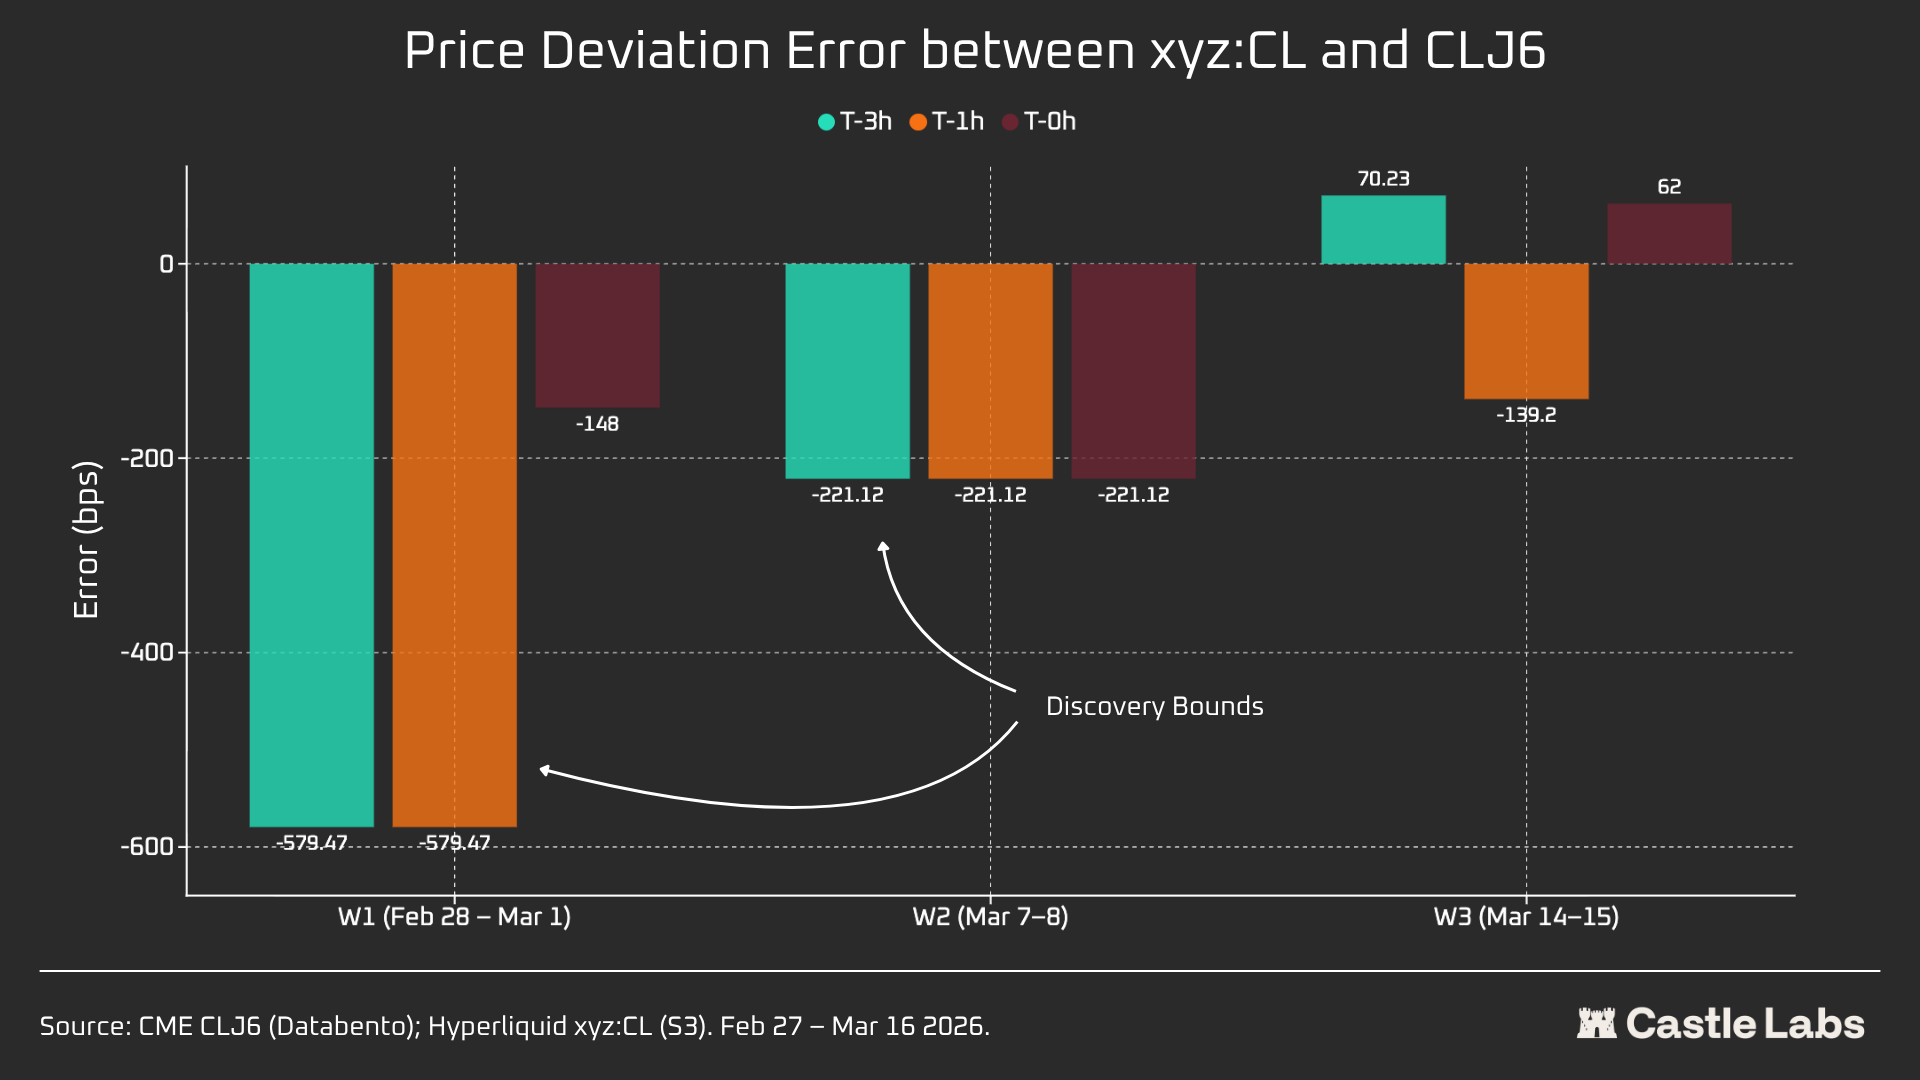
For each weekend window, we report key data metrics for Hyperliquid xyz:CL, including price, volume, and number of trades. To measure Monday opening spread deviation, each weekend we measure the price gap between Hyperliquid and CME at three reference points:
- 3 hours before CME reopens
- 1 hour before CME reopens
- CME opens at (T=0)
All spreads are expressed in basis points; positive values indicate Hyperliquid is trading at a premium to the CME opening price, while negative values indicate a discount.
Quantitative analysis
This section first analyzes and compares the liquidity of the Hyperliquid xyz:CL HIP-3 crude oil market with NYMEX CLJ6 during overlapping weekday hours.
Liquidity depth: Hyperliquid is less than 1% of CME's
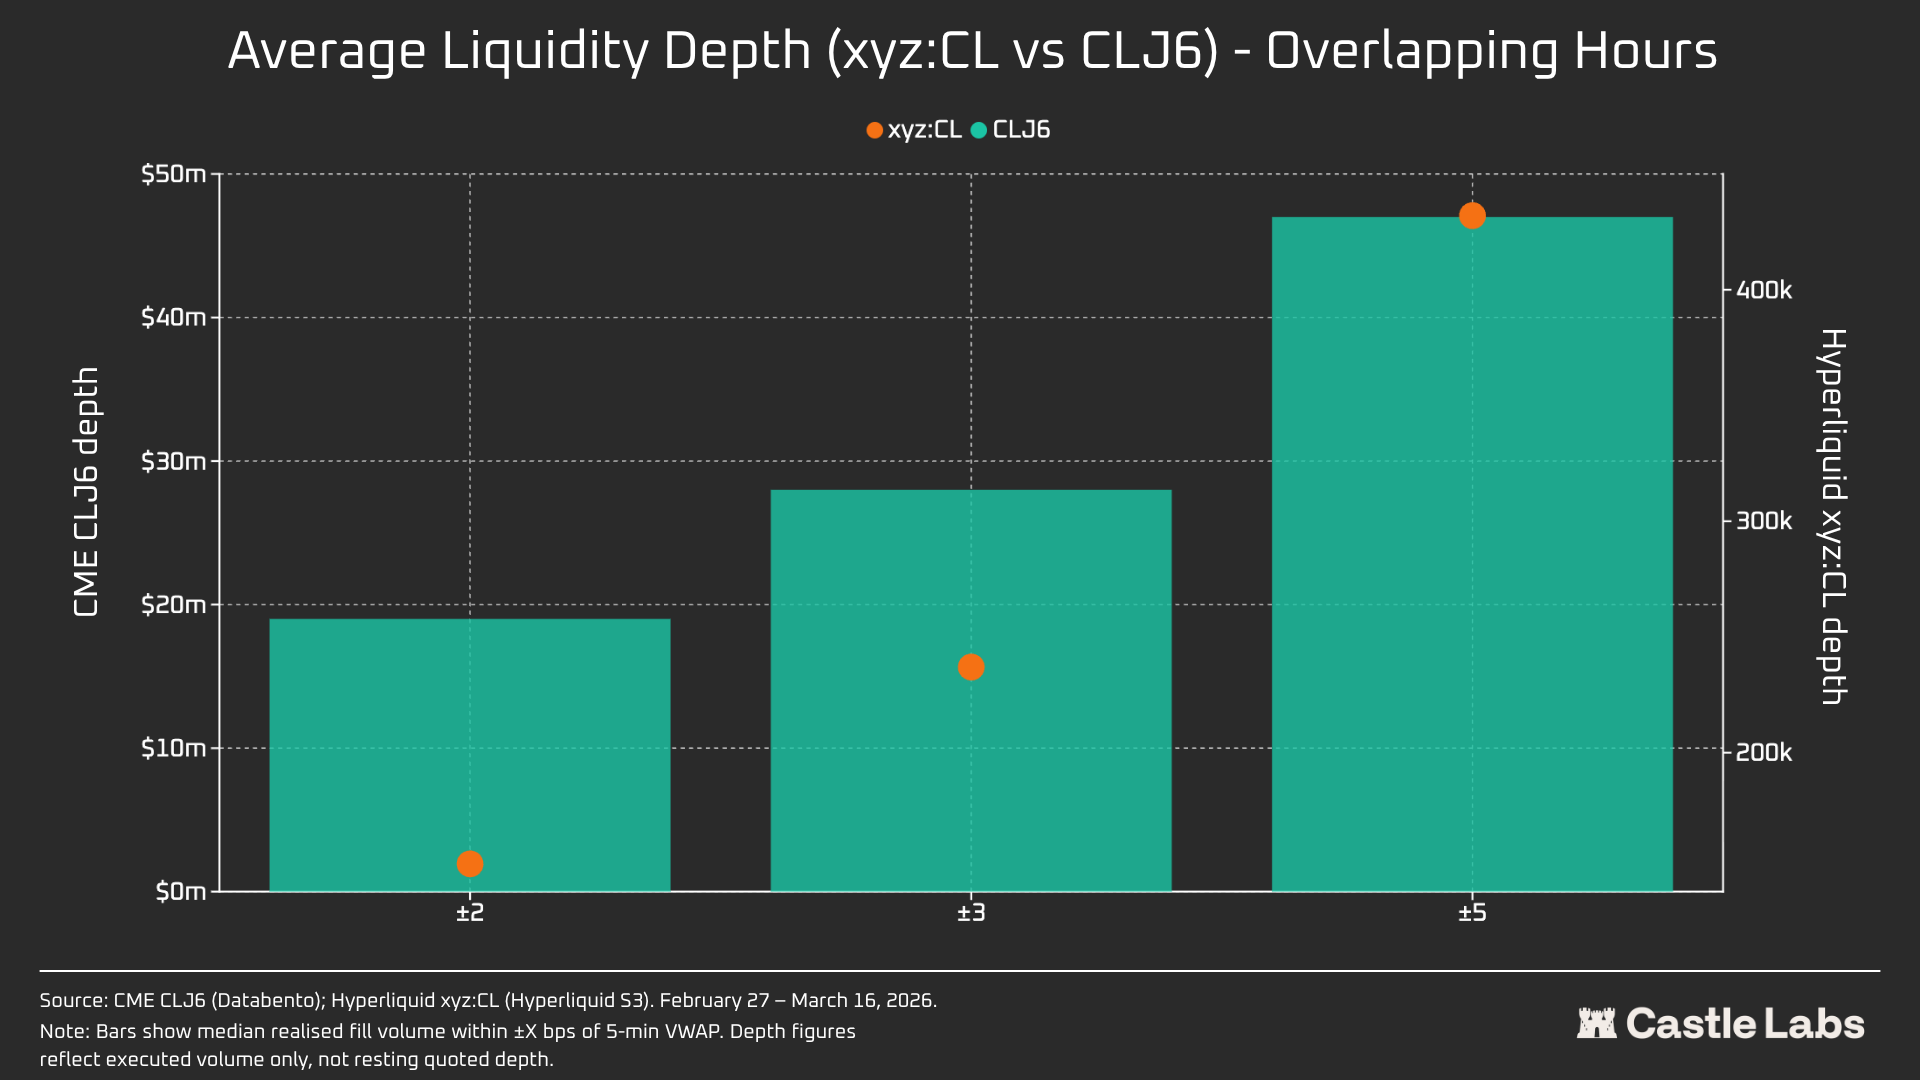
Undoubtedly, the liquidity conditions of on-chain exchanges differ drastically from those of CME. On Hyperliquid, the average liquidity depth of CL is less than 1% of CLJ6, with consistent liquidity depth across price levels (109x at ±5 bps). Within a ±2 bps range around the mid-price, CME’s executable depth is $19 million, while Hyperliquid’s is only $152,000—a difference of 125x.
Given the novelty of the CL market on Hyperliquid and its distinct target user base, this outcome is not surprising. The primary value of on-chain exchanges lies in providing permissionless trading access to users who are traditionally excluded by institutional platforms such as CME.
However, as weekend trading volumes on DEXs like Hyperliquid grow, perceptions of these platforms are shifting, and institutional investors are increasingly interested in hedging positions during non-trading hours, making it increasingly important for Hyperliquid to create a market environment suitable for both traditional investors and retail users.
For retail traders with a trading volume of $10,000, this cost difference is negligible. However, for institutional investors with trading volumes exceeding $1 million, on-chain transaction costs on CL (and most other markets) remain prohibitive.
In fact, inherent differences in the user base are reflected in the median trade size during these overlapping market periods.
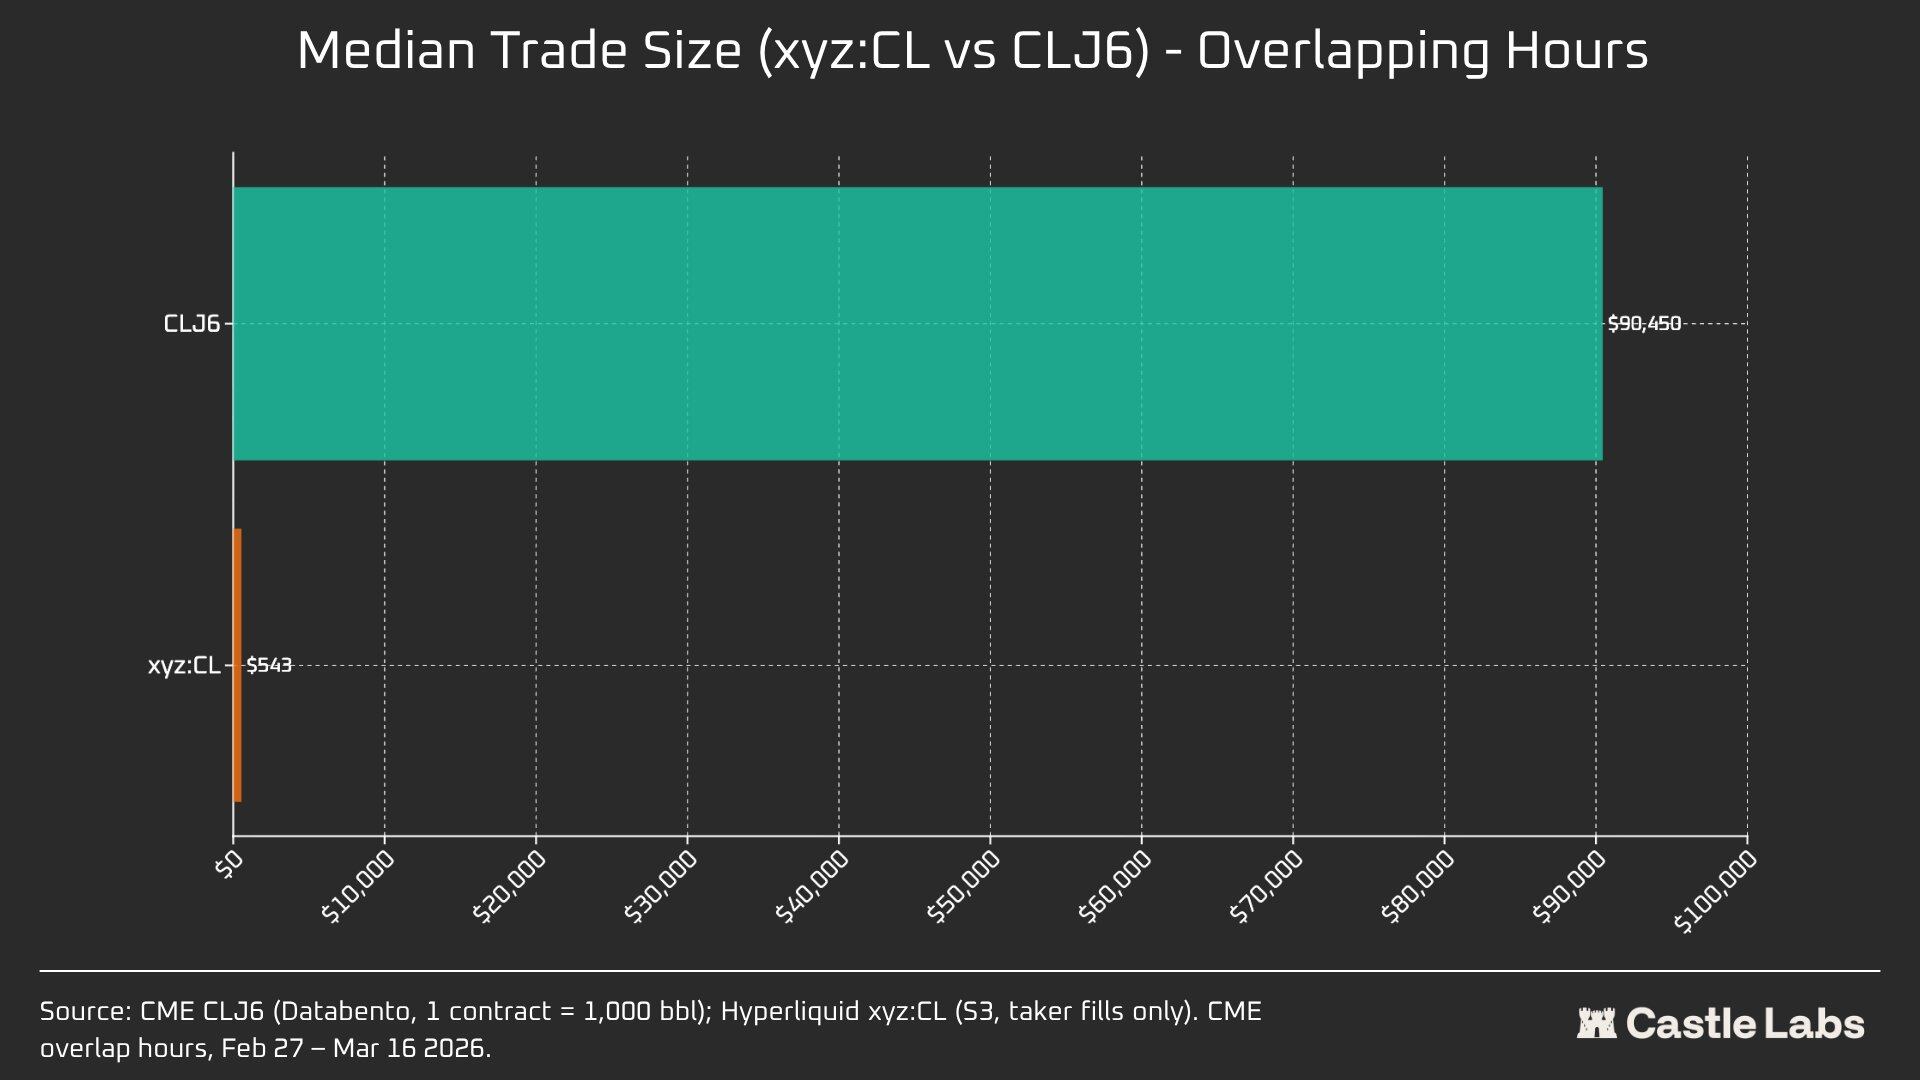
The median trade size differs by a factor of 166 ($90,450 vs. $543), most clearly demonstrating a fundamental difference in the user bases served by these venues. CLJ6’s median trade size is comparable to a standard crude oil futures contract (with a notional value of approximately $94,000 at current prices), while Hyperliquid’s median trade size of $543 reflects leveraged directional bets made by crypto-native retail traders.
We expect the median trade size on Hyperliquid’s commodity markets to reach a turning point as these markets become increasingly legitimized in the eyes of more traditional investors and capital shifts on-chain.
To further differentiate between various trade sizes, we conducted order simulations with order size limits ranging from $10,000 to $1,000,000.
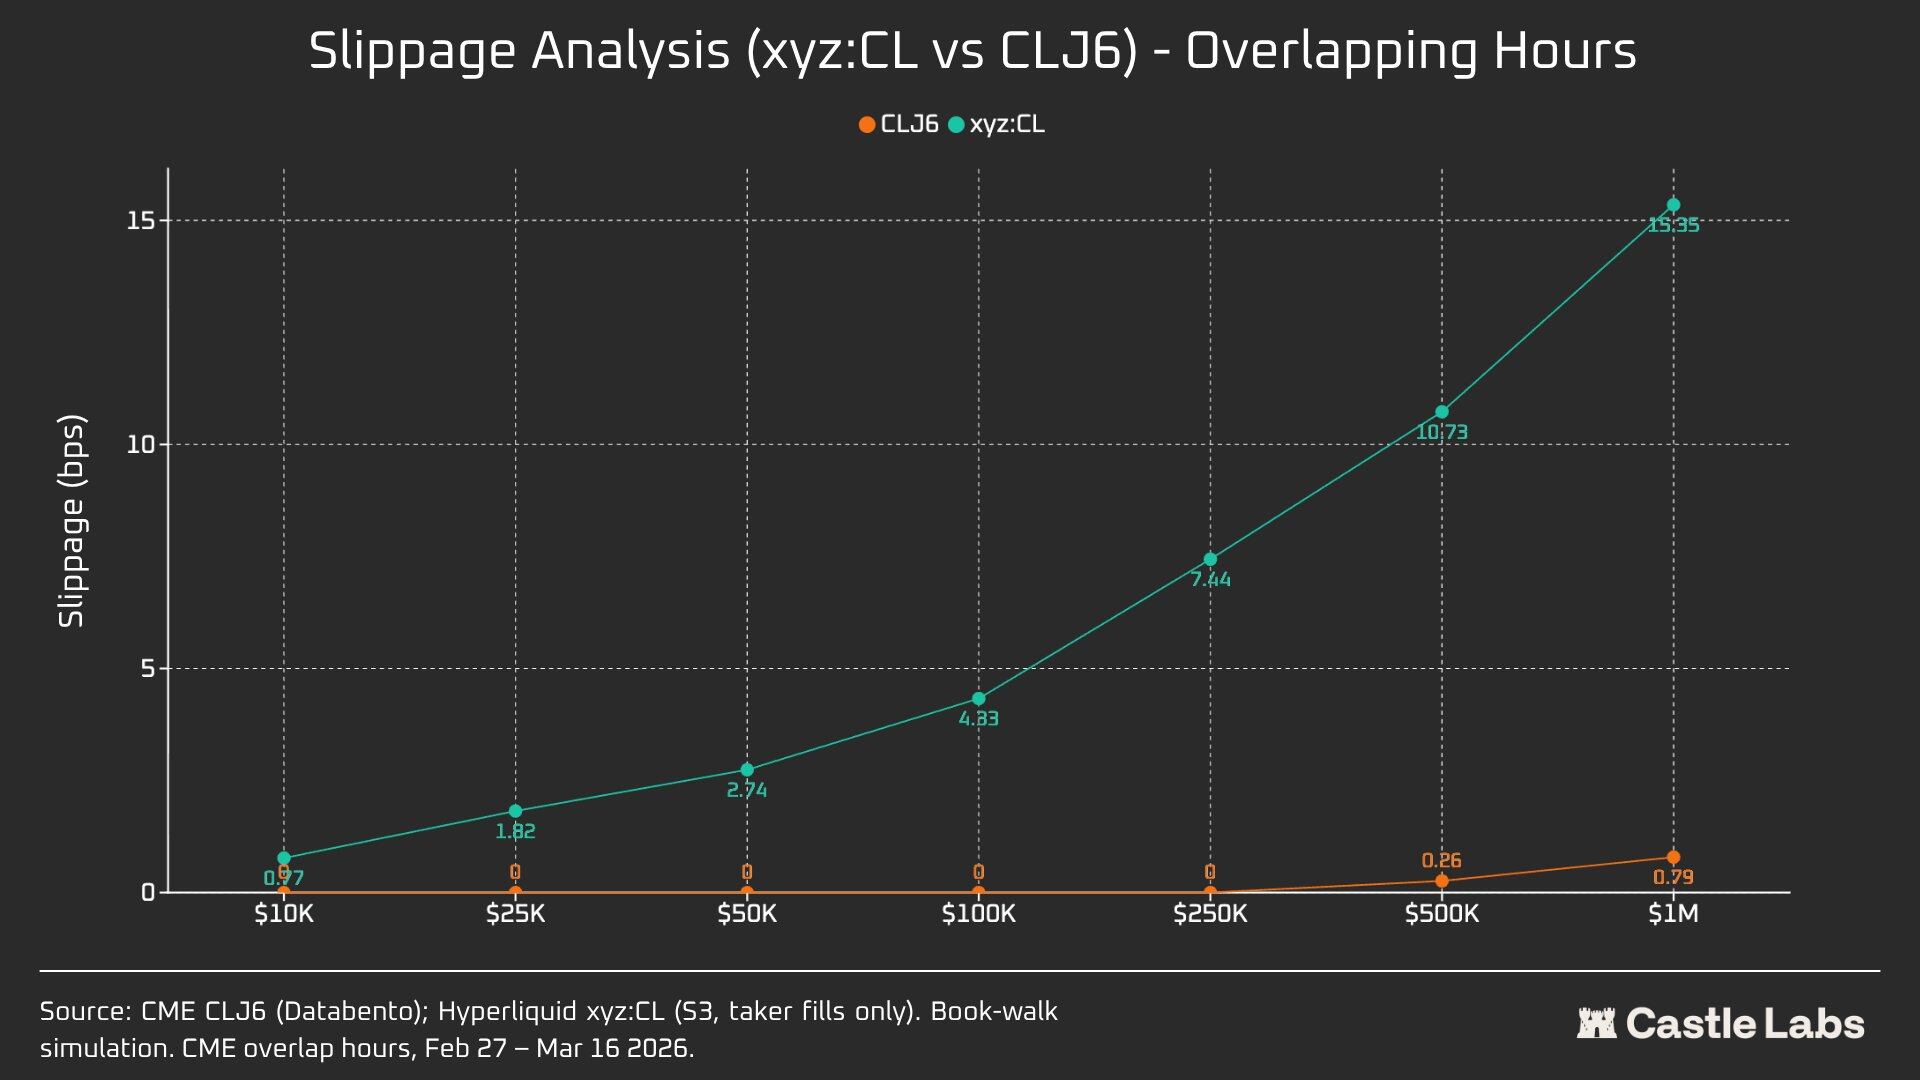
For a $10,000 order, the CLJ6 trader experienced no slippage, as expected, while Hyperliquid users had a median execution slippage of 0.77 basis points, below 1 basis point. The difference appears at the $100,000 order level, where Hyperliquid users’ slippage rises to 4.33 basis points, nearing the 5-basis-point threshold, while CME CLJ6 shows no slippage.
Notably, this exceeds the median trade size in the CLJ6 market ($90,450).
At a $1 million trade size, Hyperliquid’s 15.4 basis points are about 20 times CME’s 0.79 basis points, confirming that the platform currently lacks the capacity to handle institutional-grade orders. Given Hyperliquid’s average trade size, the platform could deliver equally excellent service to users without any slippage.
CLJ6 orders begin to experience noticeable slippage affecting their execution at trading volumes around $500,000.
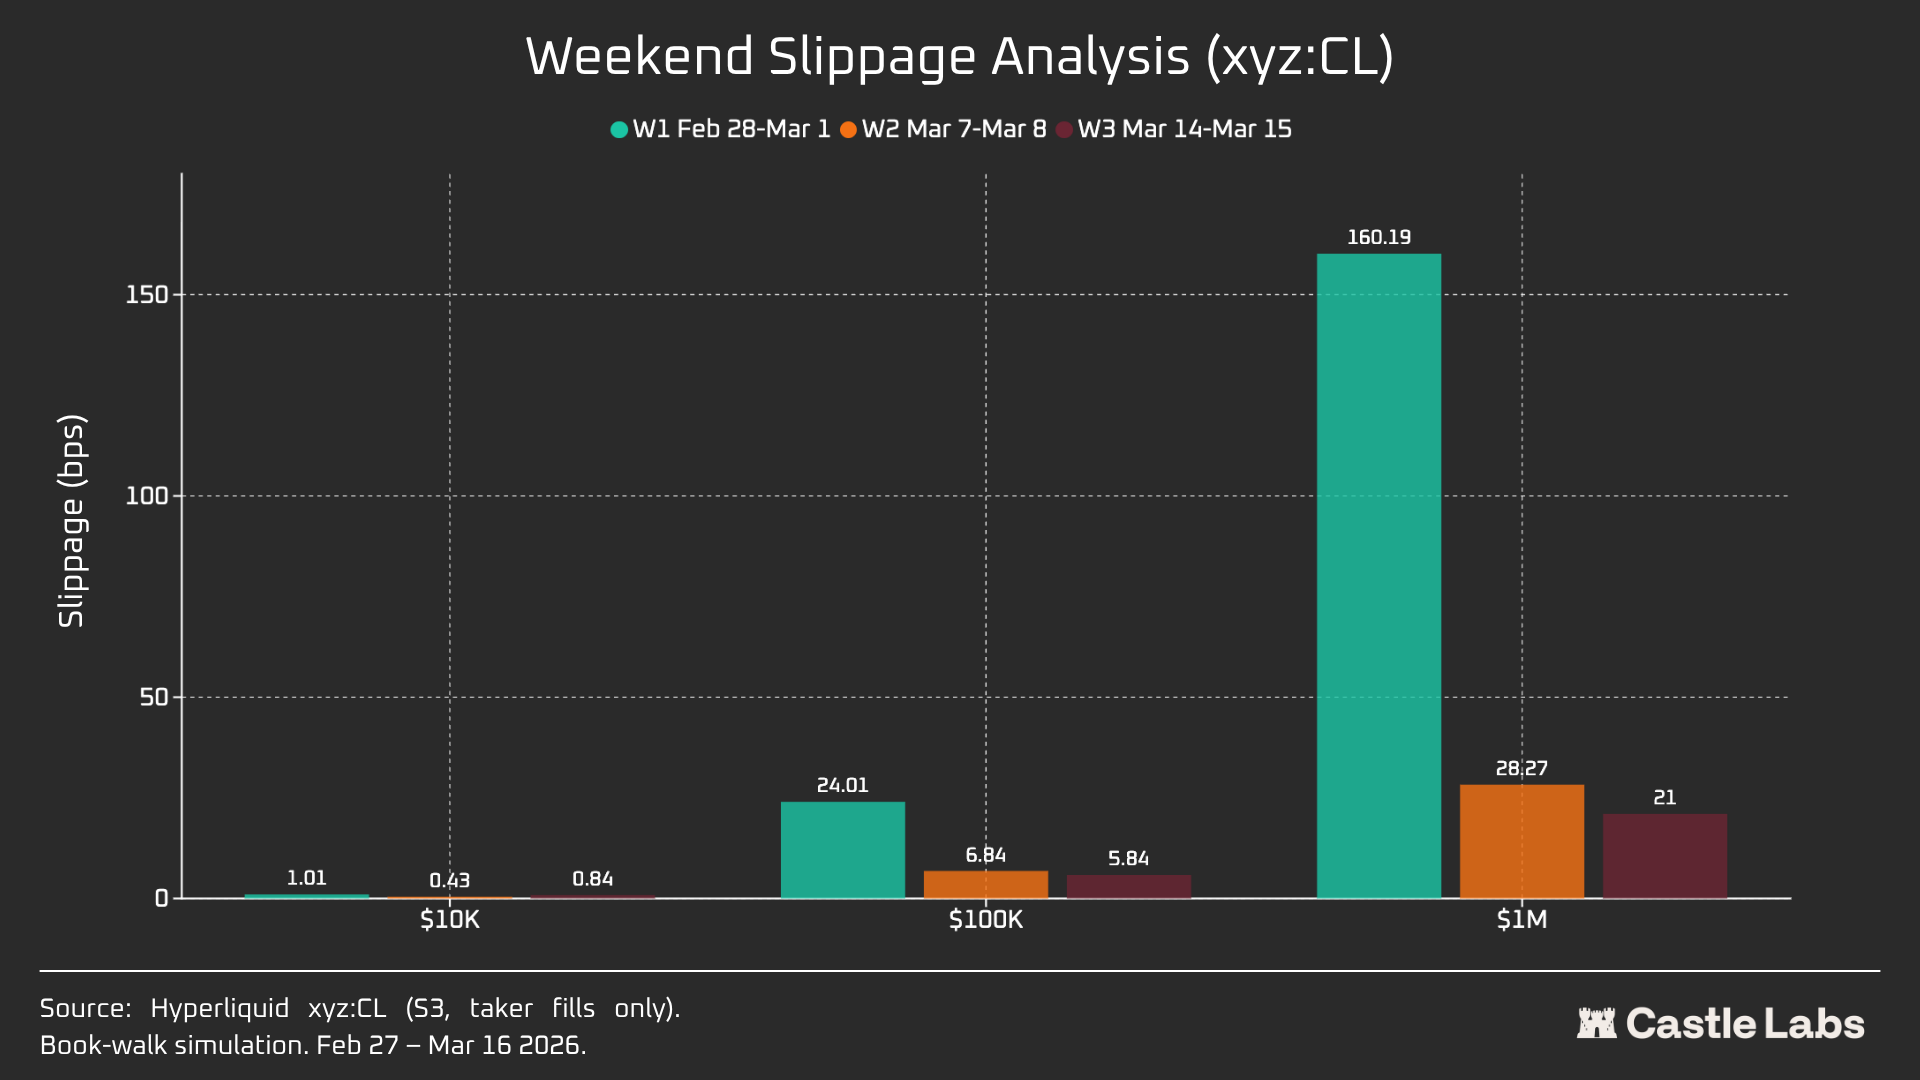
When we extended the order size analysis to include weekends, slippage decreased across all order sizes, particularly for $100K and $1M order sizes, indicating a more mature market. Over the three-week analysis period, slippage reductions for simulated orders were as follows:
- $10,000: -16%
- $100,000: -75%
- $1,000,000: -86.9%
Funding rate
CL's funding rate exhibits greater volatility during CME's closing session but less volatility during delivery periods. This helps us uncover the internal pricing dynamics of the market during non-trading hours. Weekend openness allows the CL market to leverage internal price discovery mechanisms (supported by DB and other risk-reduction measures). As a result, the funding rate is expected to be more volatile, as highlighted below.
During active trading hours, Hyperliquid's xyz:CL closely tracked CME's CLJ6, but as oil prices rose, a structural discount emerged and widened, likely due to funding rate pressure from accumulated long positions. Over the weekend, while CME was closed, Hyperliquid's price discovery was further constrained by the price band mechanism (DB), which limits the movement of the mark price in the absence of a real-time reference market.
Weekend analysis: Hyperliquid has developed price discovery capability.
These three weekends demonstrated the rapid maturation of the Hyperliquid market:
W1: February 28 to March 1, 2026 (Iranian strike event)
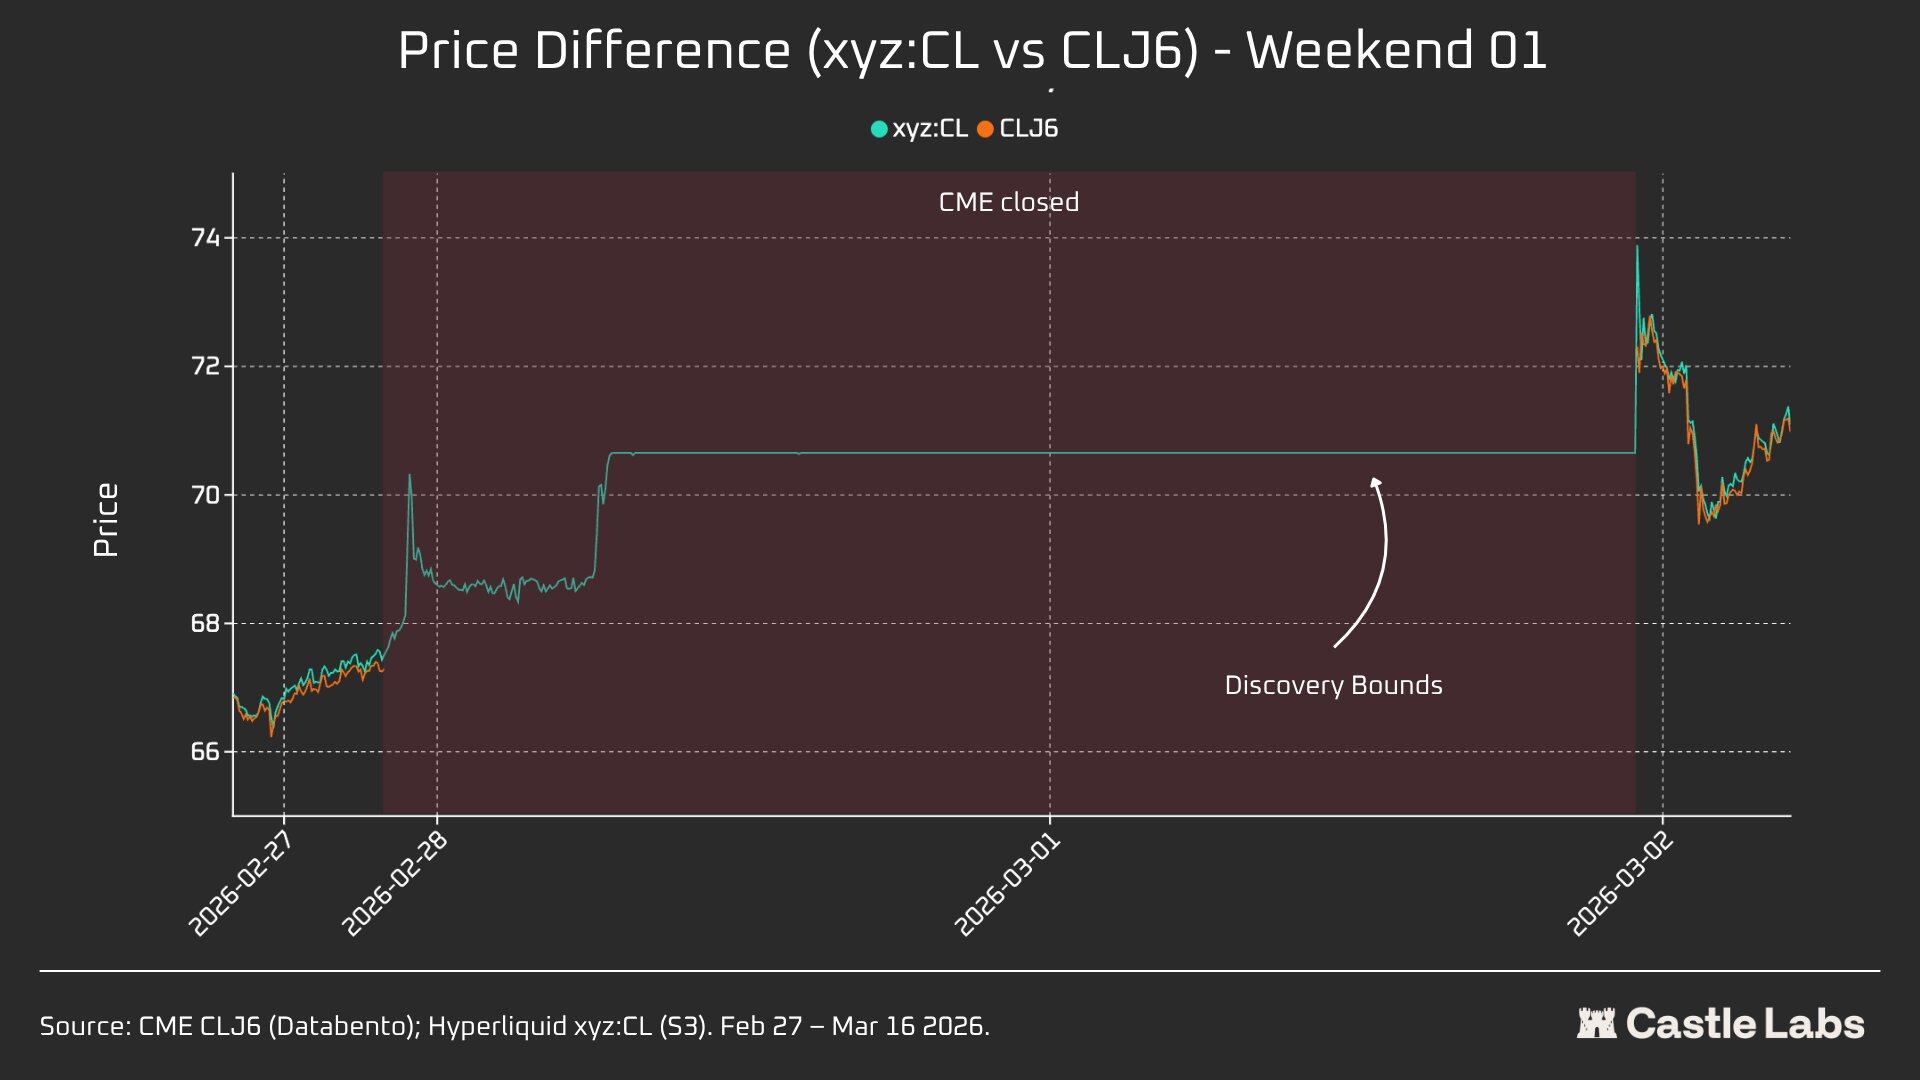
The price on Hyperliquid rose from around $67.29 on CME to approximately $70.80, representing about 45% of Monday’s final gap-up to $75 (+1,146 basis points).
It is important to note that due to the ±5% price range restriction mechanism (DB) for trade.xyz mentioned above, price discovery this weekend was constrained. This explains why the curve in the chart is relatively flat and why a gap-up occurred on Monday. Nevertheless, within the first second of the pair data release, the spread between Hyperliquid xyz:CL ($73.89) and CME CLJ6 ($75) was within 1.5%.
This is not a "mistake" or "failure," but a risk protection mechanism achieved through market design. Therefore, from a data perspective, the first weekend showed the lowest correlation, yet it highlighted xyz:CL's initial response to the Iranian airstrikes, while also recognizing the importance of DB as a weekend price discovery mechanism, particularly for emerging markets.
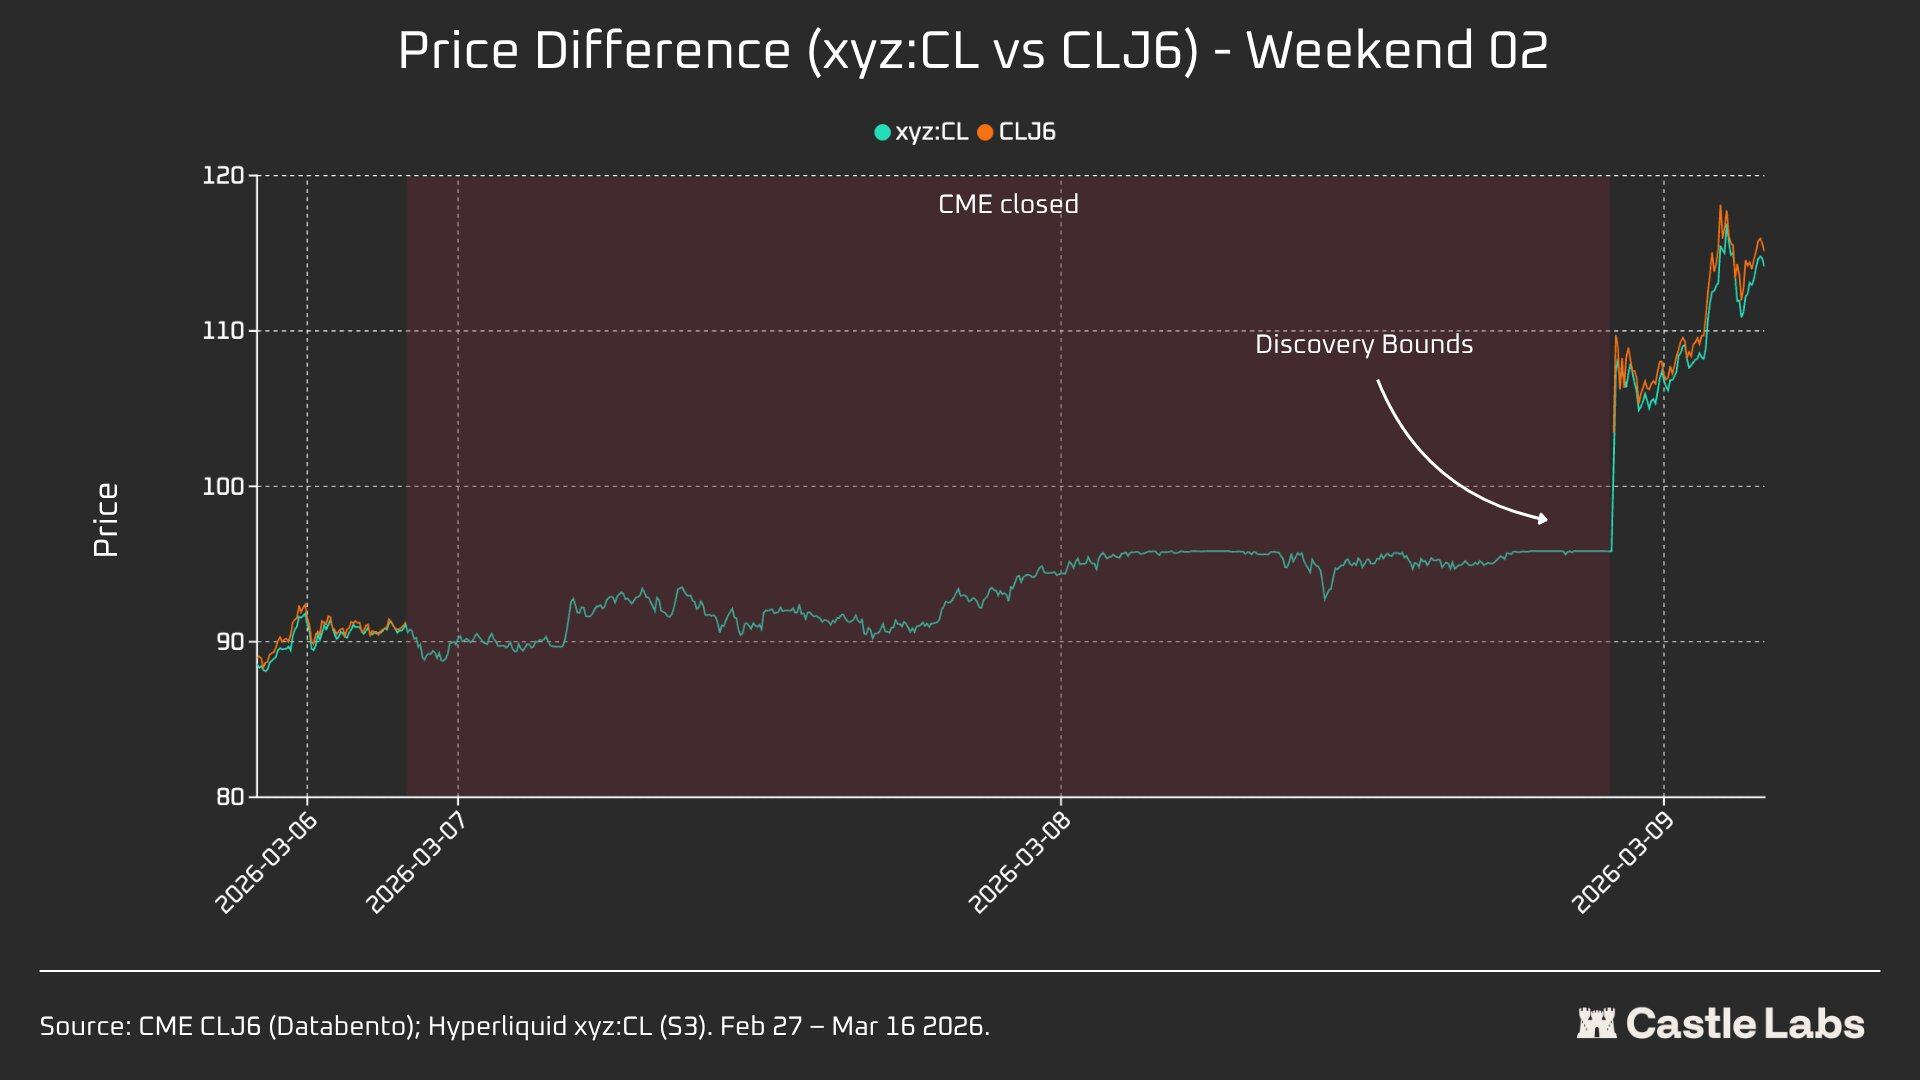
W2: March 7–8, 2026
The second weekend was the real test, as xyz:CL touched the range boundary price at the market close. CLJ6 opened at $98 (up 737 basis points from the $91.27 closing price), while xyz:CL peaked at approximately $95.83, capturing only 68% of the gain.
During the second weekend, xyz:CL better captured the market movement and was closer to the CME opening price than the previous weekend.
W3: March 14–15, 2026
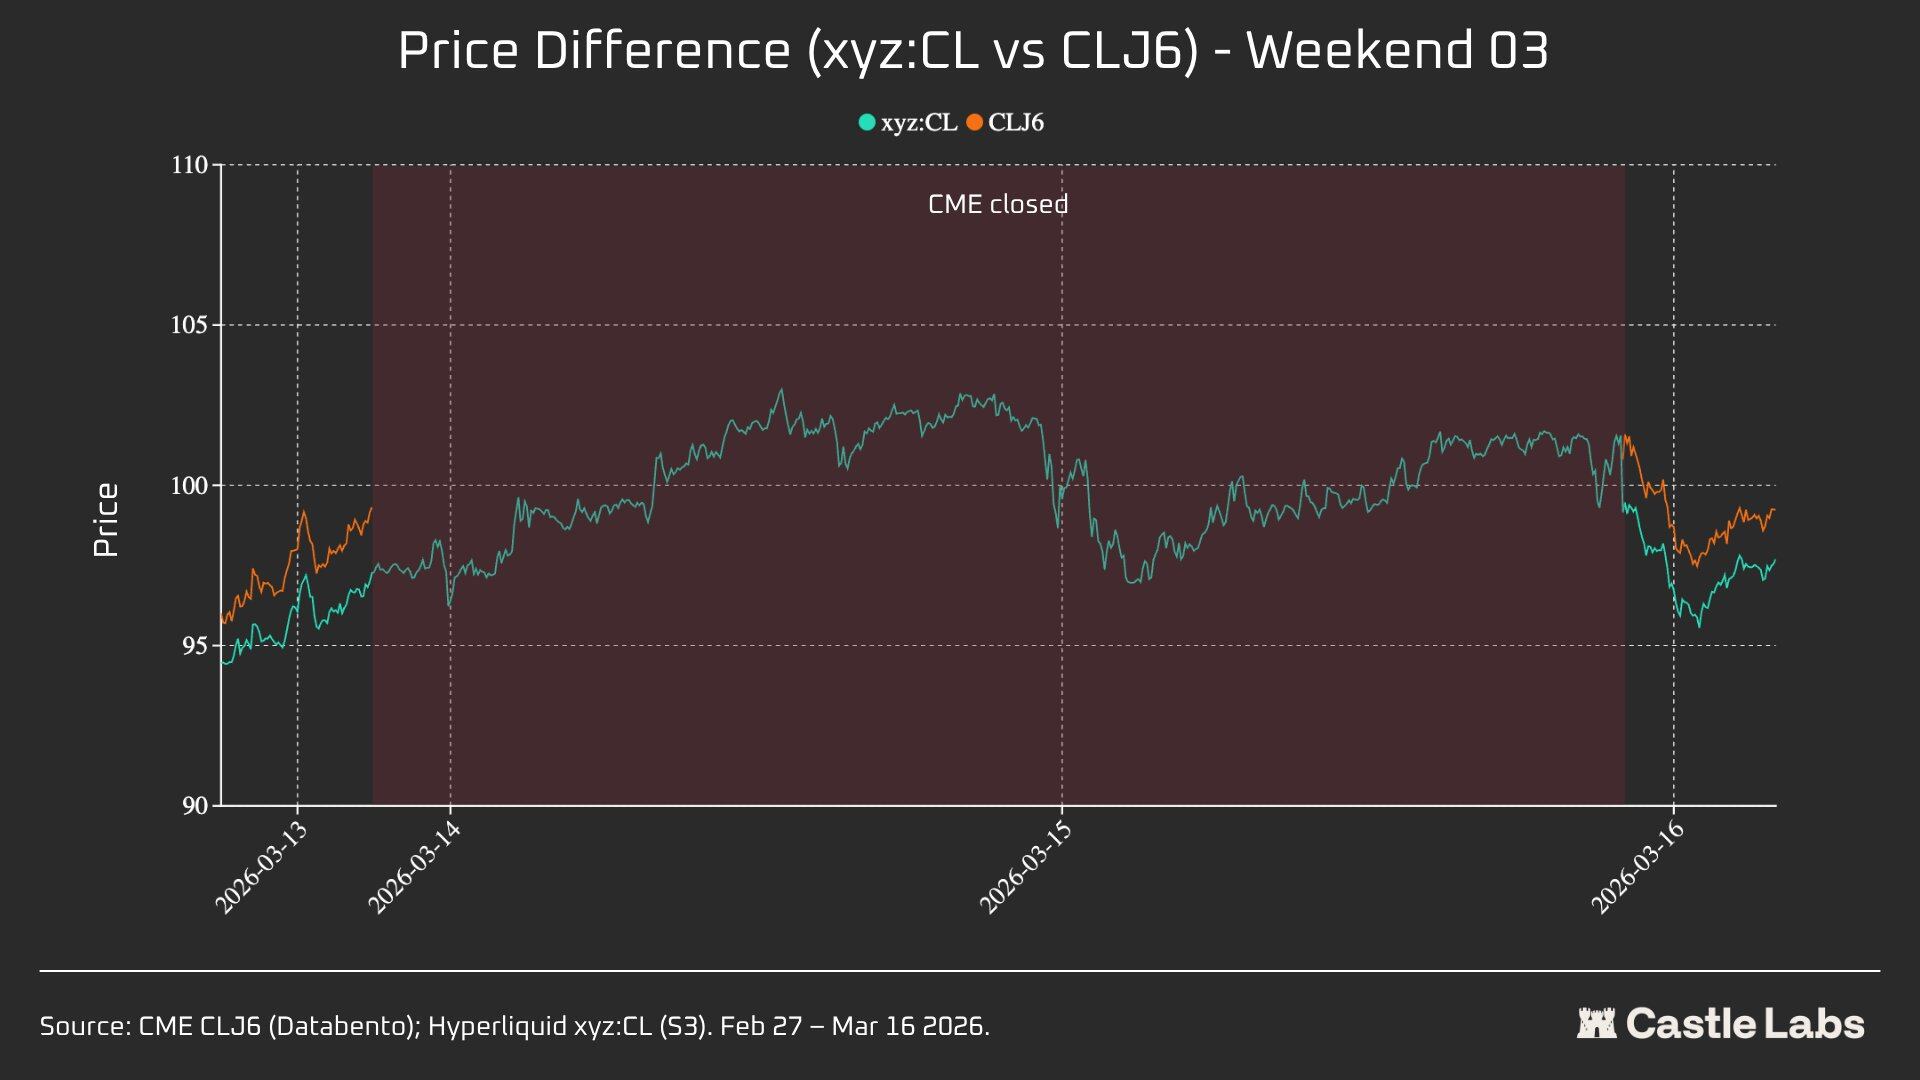
Data from the third weekend indicates that, in a calmer market environment, Hyperliquid can more reliably predict the final opening direction of CME.
This weekend, the convergence between xyz:CL and CLJ6 reached its peak: a 226-basis-point increase over the CME closing price, slightly above the 62-basis-point rise from Monday’s opening price. CLJ6 closed Friday at $99.31, opening at $100.93 (up 163 basis points), while xyz:CL opened at $101.56.
Overall, these three snapshots show a structural shift in the xyz:CL market on the Hyperliquid platform, transitioning from an emerging market constrained by DB price discovery (Weekend 1 and Weekend 2) to one with increasingly free price discovery, accompanied by overshooting and pullbacks (Weekend 3).
Analyzing price deviation errors during different time periods before the CME open on weekends (3 hours, 1 hour, 0 hours), W3 data proved most reliable, as the xyz:CL market was affected by DB during the first two weekends. In W3, the errors for xyz:CL were approximately +70 and -139 basis points at 3 hours and 1 hour before the CME open, indicating superior price discovery compared to previous weekends analyzed.
Other indicators
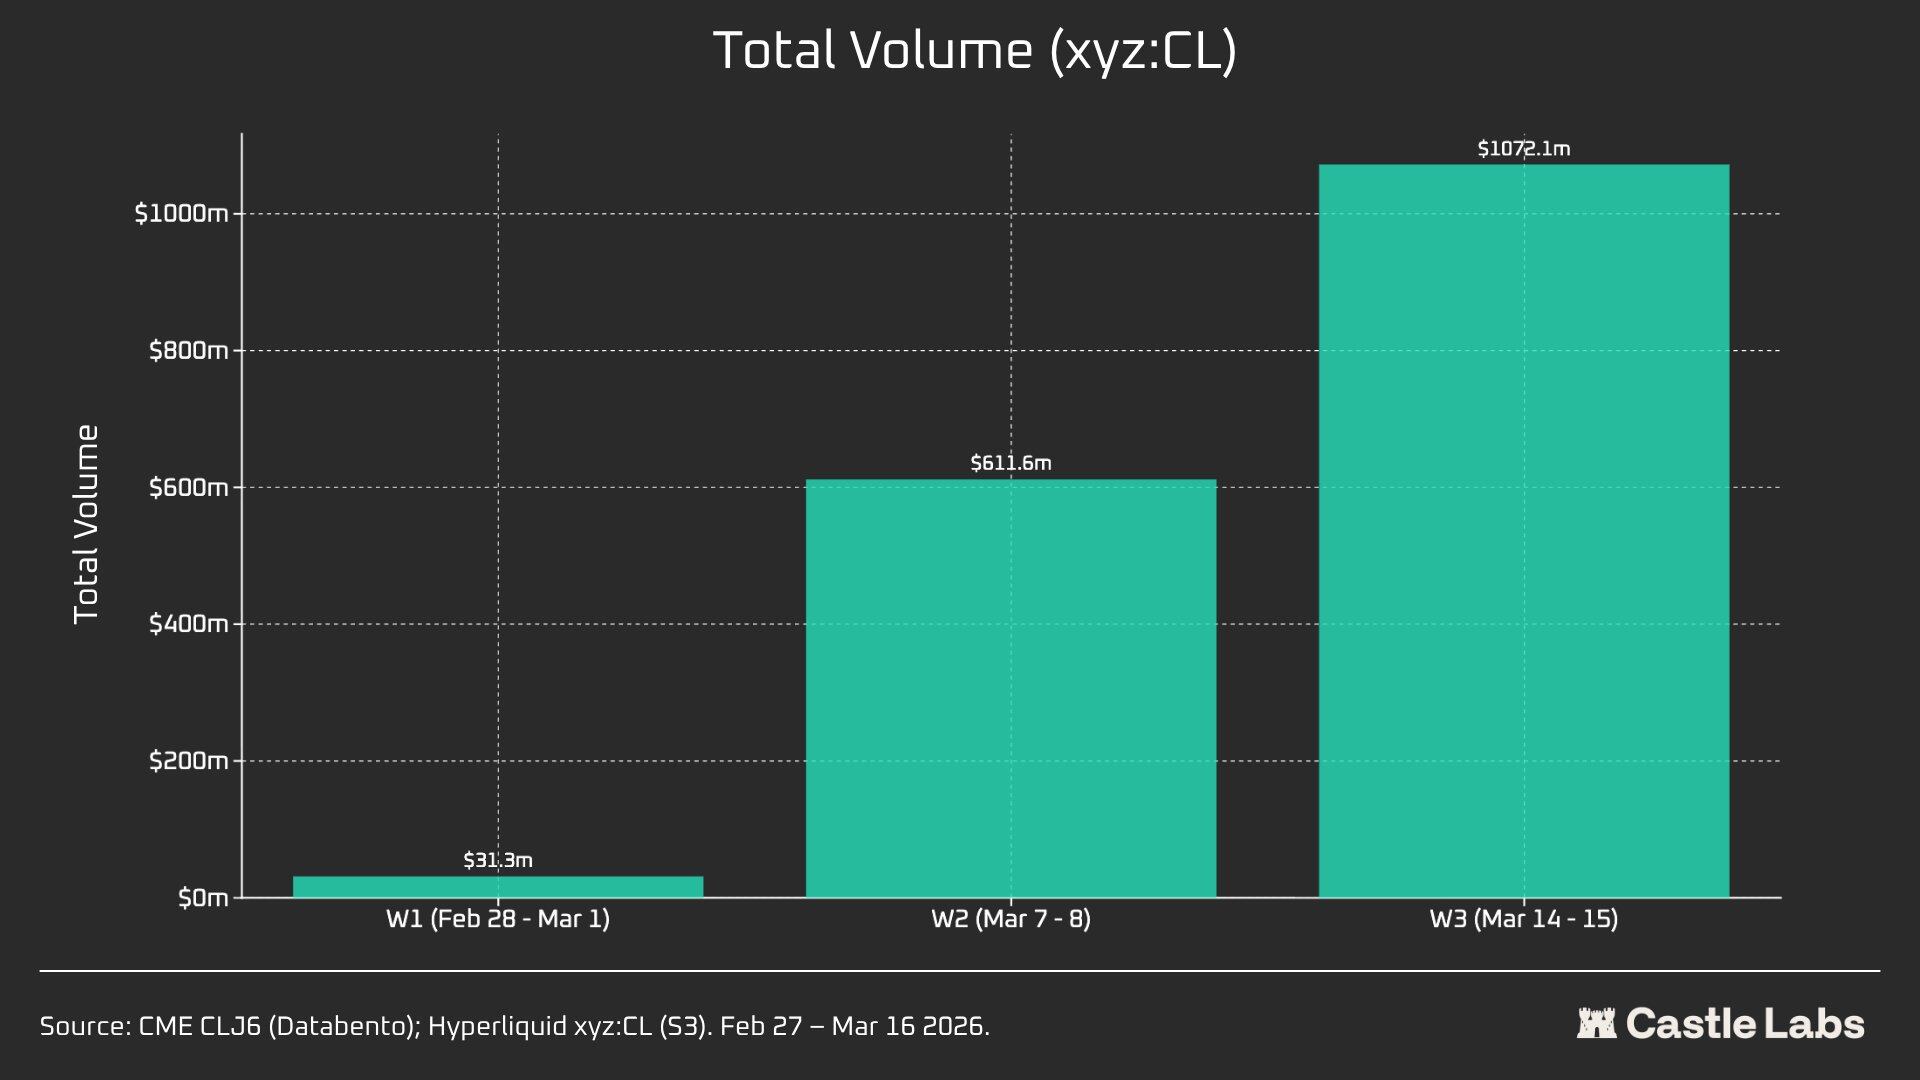
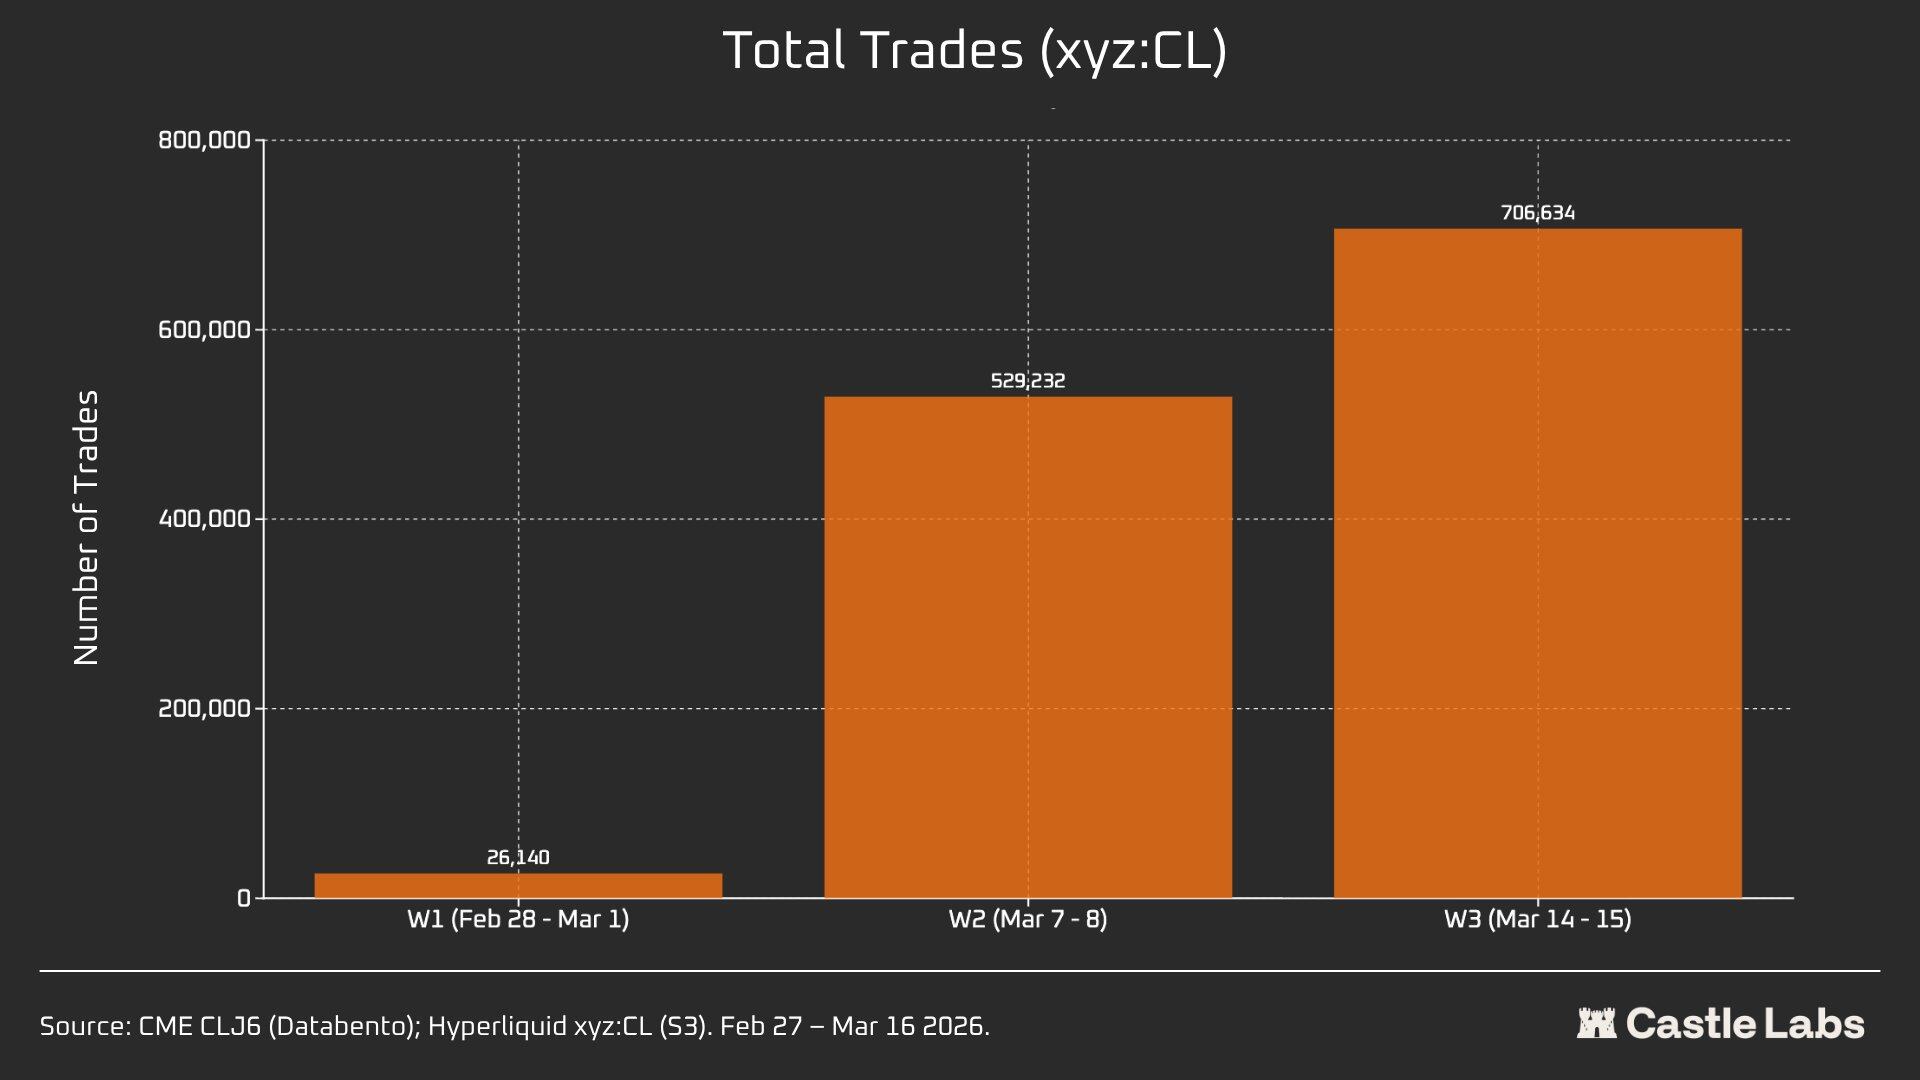
We also provide additional metrics for the weekend summary analysis, including trading volume, total number of trades, and average trade size. These metrics vary across weekends and have shown consistent growth over several consecutive weekends.
The total trading volume of the xyz:CL market grew from $31 million to over $1 billion within three weeks, reflecting an increase in the number of users and the market's eventual maturity.
Additionally, the total number of transactions increased from 26,000 in the first weekend to over 700,000 in the third weekend.
Notably, the average trade size over the weekend increased from the median we previously mentioned to $534. The same growth trend was observed across all three weekends, which may indicate increased institutional capital flowing into the market.
The average trade size during the first weekend was $1,199, growing to over $1,500 by the third weekend.
This may indicate that the user base on weekends differs, with fewer retail users and more traders seeking exposure to crude oil before Monday, making weekend trading more aligned with hedging demand than speculation.