


Original Title: "Understanding Premium Rate: Let You Be 24 Hours Ahead of ETF Data"
Original Author: San, Deep Tide TechFlow
Since the approval of BTC and ETH spot ETFs, daily ETF inflows and outflows have become a key metric for many traders when placing orders.
The logic is simple: net inflow indicates institutional buying and bullish sentiment; net outflow indicates institutional selling and bearish sentiment.
But the problem is that the ETF data we see every day is from the previous day.
By the time the data is released, the price often has already reflected it.
So, is there any way to know in advance whether today's ETF is experiencing a net inflow or a net outflow?
Yes, the answer is ETF premium rate.
It's not difficult to verify this pattern; looking back at January 2026, which is about to pass, provides the best example.
As of January 28, there have been 18 trading days for U.S. stocks.
According to the statistics, the premium index on Coinbase remained in positive territory for only two days, while the remaining 16 days were all in a negative premium state below water level.
The corresponding ETF fund flow data shows that there was a net outflow on 11 of these 16 days.
In particular, from January 16 to 23, the negative discount rate continuously dropped below -0.15%. Correspondingly, the ETF market experienced a net outflow of over $1.3 billion in a single week, and the price of BTC fell from a high of around $97,000 to approximately $88,000.
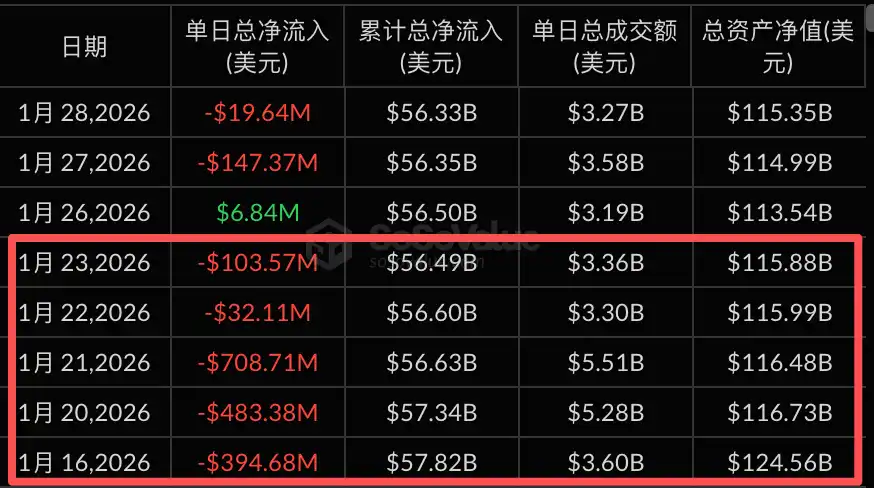
Data source: sosovalue
Let's take a longer-term perspective.
From July 1, 2025, to January 28, 2026, there are a total of 146 trading days.
·Negative premium rate for 48 days, corresponding to a net outflow of 39 days, accuracy rate 81%.
·The positive premium rate has lasted for 98 days., corresponding to a net inflow of 82 days, accuracy rate 84%.
This is the value of the premium rate, allowing you to see earlier than more people where the capital is flowing.
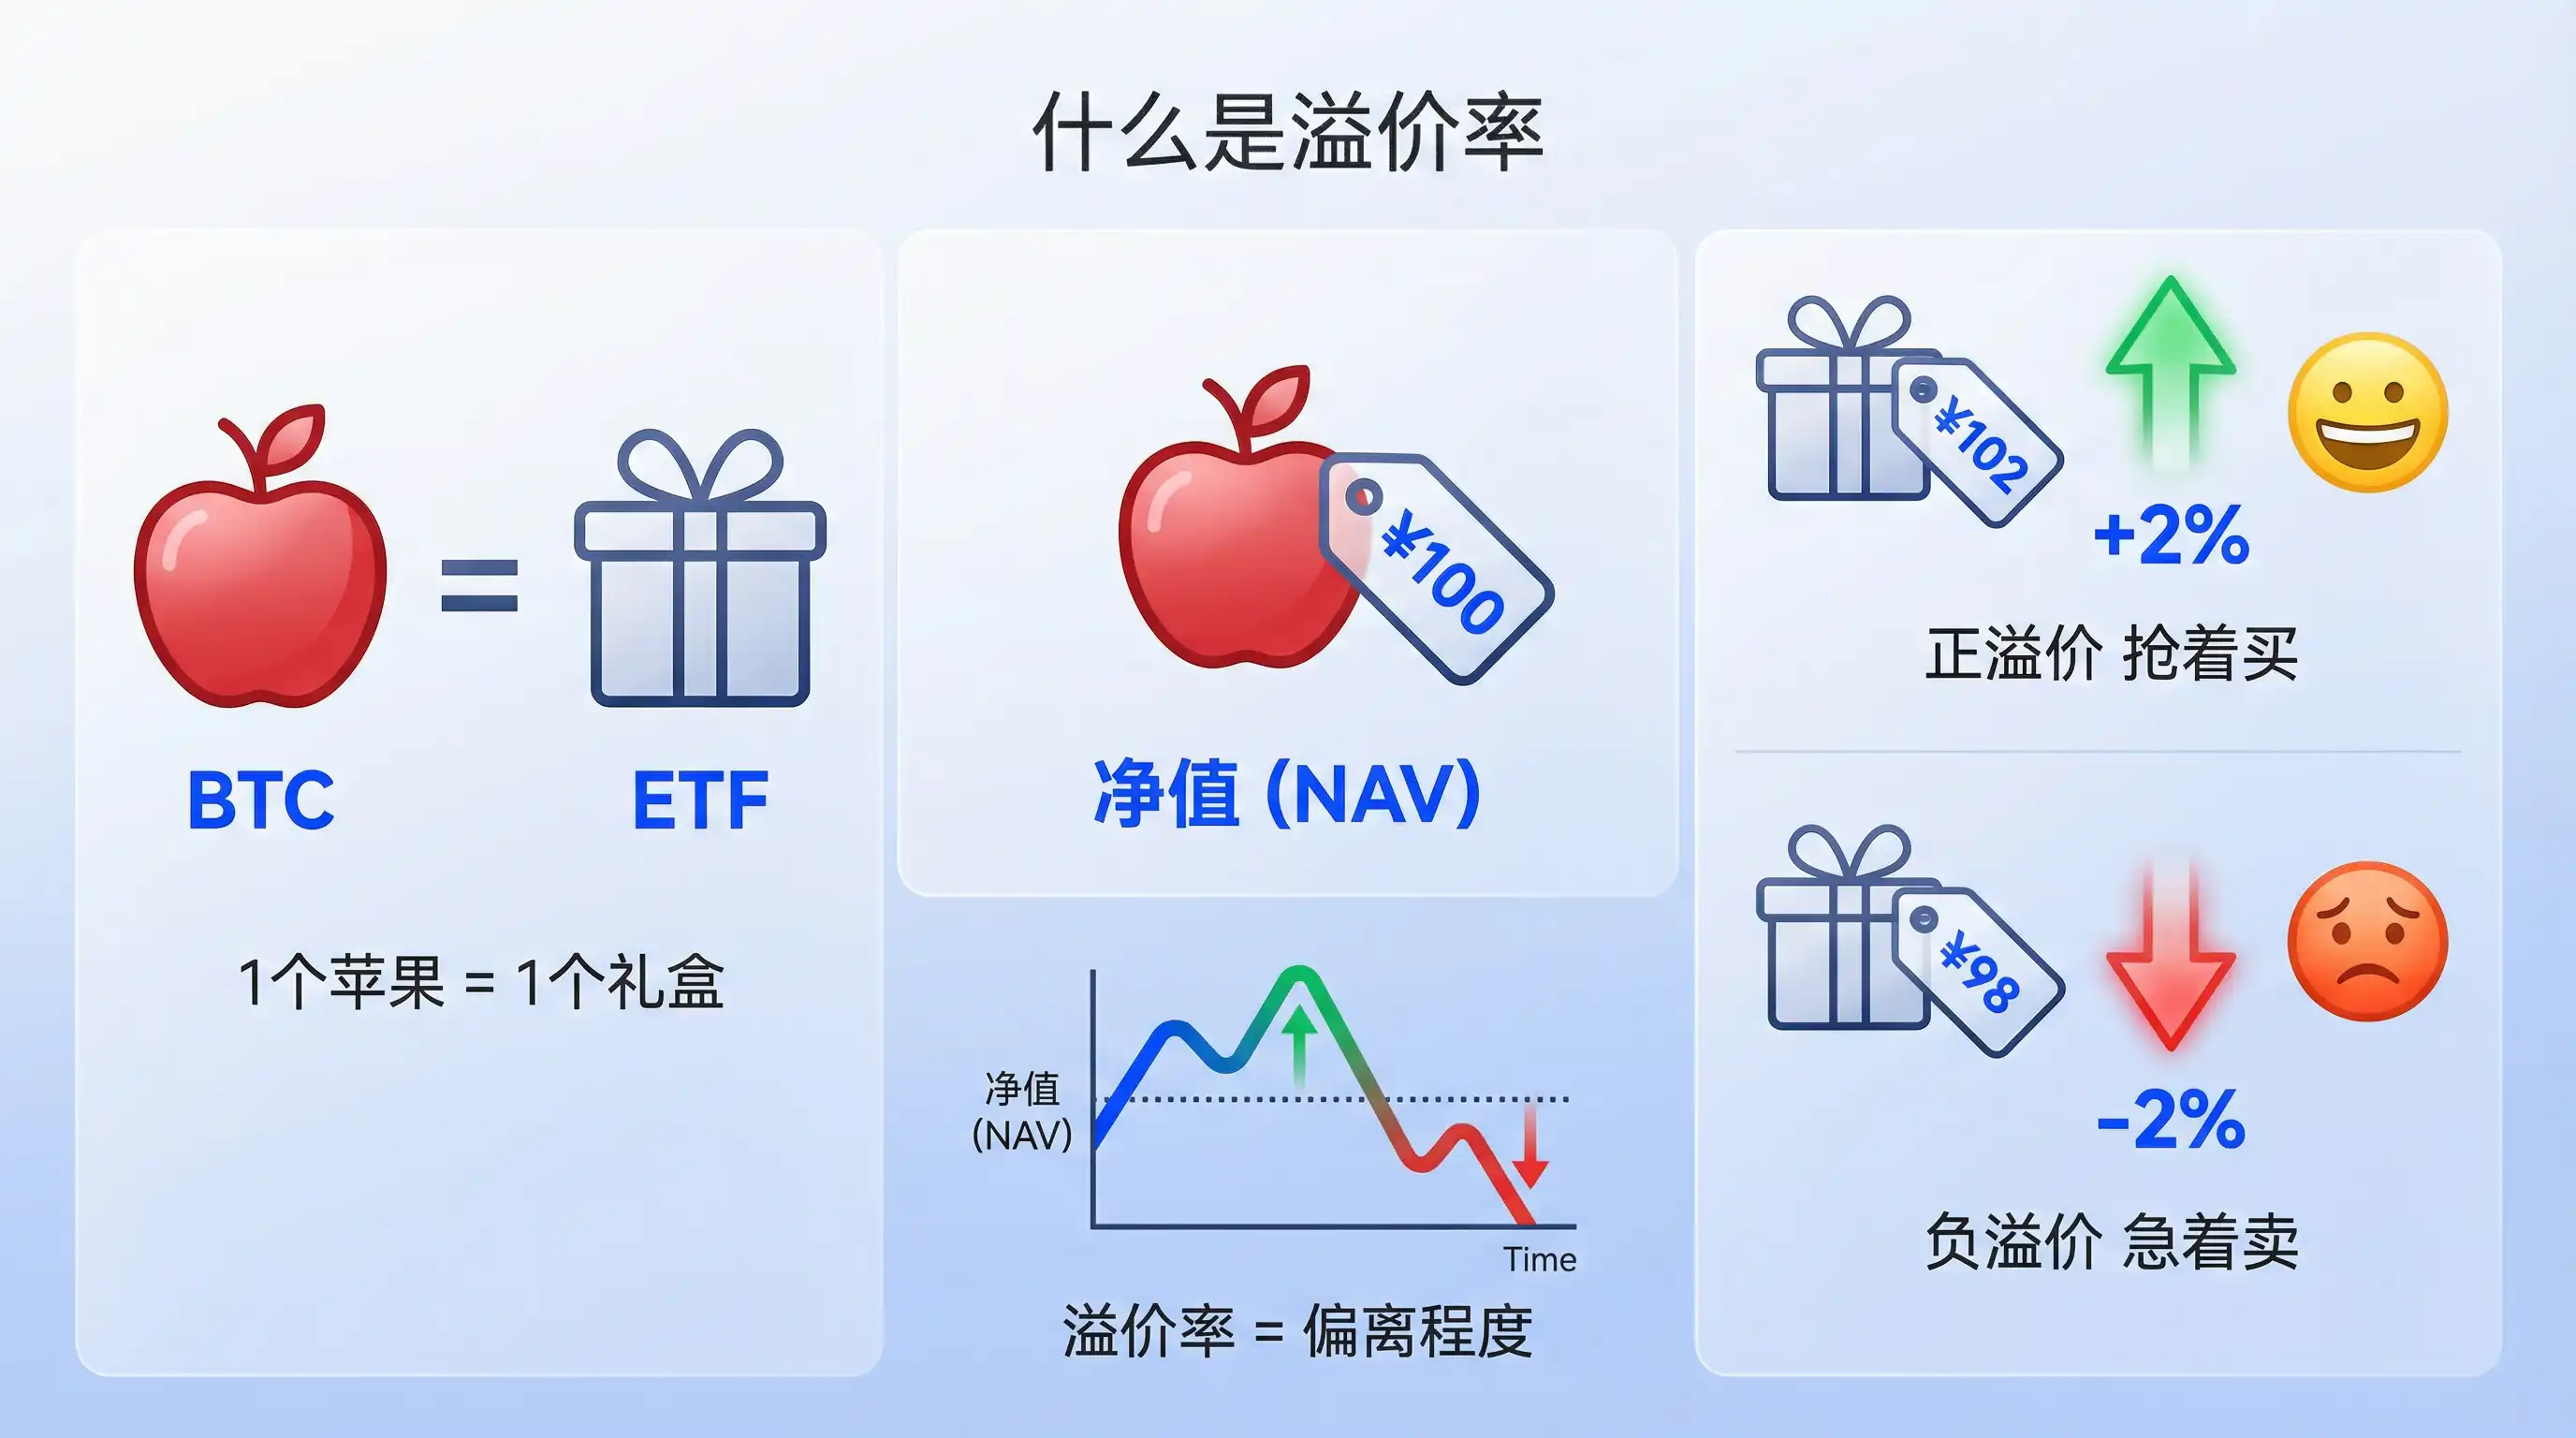
What is the premium rate?
We have been talking about the premium rate for so long, but what exactly is a premium rate?
For example.
BTC is like loose apples in a farmers' market, while BTC spot ETFs are like pre-packed apple gift boxes in a supermarket, with each gift box containing one apple.
An apple is sold for 100 yuan at the food market. This is the net asset value (NAV).
The price of an apple gift box in a supermarket depends on supply and demand.
More people are buying it, and the gift box has been resold for 102 yuan. This is a positive premium rate, with a premium rate of +2%.
There are many sellers, and the gift box price has dropped to 98 yuan, which is a negative premium rate, with a premium rate of -2%.
The premium rate reflects the extent to which the ETF's market price deviates from the true price of BTC.
A positive premium indicates optimistic market sentiment, with everyone rushing to buy.
A negative premium indicates a pessimistic market sentiment, with everyone eager to sell.
The relationship between the premium/discount rate and ETF inflows/outflows
The premium rate is not merely an indicator of market sentiment; it can also become a key factor driving the flow of capital.
The key role in this process is the AP, or Authorized Participant, whom you can think of as a privileged transporter.
The core logic of arbitrageurs (APs) is risk-free arbitrage: they can subscribe to and redeem ETF shares in the primary market, as well as buy and sell them in the secondary market.
As long as there is a price difference, they will arbitrage by moving bricks.
When a positive premium rate occurs, the gift box is more expensive than the apple. APs (Authorized Participants) will buy BTC in the primary market, package it into ETF shares, and then sell them in the secondary market to profit from the price difference. In this process, BTC is bought, resulting in a net inflow of funds.
Conversely, when a negative premium rate occurs, the gift box (ETF) becomes cheaper than the underlying asset (e.g., apples, or in this case, Bitcoin). APs (Authorized Participants) will buy the ETF in the secondary market, redeem it for BTC, and then sell the BTC to profit from the price difference. In this process, BTC is sold, resulting in a net outflow of capital.
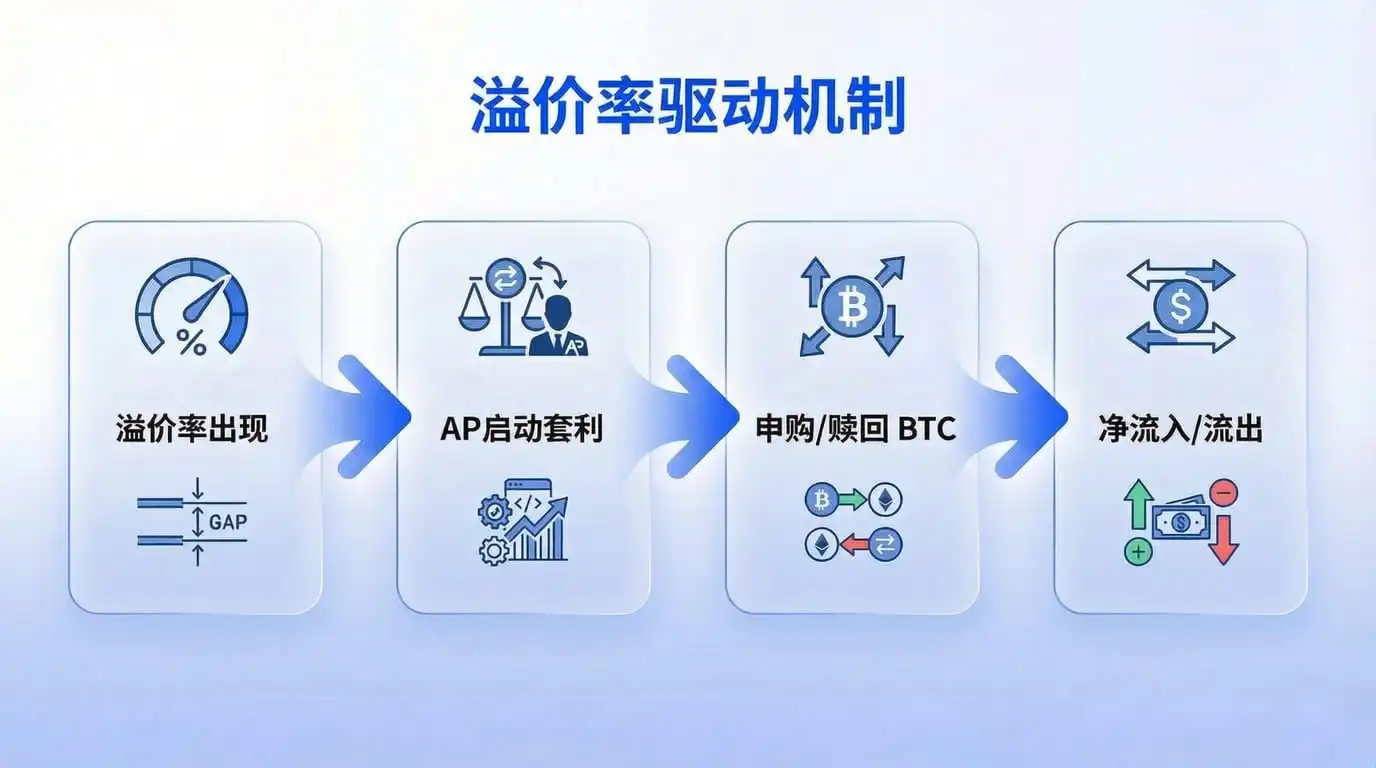
So the logical chain is as follows:
Premium rate appears → AP initiates arbitrage → subscription or redemption occurs → resulting in net inflow or net outflow.
The ETF fund data we see every day is published the day after settlement.
The premium rate is real-time, while the capital data is delayed.
This is why the premium rate allows you to stay one step ahead of the market.
How to apply the premium rate
Now that we understand the relationship between the premium rate and the net inflow or outflow of ETFs, how should we apply this knowledge to each of our individual trading plans?
First of all, the premium rate is not an indicator used in isolation.
It can tell us the direction of the funds but not the magnitude or duration.
Here, I suggest looking at the following dimensions together.
1. The persistence of the premium rate is more important than the daily value.
A negative premium rate on a single day may only be a short-term fluctuation.
However, if a negative premium rate persists for consecutive days, it is likely to correspond to continuous net outflows, which should be a cause for concern.
Looking back at the five consecutive trading days from January 16 to 23 of this year, which saw continuous negative discount rates, corresponding to five days of net outflows, Bitcoin (BTC) dropped nearly 10%.
2. Pay attention to extreme values in the premium rate.
In general, a premium rate fluctuating within ±0.5% is normal.
Once it breaks through ±1%, it indicates a significant deviation in market sentiment, strengthening the arbitrage momentum of AP (Ask-Bid Price), and accelerating capital flow.
3. Combine with price position judgment
A sustained negative premium rate at the upper end may be an early signal of capital outflows.
A sustained positive premium rate at the lower end may indicate the sign of bottom-fishing funds entering the market.
The premium rate itself does not constitute a basis for buying or selling, but it can help you verify current trends or detect turning points in trends in advance.
Final Words
Finally, there are a few points that need to be noted.
No single indicator is a holy grail; the effectiveness of the premium rate is based on the assumption that the AP arbitrage mechanism is functioning properly.
In extreme market conditions, such as the sharp decline on October 11th, market liquidity may dry up, causing arbitrage mechanisms to potentially fail. As a result, the correlation between premium rates and capital flows may decrease.
In addition, the premium rate is just one of the windows to observe the capital flow of ETFs.
For seasoned investors, the premium rate is just one piece of the puzzle.
It is recommended to combine the following indicators for multi-dimensional cross-validation:
1. Changes in ETF HoldingsAn increasing open interest indicates that institutions are accumulating positions, while a decrease suggests they are reducing their positions. It is more direct than the premium rate, but the data updates with a delay.
2. Futures Basis and Funding RateA positive basis combined with a continuously rising funding rate indicates overheated long sentiment and a potentially overly optimistic market. Conversely, a negative basis and a declining funding rate suggest that short positions are dominant.
3. The Put/Call Ratio in the Options MarketPut is a put option, and Call is a call option. An increase in the ratio indicates heightened risk-aversion in the market, while a decrease suggests optimism is prevailing.
4. Large on-chain transfers and net inflows to the trading platformLarge BTC deposits into an exchange usually indicate upcoming selling pressure. Large withdrawals from an exchange suggest that someone is stockpiling coins.
For example:
When you observe: the premium rate has been continuously negative, the ETF holdings have decreased, while the net inflow on the trading platform has increased.
Three signals point in the same direction: capital is withdrawing, and selling pressure is accumulating.
At this point, you should at least be more vigilant, control your position size, rather than trying to buy at the bottom.
A single indicator cannot reveal the full picture. Cross-validation from multiple dimensions is needed to improve the accuracy of judgment.
In this market, the more dimensions you observe, the smaller the information gap becomes, but the time gap will always exist.
Whoever spots the direction of the capital first gains an extra advantage.
Click to learn about BlockBeats' job openings.
Welcome to join the official Lulin BlockBeats community:
Telegram Subscription Group:https://t.me/theblockbeats
Telegram discussion group:https://t.me/BlockBeats_App
Official Twitter account:https://twitter.com/BlockBeatsAsia