


Original author: David Lopez Mateos
DeepChain TechFlow
Overview: Media outlets often use a single number to summarize fluctuations in GPU computing power prices, but the reality is that four index providers on Bloomberg terminals are quoting prices that differ by more than $2, with varying directions and timings. This article, written by David Lopez Mateos, founder of the GPU computing power trading platform Compute Desk, uses firsthand trading data to break down the true pricing structures of the H100 and B200, revealing an immature market without a consensus benchmark, standardized contracts, or forward curves—computing power is being hoarded and sublet like short-term rentals.
Media headlines make it seem like GPU computing power prices are surging. This narrative is comforting, perfectly fitting into the macro framework of "supply constraints + insatiable AI demand," and suggesting something reassuring: we have a well-functioning market with clear, readable price signals.
But we don’t. This narrative is almost entirely built on a single index, implying something that shouldn’t be implied: that the GPU rental market is already so efficient that a single number can represent its overall state.
The shortage is real, but the extent of it varies drastically depending on who you are, where you are, what contract you’re trading, and which compute assets you’re targeting. In the face of this opacity, the market’s natural response isn’t orderly price discovery—it’s hoarding: locking in GPU hours you may not even need yet, because you’re unsure if they’ll be available at any price next month. Where hoarding occurs without a transparent benchmark, fragmented secondary markets emerge. At Compute Desk, we’ve already enabled tenants to sublease their clusters just as people sublet apartments during major events. This isn’t hypothetical—it’s happening now.
The index is not converging
In mature commodity markets, indices built on different methodologies tend to converge. Brent crude and WTI may exhibit a few-dollar price differential due to geographic location and crude quality, but they move in tandem (Figure 1). This convergence is a hallmark of an efficient market.
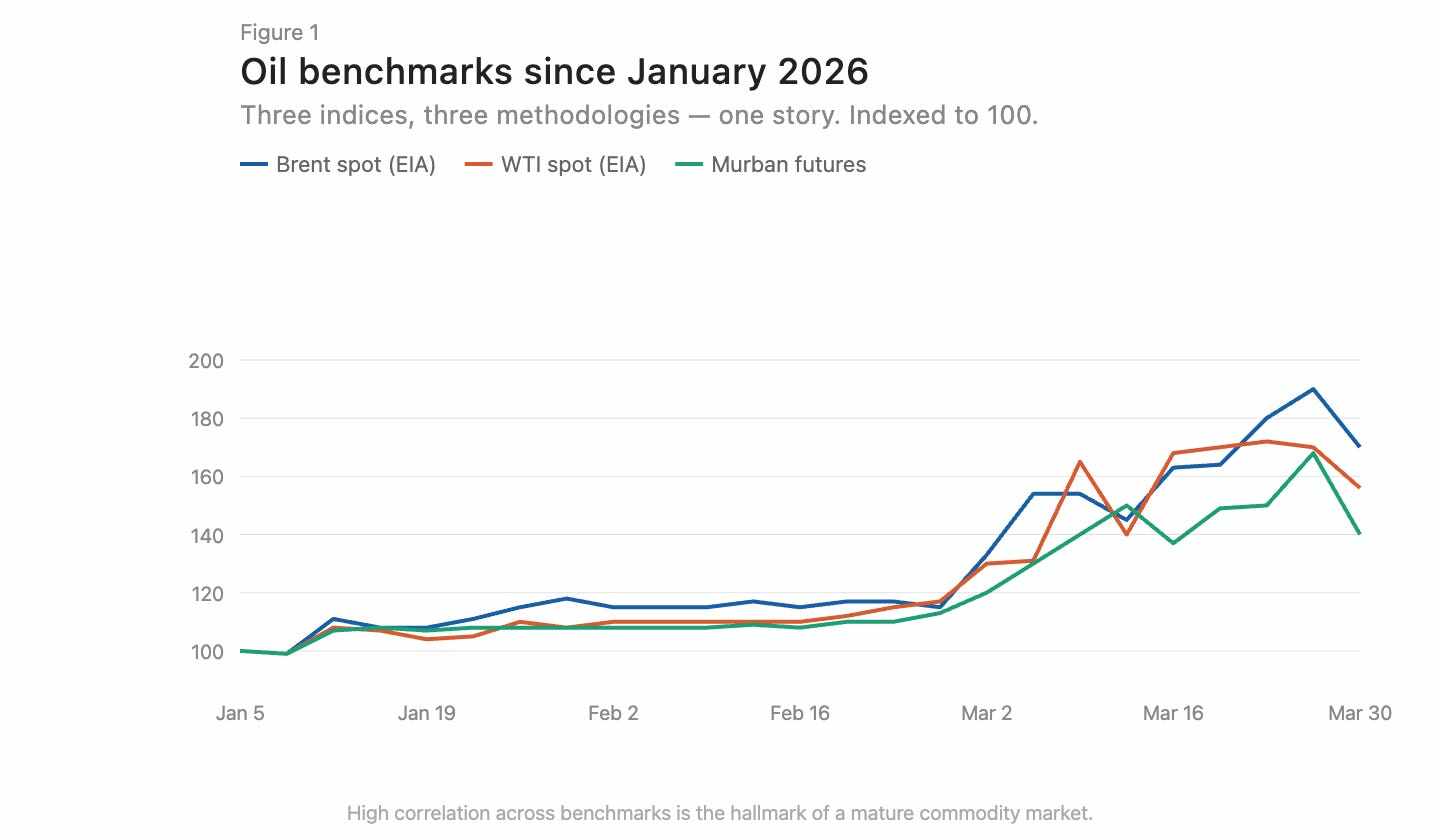
Caption: Comparison of Brent and WTI crude oil price trends, showing highly aligned directions.
There are currently three GPU pricing index providers on the Bloomberg Terminal: Silicon Data, Ornn AI, and Compute Desk. SemiAnalysis has just publicly launched a fourth—a monthly H100 one-year contract price index built from survey data of over 100 market participants. Silicon Data and Ornn publish daily H100 lease indices, while Compute Desk aggregates data at the Hopper architecture level. SemiAnalysis captures negotiated contract prices rather than list prices or web-scraped prices. Each employs a different methodology, frequency, and perspective on the same market. When viewed together, the discrepancies are immediately apparent (Figure 2).
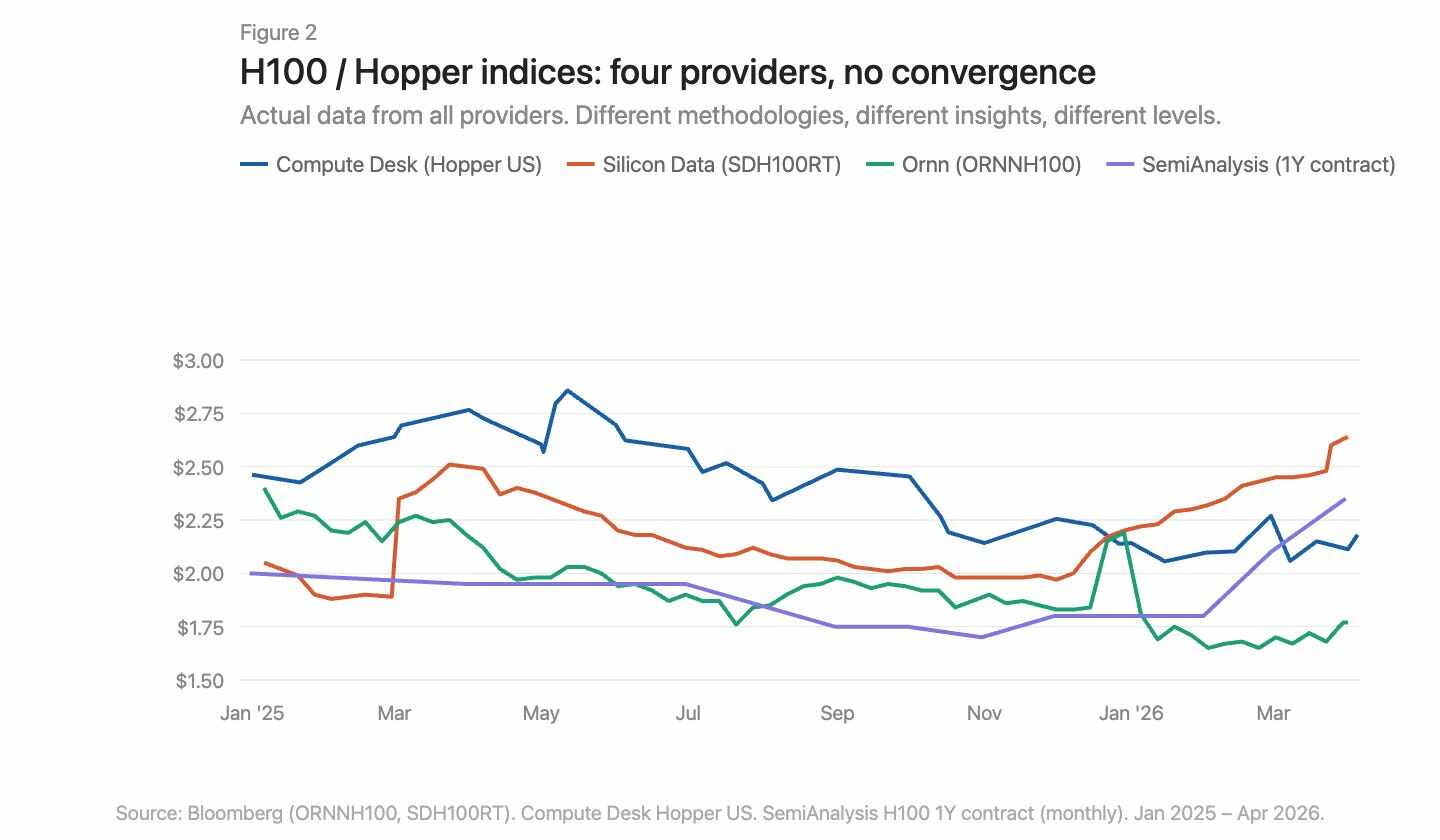
Caption: Overlay comparison of four GPU indices, showing clear divergence in price levels and trends.
Where exactly did the price increase occur?
Using Compute Desk data, we can break down H100 price movements by supplier type and contract structure, overlaid with Silicon Data’s SDH100RT index (Figure 3). All metrics show price increases, but the starting points and magnitudes vary significantly across indices and contract types.
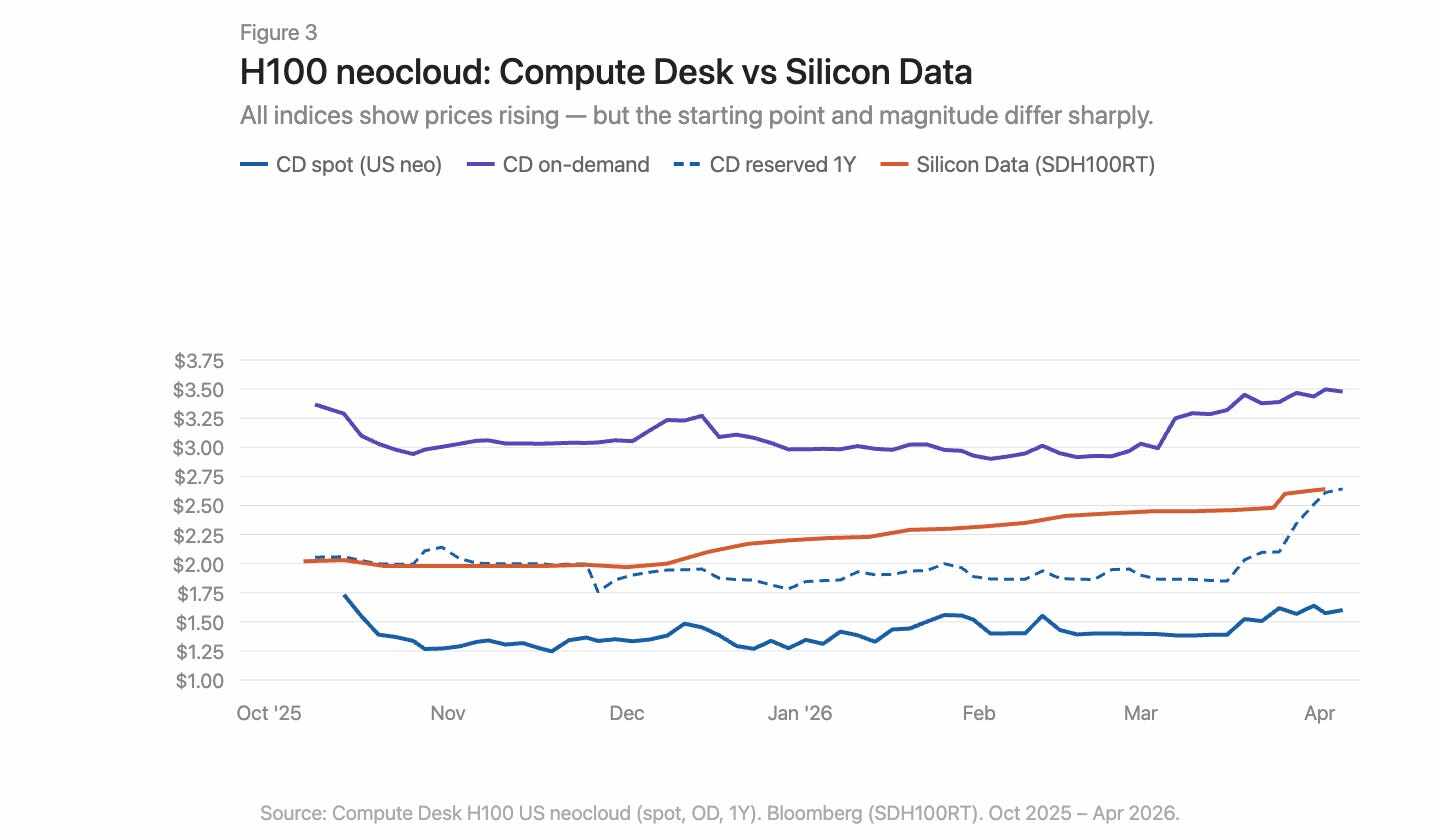
Caption: Price movement of H100 broken down by contract type, overlaid with the SDH100RT index
Compute Desk's H100 NeoCloud data tells a more specific story than the aggregated index. On-demand pricing remained relatively stable throughout the winter at around $3.00/hour, then sharply spiked to $3.50 in March. Spot pricing was noisier and lower, showing only a modest upward trend by March. In contrast, Silicon Data's SDH100RT showed a smoother, steady increase, rising from $2.00 to $2.64 over the same period. The two indices consistently remained at different levels and described different timing patterns: Compute Desk indicates a sharp jump in March, while Silicon Data shows a gradual climb.
The one-year forward pricing remained largely flat until February, then surged abruptly from $1.90 to $2.64 by end-March—not as a gradual catch-up, but as a sudden repricing. This resembles suppliers collectively adjusting contract rates following tighter demand in the on-demand market, rather than being driven by sustained structural demand.
The March story for the B200 was even more intense (Figure 4). The on-demand index from Compute Desk surged from $5.70 to over $8.00 within weeks. Silicon Data’s SDB200RT jumped from $4.40 to $6.11 before pulling back to $5.47. Both indices captured this rally, but they started more than $2 apart and exhibited different patterns of rise and decline. With less than five months of data, fewer suppliers, and wider spreads, the two indices were observing the same event through very different lenses.
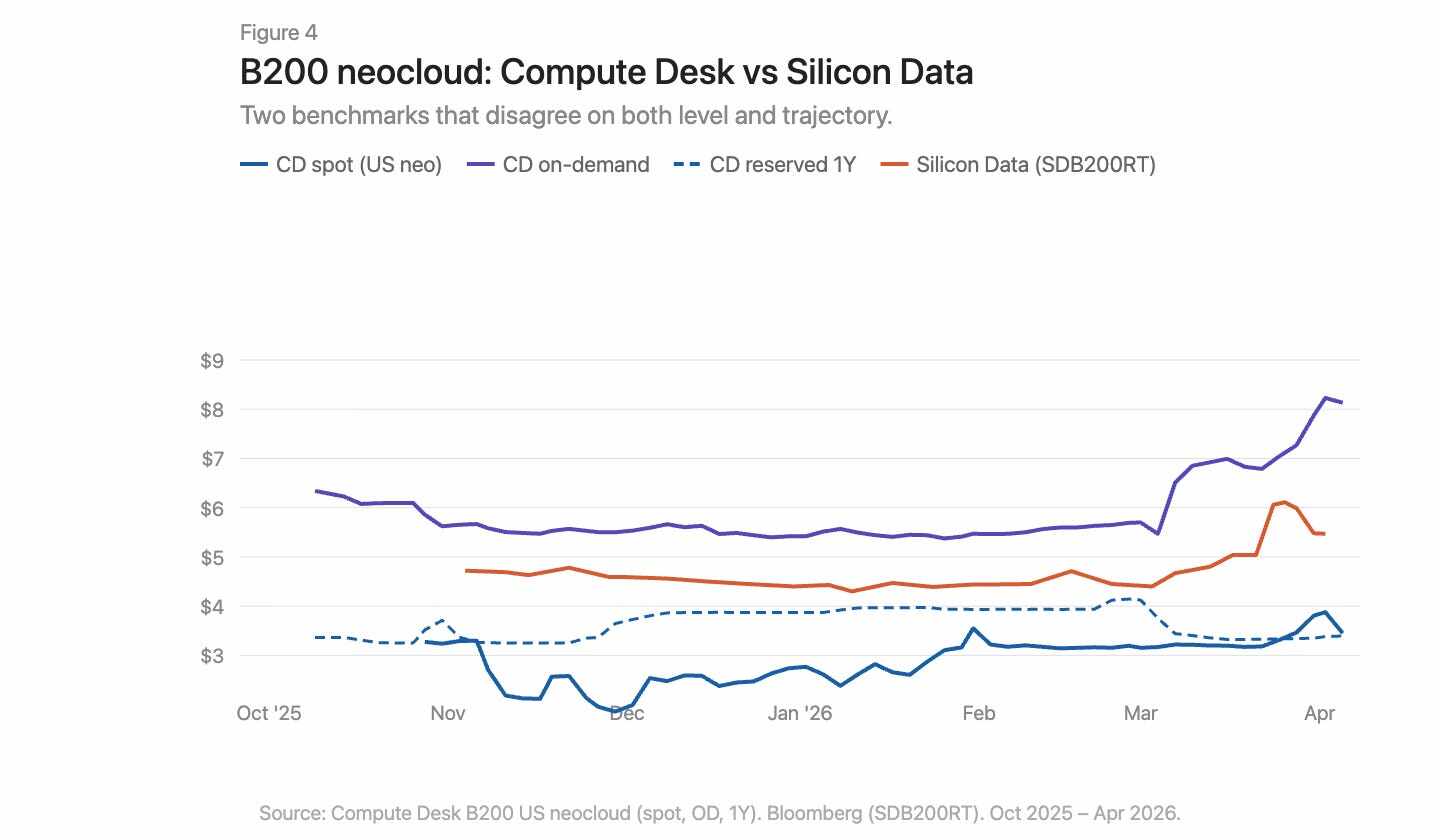
Caption: B200 on-demand and reserved price trends, with data overlaid from Compute Desk and Silicon Data
Infrastructure issues, not just regional differences
Commodity markets have basis differentials. Appalachian natural gas is a textbook example: vast reserves sit atop structurally constrained pipeline capacity, with utilization in the Pennsylvania-Ohio corridor frequently exceeding 100%, and new projects like the Borealis Pipeline not expected to come online until the late 2020s.
The GPU market faces a similar situation: an H100 in Virginia and an H100 in Frankfurt are not the same economic good. But geographic differences alone cannot explain why index discrepancies within the same market are so large. The misalignment in the GPU market runs deeper than Appalachian natural gas. The problem with natural gas is a single missing link: pipeline capacity connecting supply and demand. In the compute market, infrastructure gaps exist on both the supply and demand sides. Physical infrastructure—consistent networks, predictable configurations, and reliable availability needed to distribute compute effectively—is immature and sometimes nonfunctional. Financial infrastructure—standardized contracts, transparent benchmarks, and arbitrage mechanisms that could compress price differentials despite physical disparities—also does not yet exist.
Data tells a story. The real experience of trying to procure computing power in early 2026 tells an even more painful one. On-demand capacity for all GPU types was effectively sold out. Finding 64 H100s was difficult: Compute Desk showed that 90% of suppliers had zero available on-demand cluster capacity, and the reserved market wasn’t much better. In a well-functioning market, this level of scarcity would have pushed prices to a new equilibrium. But it didn’t. This indicates that suppliers themselves lacked real-time pricing intelligence to adjust accordingly. Prices were rising, but too slowly to clear the market. The gap between listed prices and actual willingness to pay is being filled by hoarding, subleasing, and informal secondary market transactions.
What needs to be changed?
There are seven core issues in the current GPU computing power market:
There is no consensus benchmark. Multiple indices coexist, each with different methodologies and conflicting results.
The aggregated narrative obscures the structure. A single "H100 price" masks significant differences across supplier types and contract durations.
Lack of trade-level data. In the bilateral market, there is a significant discrepancy between the quoted price and the actual transaction price.
There is no contract standardization. Most GPU rentals involve bilateral negotiations with varying terms. Shorter, more standardized contract durations would improve liquidity and price discovery.
The quality of delivery is not guaranteed. Interconnection topologies, CPU pairings, network stacks, and runtime characteristics vary significantly. Buyers need to know the quality of the computing power they are purchasing before making a commitment.
The contract lacks liquidity. If demand changes during the reservation period, options are limited: either absorb the cost or informally sublease. The market needs infrastructure that allows the transfer or resale of committed computing power, enabling capacity to flow to those who need it most.
There is no forward curve. Without the ability to price forwards, hedging is impossible. This is why lenders apply a 40%-50% discount to GPU collateral, keeping financing costs high.
Building a properly functioning market for the most important commodity of this century cannot be achieved by advancing just one aspect. Measurement, standardization, contract structure, delivery quality, liquidity—these must all progress in tandem; until then, no one can truly say what a GPU hour is worth.