


In January, gold reached a historic high of $5,589. Within less than two months, the price dropped to approximately $4,100, experiencing a peak-to-trough decline of 26.6%, marking the worst monthly drop in 43 years.
The direct transmission chain of this sell-off is not complicated. As the U.S.-Iran conflict enters its third week, the Strait of Hormuz has been disrupted, causing oil prices to rise more than 40% since the conflict began. According to data from the U.S. Bureau of Labor Statistics, February’s CPI reached its highest level since last year, and when combined with the delayed effects of high tariffs, market concerns about inflation have surged sharply. In its latest Summary of Economic Projections (SEP), the Federal Reserve narrowed its interest rate cut expectations for 2026 to just one cut, effectively signaling the end of the recent easing cycle. The U.S. Dollar Index has broken above the 100 level, exerting broad downward pressure on precious and non-ferrous metal prices.
But the macro narrative is only half the story. According to Finance Magnates, a technical break below the 50-day moving average (around $4,978) triggered a cascade of liquidations among heavily concentrated long positions, with stop-loss and margin calls activating in sequence. Gold had surged from $2,600 to over $5,000 within 12 months, accumulating substantial leveraged long exposure. When escalating conflict pushed oil prices higher instead of gold prices, these crowded positions became the first to be sold off.
A price decline in itself is not the story. The story is: this script—“geopolitical shocks driving inflation, followed by concentrated deleveraging”—has played out at least three times in the past 46 years.
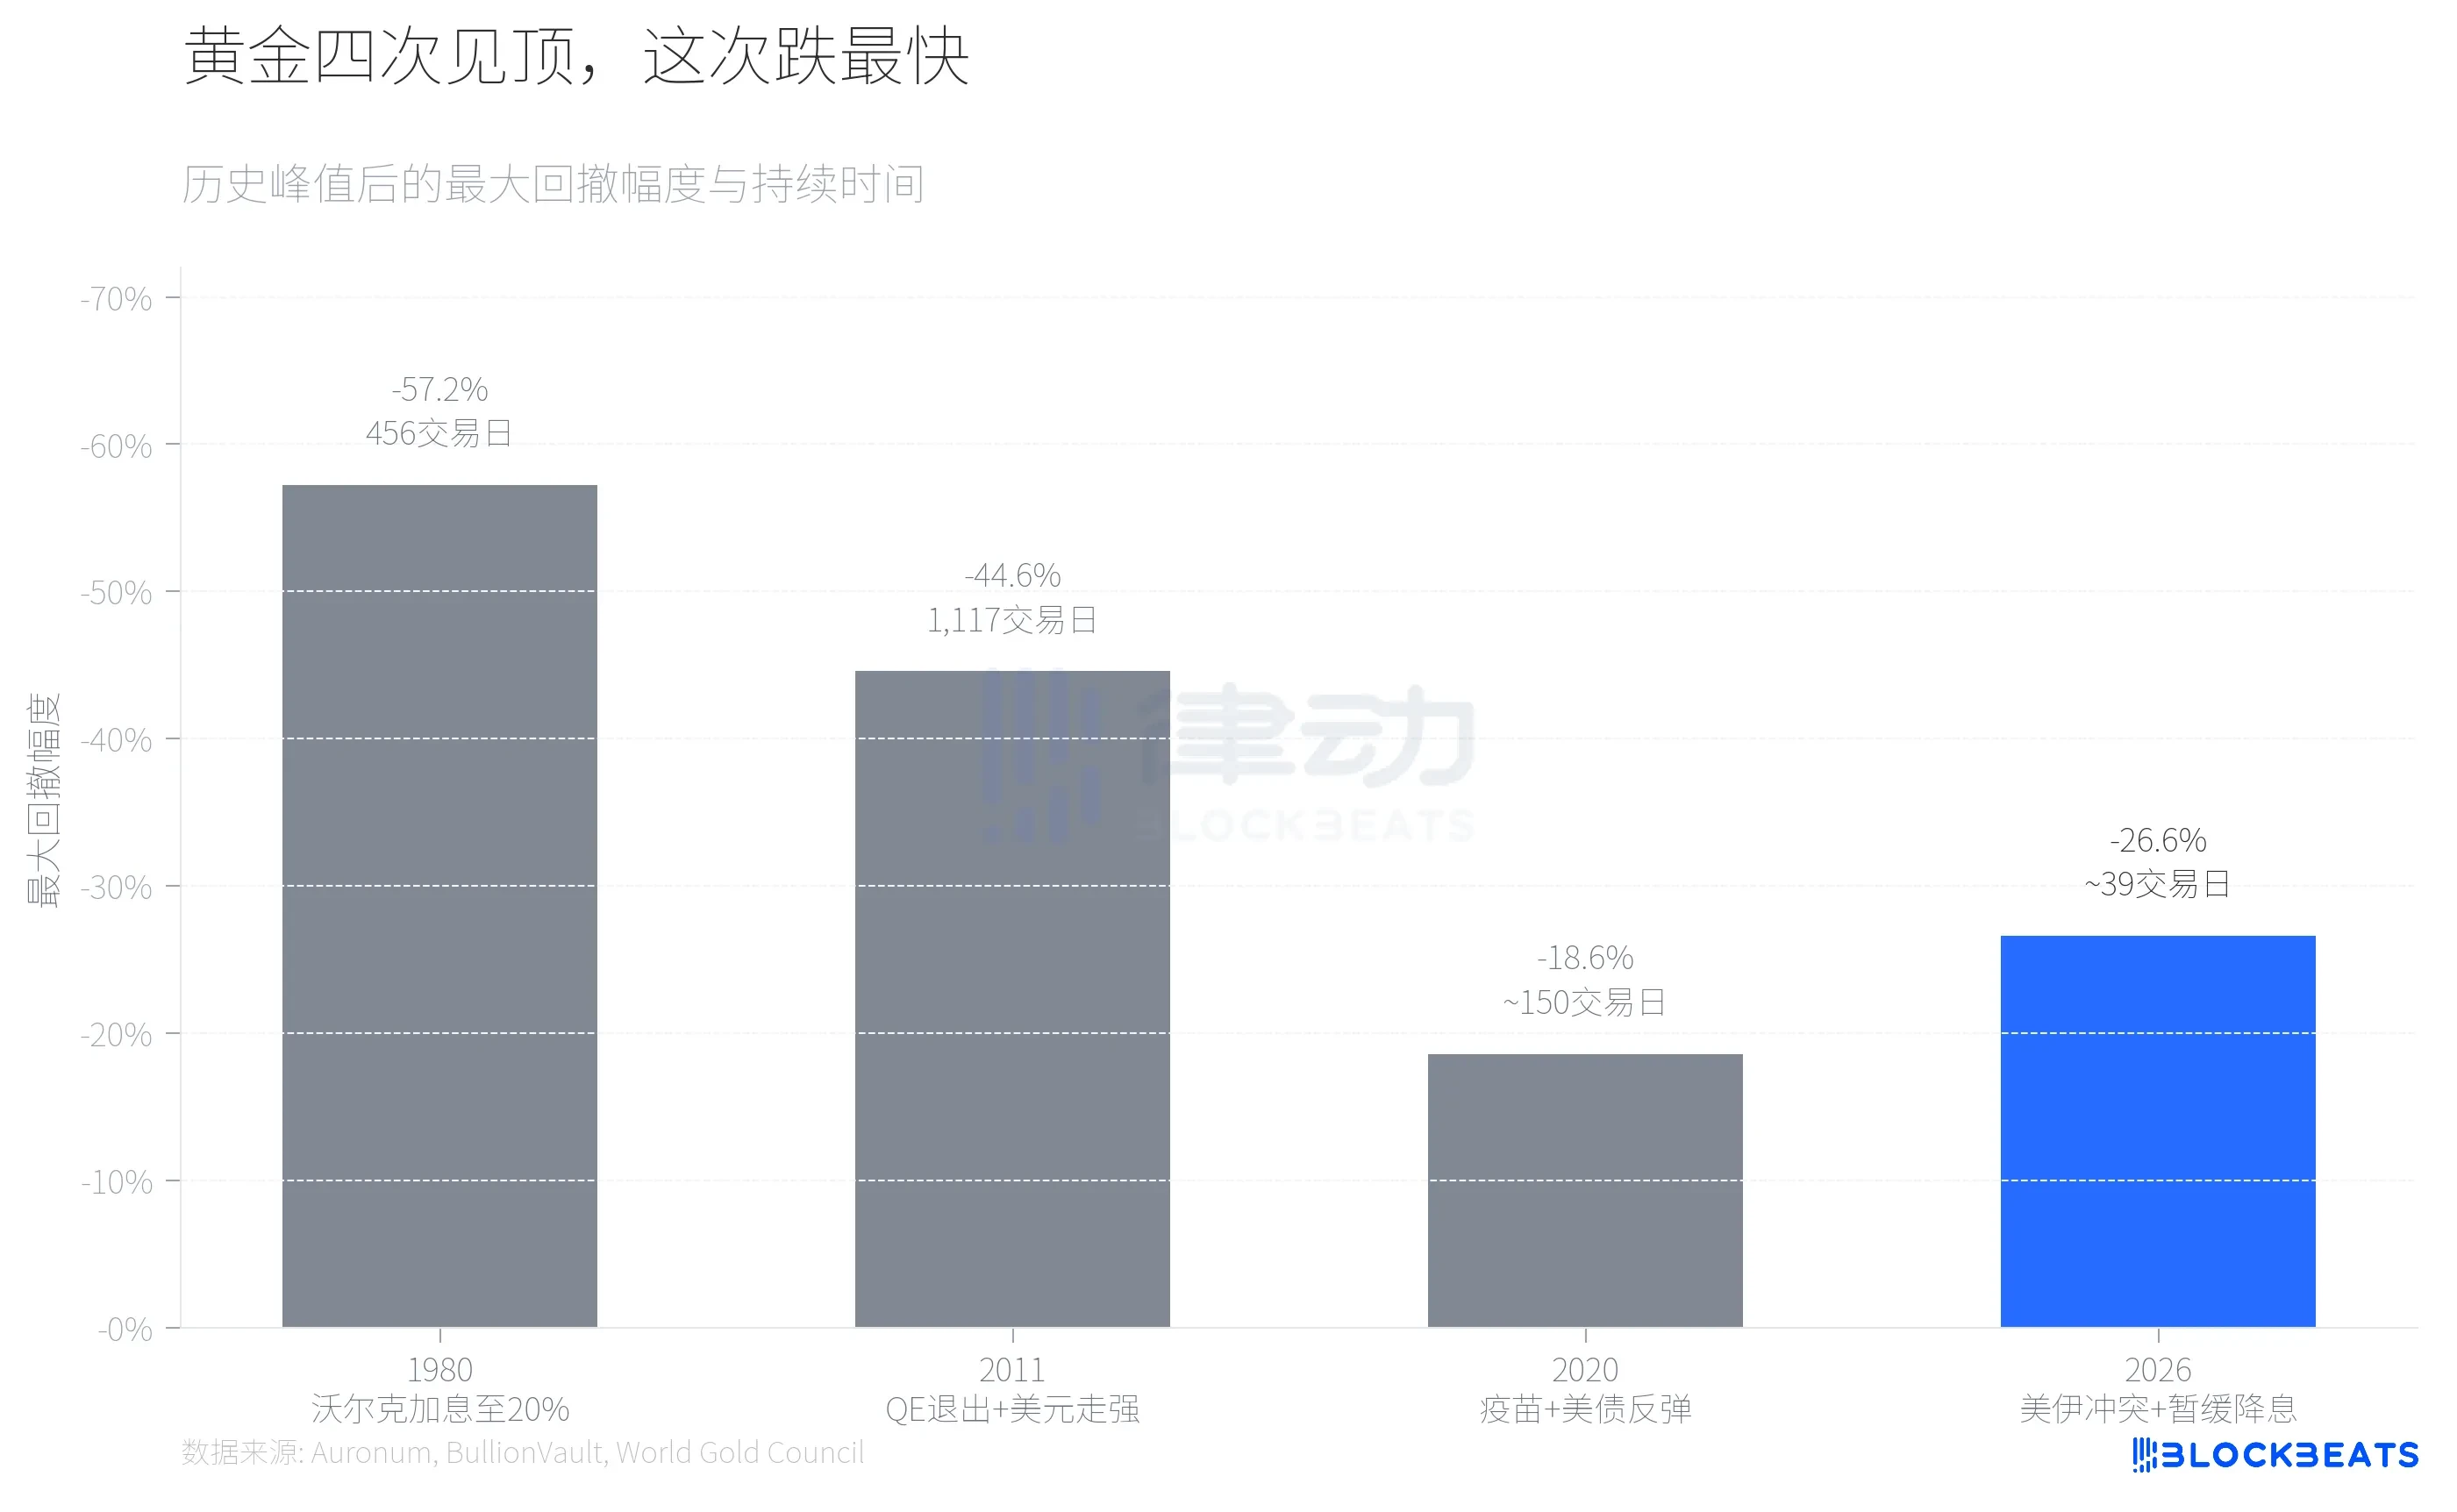
According to historical data compiled by the precious metals analysis firm Auronum, in 1980, when Volcker raised the federal funds rate to 20%, gold fell from a peak of $711 to $304, a decline of 57.2% over 456 trading days. In 2011, expectations of QE tapering combined with a stronger U.S. dollar caused gold to drop from $1,999 to $1,049, a decline of 44.6%, taking more than four years. The 2020 correction was milder; as vaccination efforts advanced and U.S. Treasury yields rebounded, gold retreated 18.6% from its peak of $2,067 but regained its upward momentum just seven months later.
The 2026 correction is currently down around 27%, surpassing 2020 and approaching 2011 levels. However, in terms of speed, it is the fastest of the four.
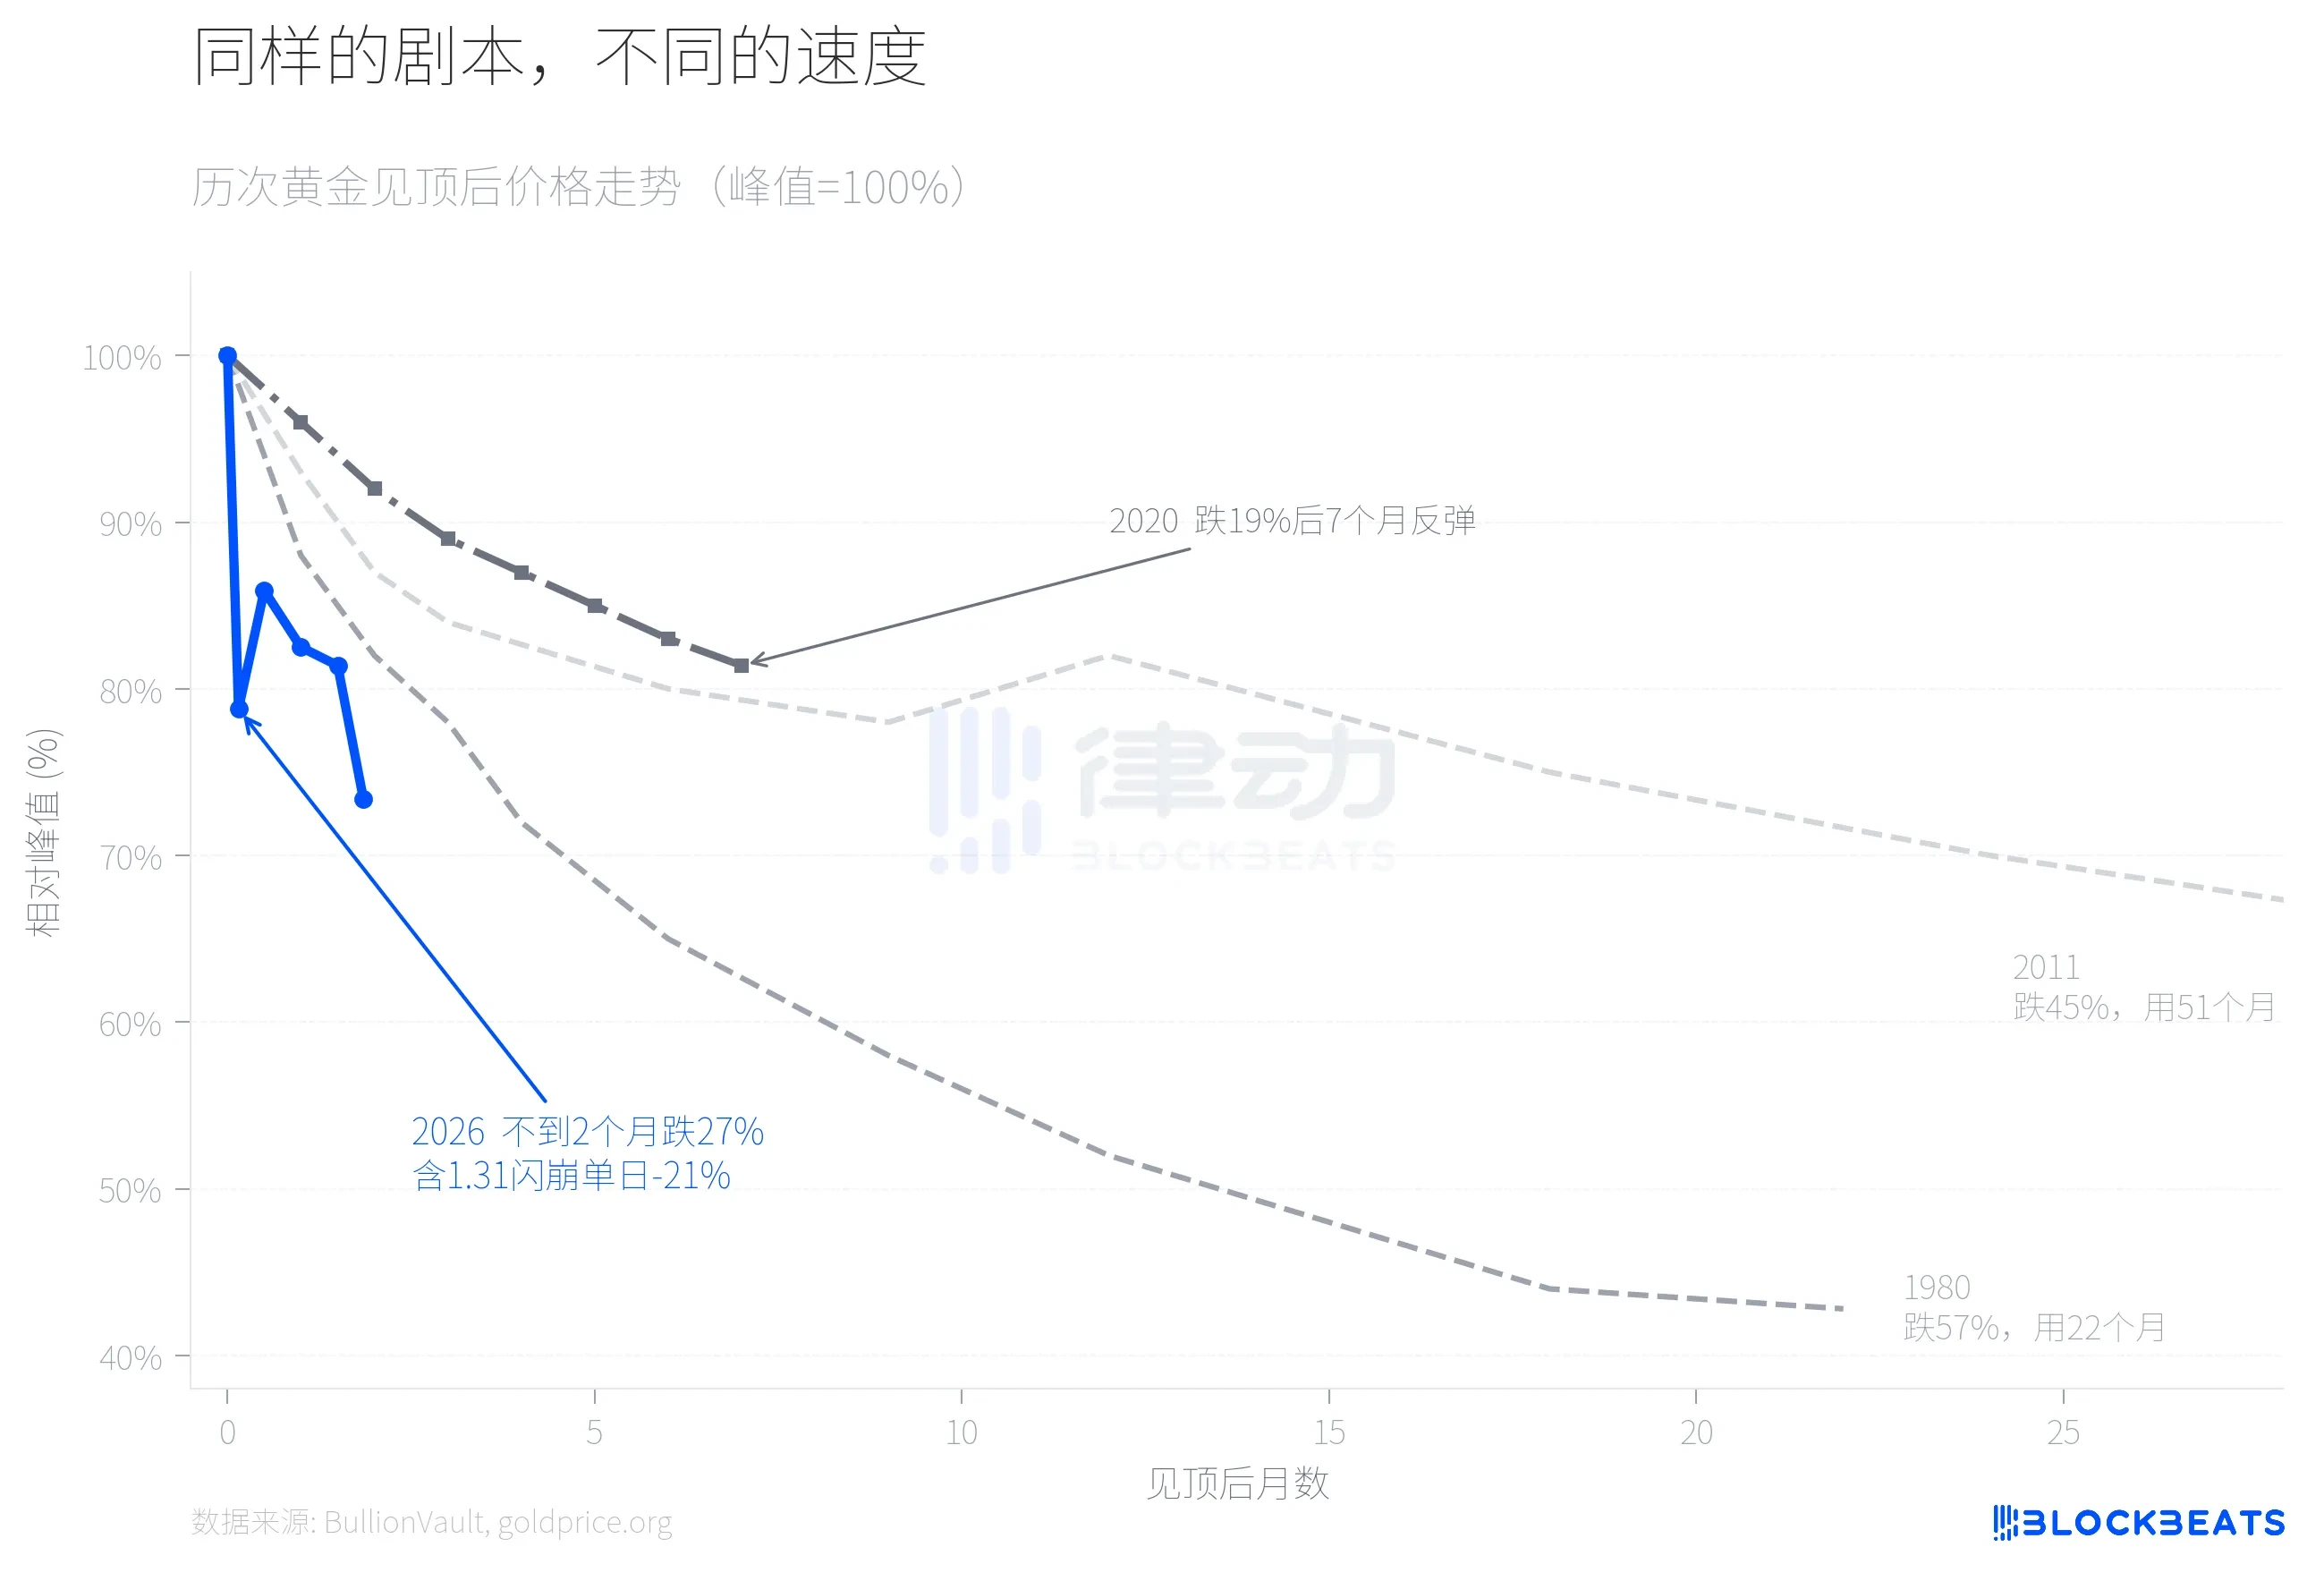
When overlaying the price movements of the four corrections, the differences are immediately apparent. It took nearly two years for the primary decline to complete in 1980, and over four years in 2011. In 2026, gold completed a 21% pullback by the fifth trading day after reaching its peak, followed by a brief rebound, before accelerating downward again in the third week of March to around $4,100, pushing the cumulative decline to 27%. The flash crash on January 31 served as the turning point. According to data from BullionVault, the world’s largest precious metals trading platform, gold fell more than 10% that day, while silver plunged 13.7%. The iShares Silver ETF (SLV) recorded single-day trading volume exceeding $40 billion, ranking among the highest-volume single-day trades in U.S. securities history. Bruce Ikemizu, former head of precious metals trading at ICBC Tokyo, remarked that after observing this market for 40 years, he had “never seen volatility of this magnitude.”
Why was the speed so unusually fast? A key factor was CME’s change on January 13 from a fixed-amount margin system to a percentage-of-contract-value system for COMEX margins. According to CME Group data, gold futures margin increased from 8% to 9%, and silver futures margin rose from 15% to 18%. In a rapidly rising market, a percentage-based margin system means higher prices require more margin, creating a self-reinforcing deleveraging mechanism. According to goldsilver.com, over 67 million ounces of silver paper contracts were forcibly liquidated within minutes on the day of the flash crash.
The performance of silver has been an overlooked dimension in this plunge.
In April 2025, the gold-to-silver ratio briefly surpassed 100:1, with silver significantly lagging behind gold. Subsequently, silver entered a sharp rally, surging 147% for the year (compared to gold’s 67% gain). The gold-to-silver ratio steadily declined, falling to approximately 46:1 when silver reached its peak of $121.67 per ounce—the lowest level since 2013.
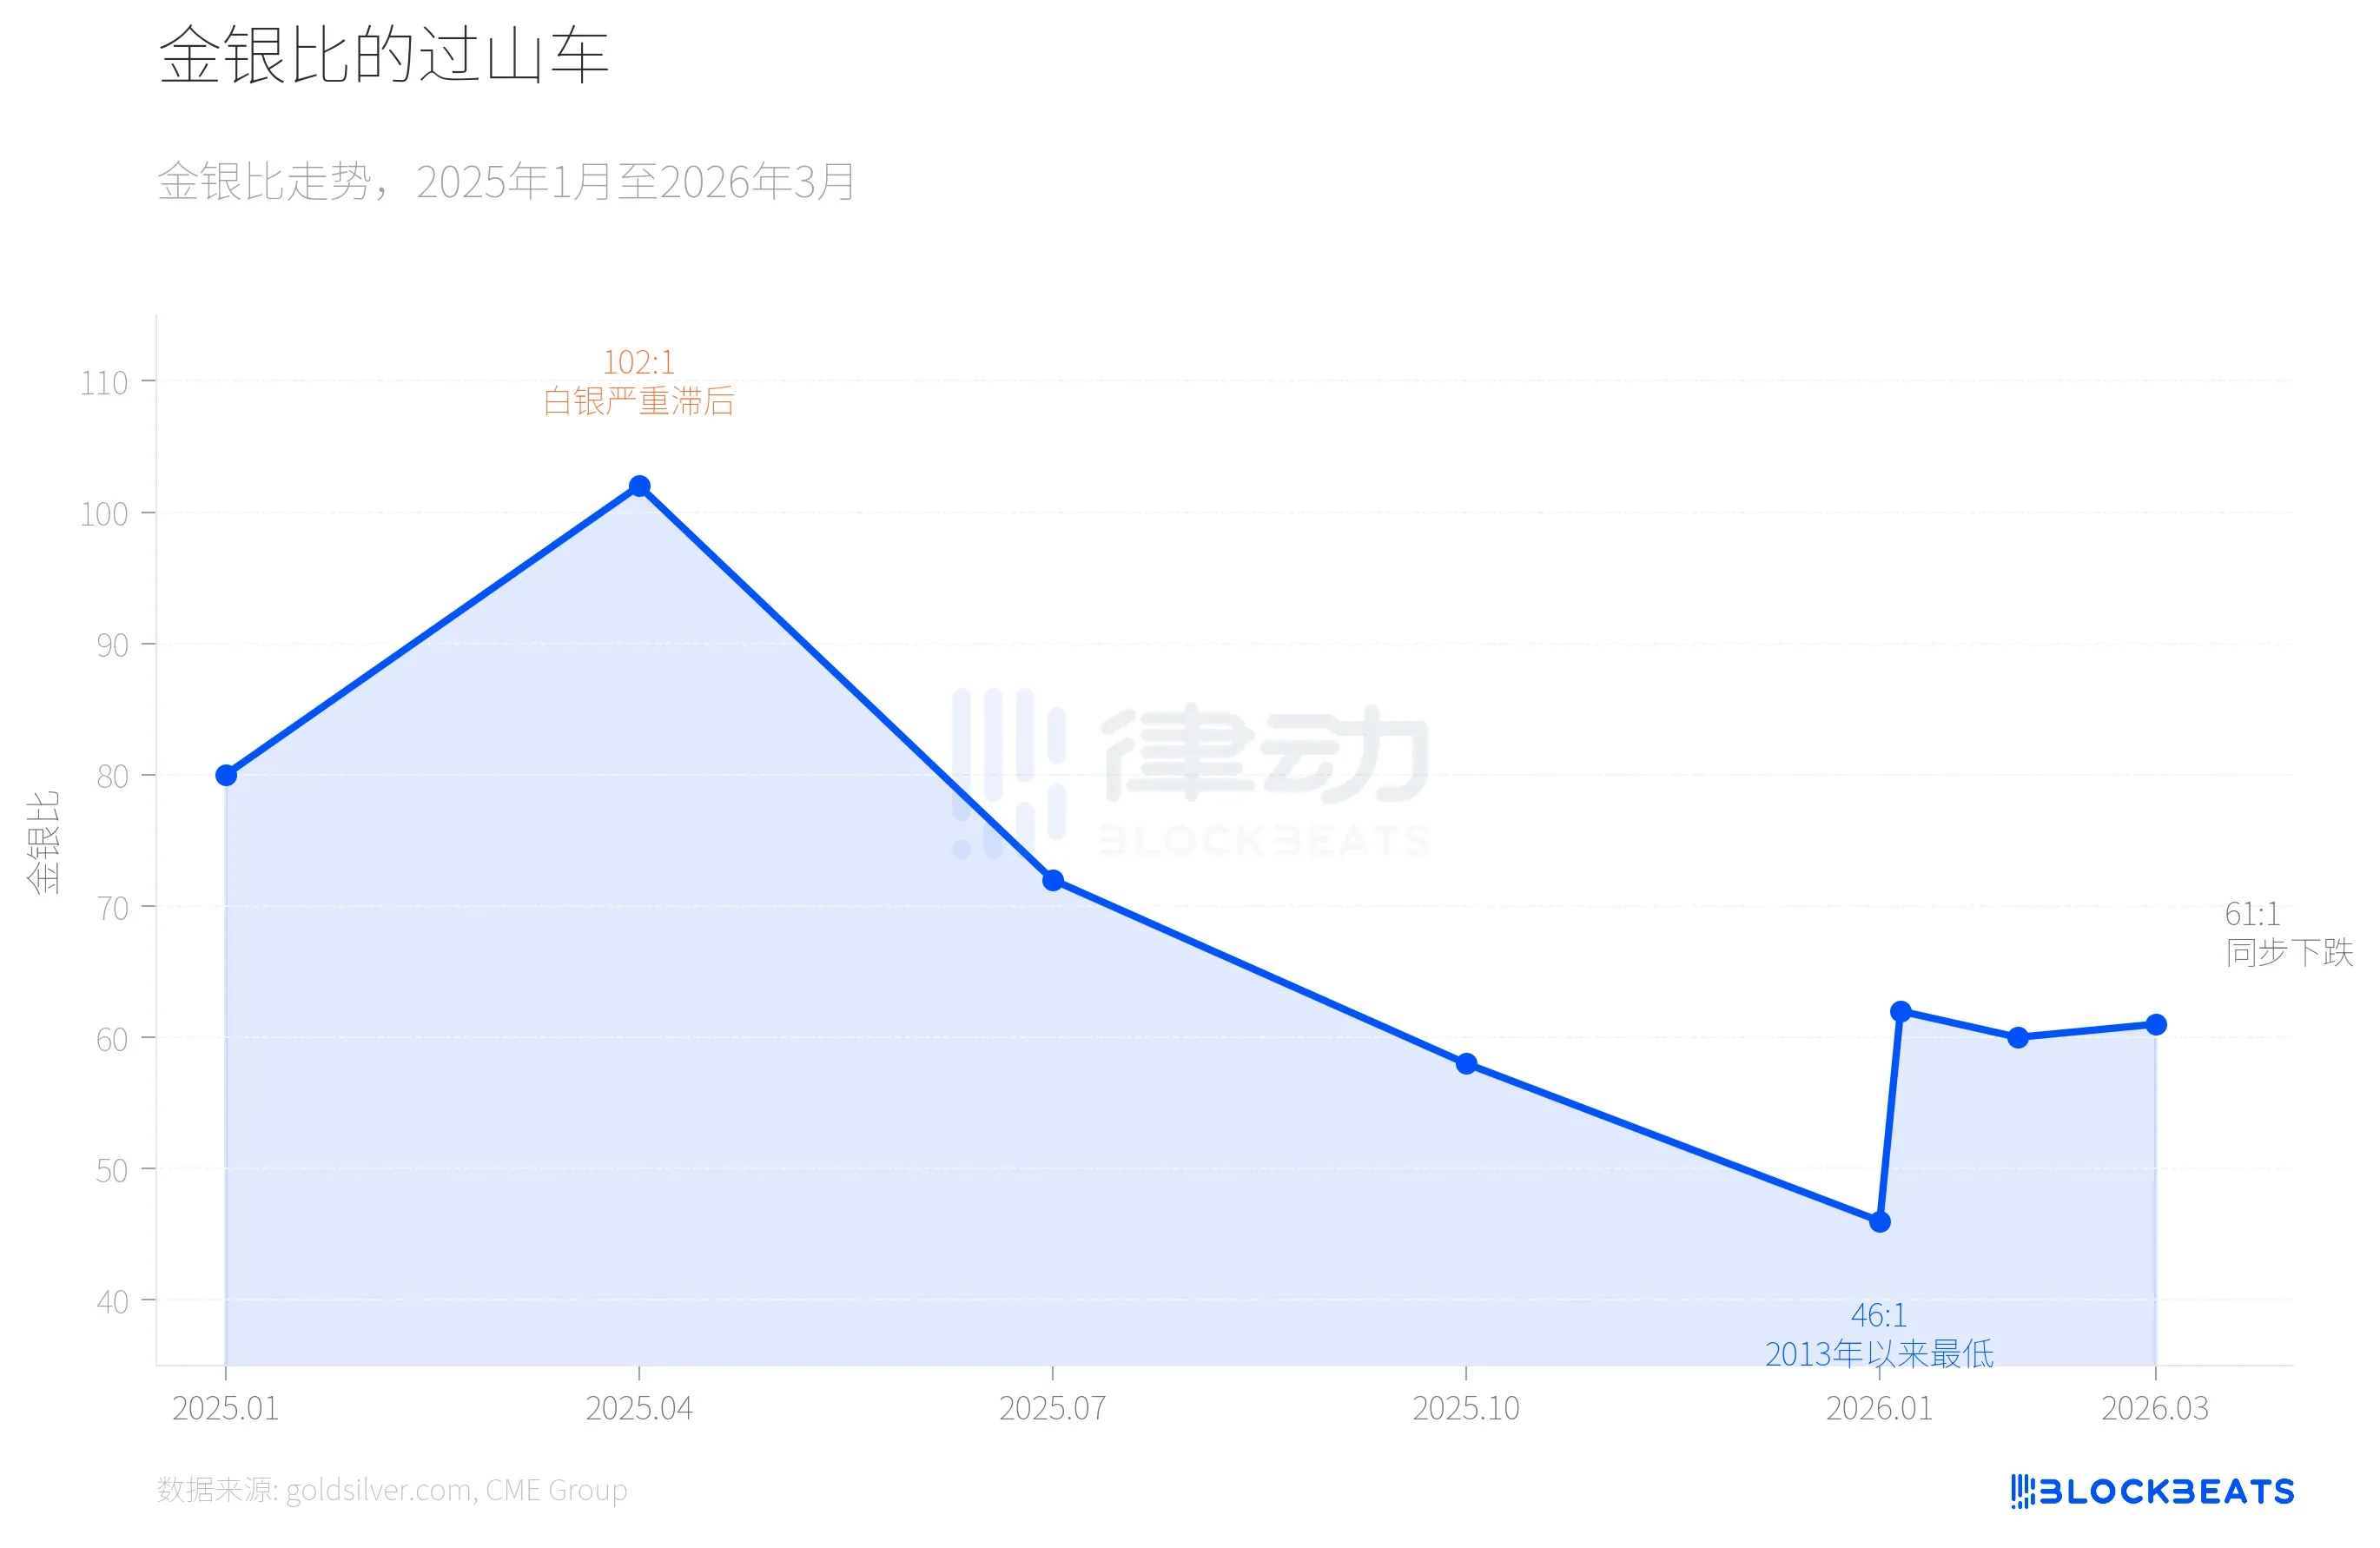
Then everything reversed on January 31. According to platform data, silver plunged 13.7% in a single day, with its cumulative decline from the peak of $121.67 reaching as much as 41.1%, far exceeding gold’s 26.6% drop during the same period. This was one of the most dramatic single-day movements in precious metals since the Hunt brothers’ event in 1980 (“Silver Thursday”). As of March 23, silver was trading at approximately $67.40, with the gold-to-silver ratio rebounding from a low of 46:1 to around 61:1. The gains silver had accumulated over nine months were largely erased in less than two months.
The core reason for this asymmetry lies in silver’s dual nature. On one hand, according to a CME Group research report, photovoltaic panel capacity increased by 18% year-over-year, and industrial demand for silver continues to expand structurally. On the other hand, leverage in the silver market is significantly higher than in gold, and CME’s increase in margin requirements from 15% to 18% directly triggered widespread liquidations. The industrial fundamentals remain unchanged, but financial leverage collapsed first.
The final signal worth noting is the divergence in funding structure.
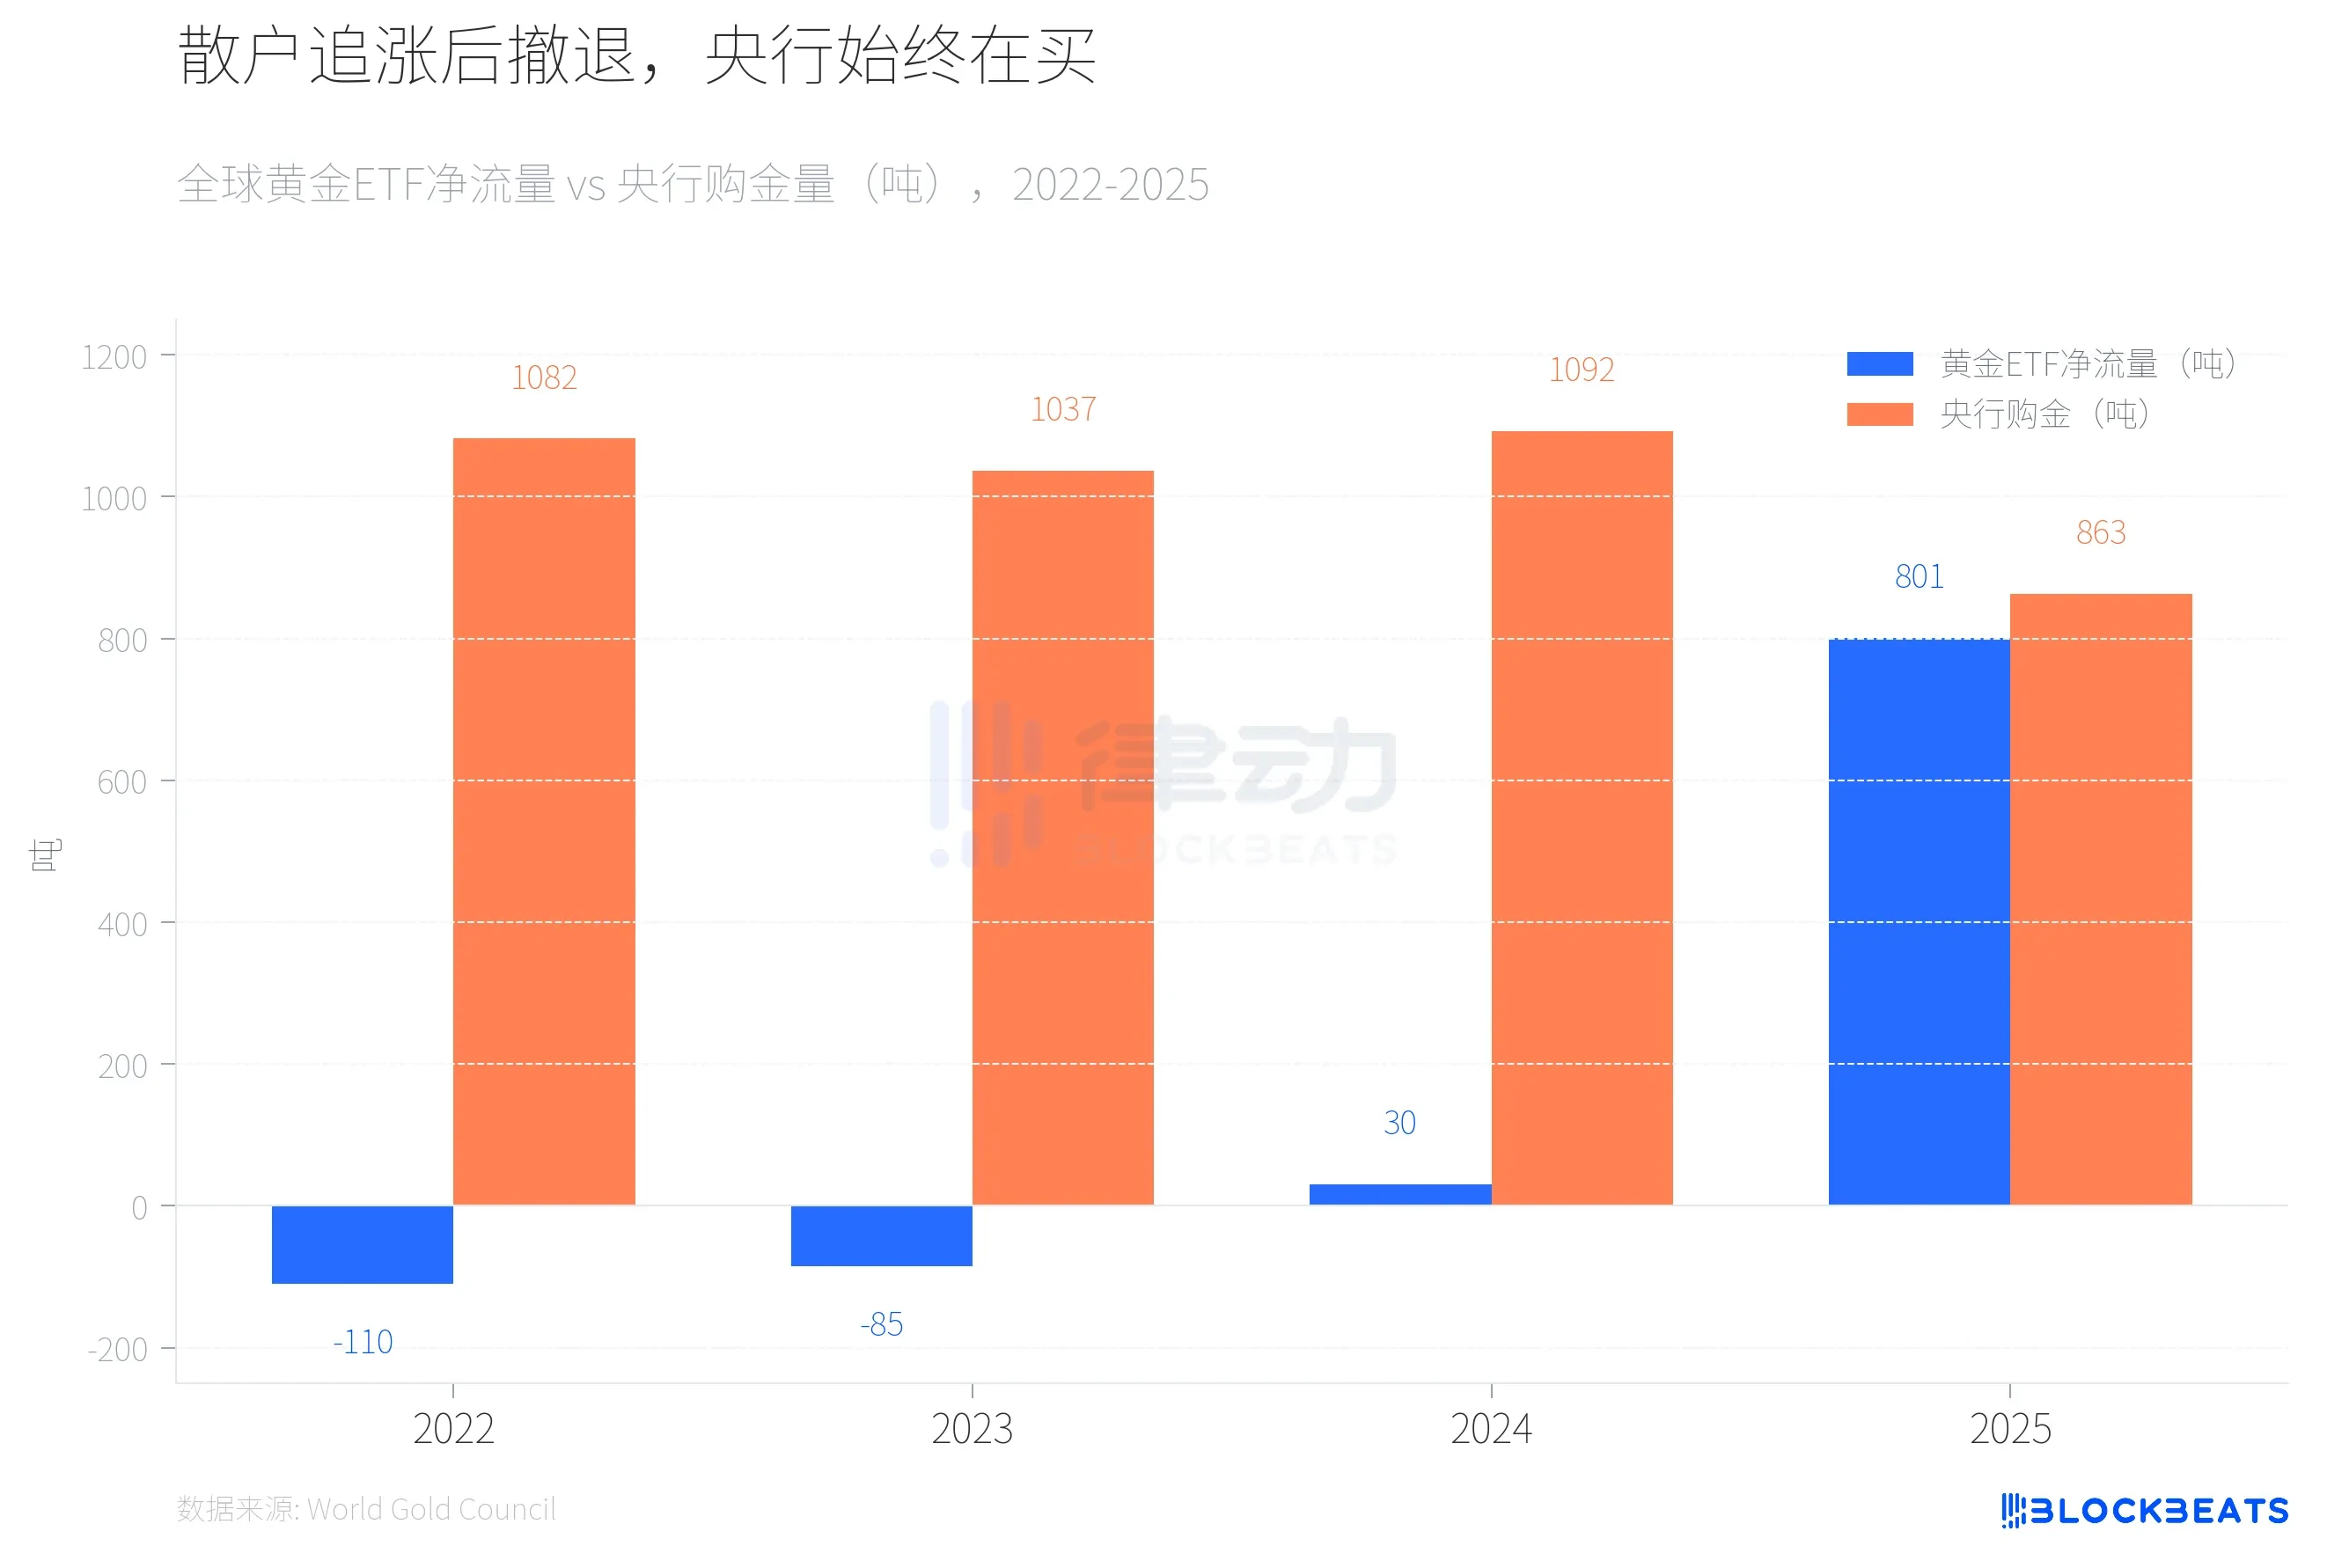
From 2022 to 2023, global gold ETFs experienced two consecutive years of net outflows (amounting to -110 tons and -85 tons, respectively), while central bank gold purchases exceeded 1,000 tons for two consecutive years. In 2024, ETF flows turned positive but remained modest at 30 tons, as central banks continued purchasing at a high level of 1,092 tons. In 2025, the situation changed dramatically: according to the World Gold Council, global gold ETFs recorded a record-breaking net inflow of 801 tons for the year, doubling their assets under management to $559 billion.
Then retail capital began to flee. According to the Canadian business media Chronicle Journal, the SPDR Gold Trust (GLD) experienced a single-day net outflow of $2.91 billion on March 4, marking the largest daily outflow since 2016, with a total loss of 25 tons of gold over seven days. Meanwhile, according to the institution’s annual report, global central banks purchased 863 tons of gold in 2025, a 21% decline from 2024 but still significantly higher than the 2010–2021 average of 473 tons. The same report showed that Poland’s central bank, with purchases of 102 tons, remained the world’s largest buyer for the second consecutive year, followed by Kazakhstan (57 tons) and Brazil (43 tons).
According to JPMorgan’s March report, the bank maintains its year-end 2026 gold price target at $6,300. However, according to the IEA’s March oil market report, a blockade of the Strait of Hormuz would reduce global crude oil supply by approximately 8 million barrels per day, equivalent to nearly 8% of global demand. The IEA described this as “the largest supply shock in the history of the global oil market,” with member countries having initiated the largest-ever release of 400 million barrels from strategic reserves.
For central banks of oil-importing countries, responding to oil price shocks may take priority over continued gold accumulation. In the first three peaks, global central banks were not net buyers of gold. They purchased 863 tons in 2025, but the 2026 figure remains unknown.