


Original | Odaily Planet Daily (@OdailyChina)
Author | Wenser (@wenser 2010)
After enduring a sudden shock from the nearly six-week-long U.S.-Iran conflict, gold has finally returned above $4,800 for the first time in nearly a month, following news of a U.S.-Iran ceasefire agreement.
From the gold token XAUm mentioned as early as October 2024, to the accurate prediction in September last year that gold would rise above $3,900 when spot gold was at $3,500, and then to the gold token XAUT mentioned in January this year when gold reached around $4,500, I myself began my dollar-cost averaging journey while keeping an eye on gold.
On the macro level, against the backdrop of escalating geopolitical tensions, central banks around the world continue to steadily increase their gold reserves, with the People’s Bank of China purchasing gold aggressively for 17 consecutive months; major investment institutions and banks also remain highly confident in gold’s upward price momentum.
Given this, Odaily Planet Daily will explore the question: What is this year’s upper limit for gold?
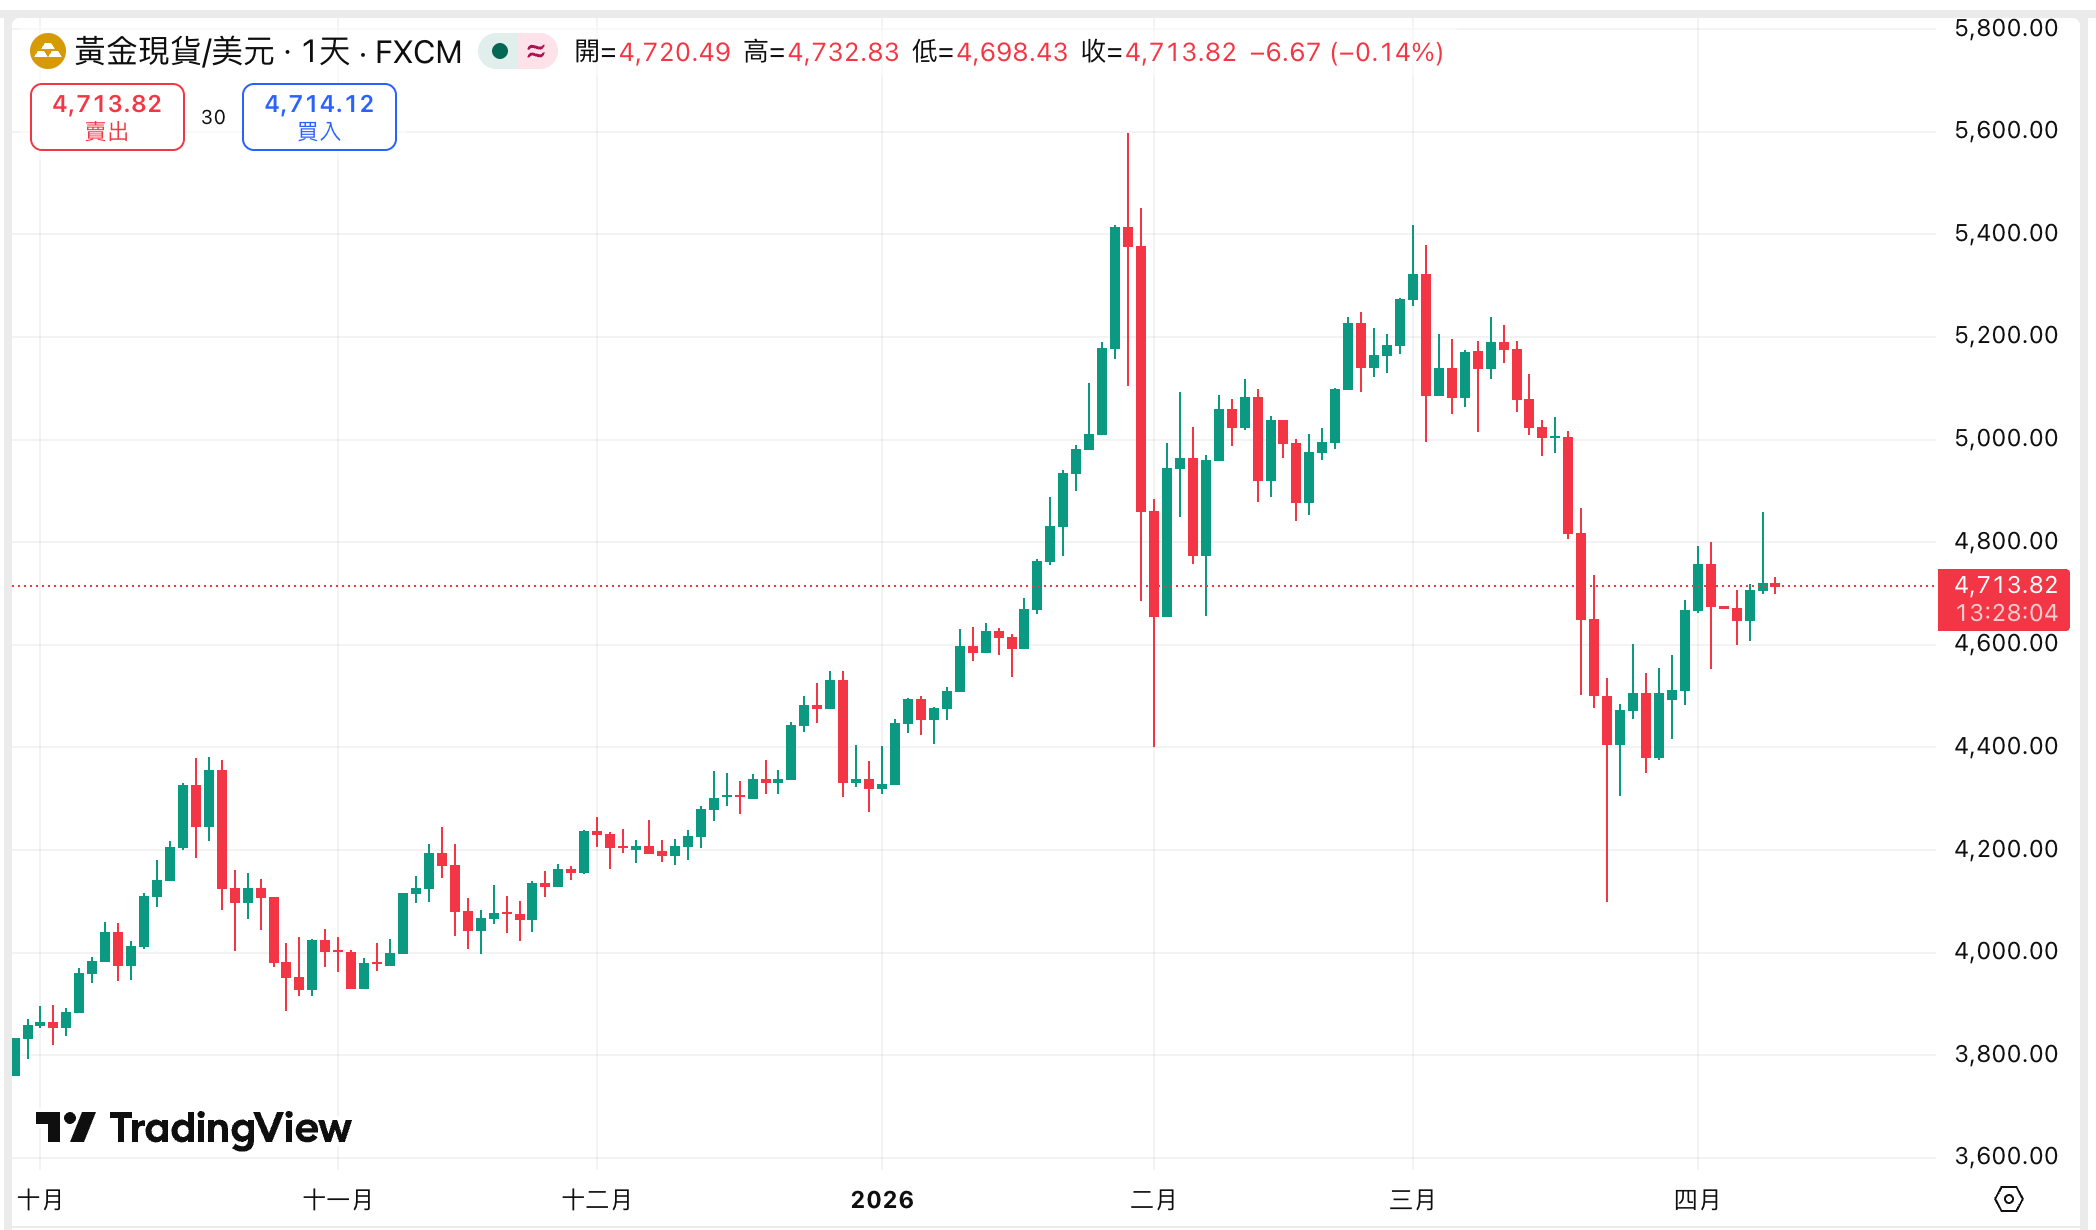
Gold price movement over the past six months
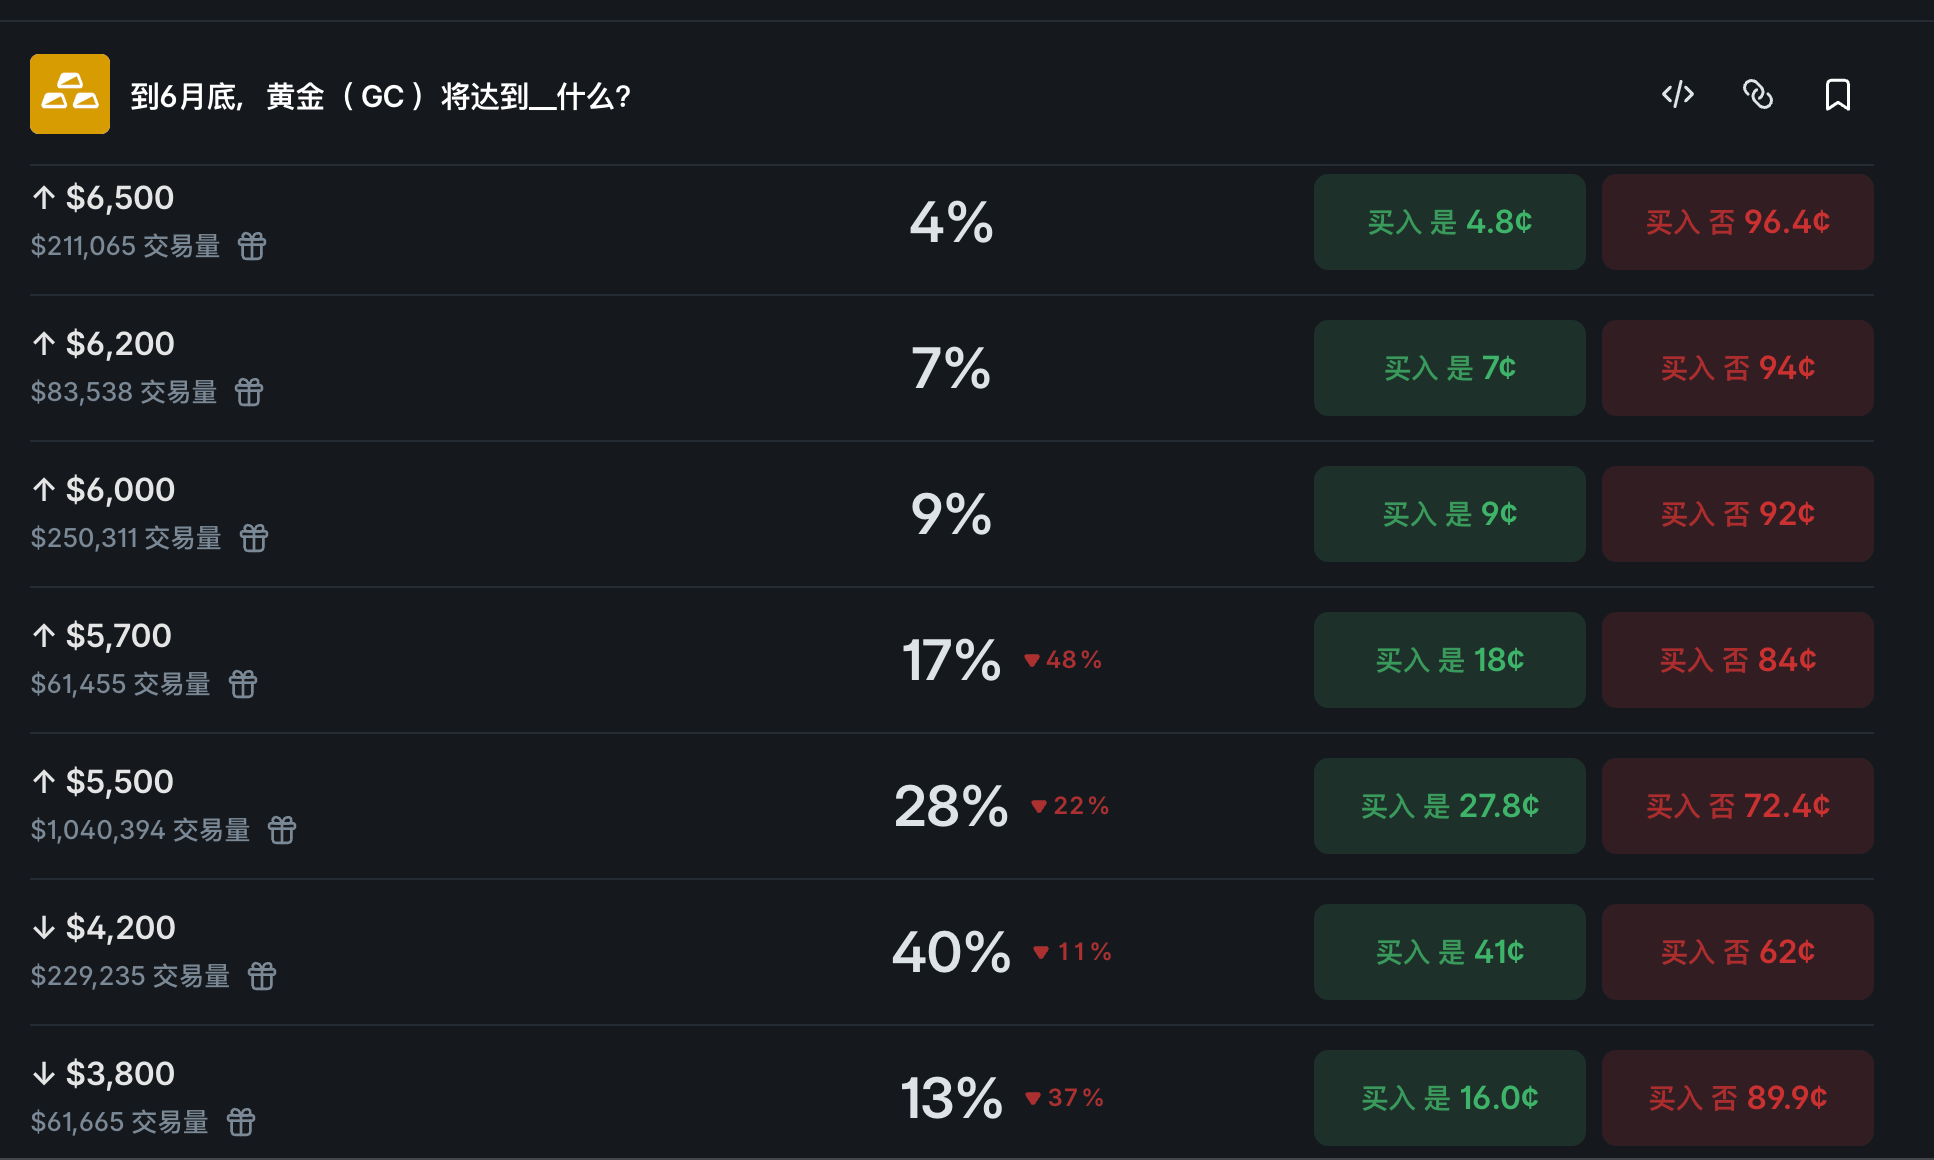
Market predictions on gold price movements: Price may fall below $4,200 before June, with a potential high above $6,000 within the year.
Since the emergence of prediction markets, influenced by factors such as real-money betting and the "wisdom of the crowd," they have become important indicators for forecasting asset prices. Currently, Polymarket indicates that the price range for gold this year is approximately $3,800 to $6,000.
The total amount wagered on the mid-year gold price prediction on Polymarket currently exceeds $3.5 million, including:
The highest probability is 40% for below $4,200;
The probability of exceeding $5,500 is second at 28%;
Secondly, there is a 17% probability of exceeding $5,700 and a 13% probability of falling below $3,800.
On Polymarket, the gold price prediction for this year has only around $200,000 in betting volume, of which:
The highest probability is above $6,000, at 46%;
The probability of exceeding $7,000 is second highest at 25%;
The probability of exceeding $8,000 is again at 16%.
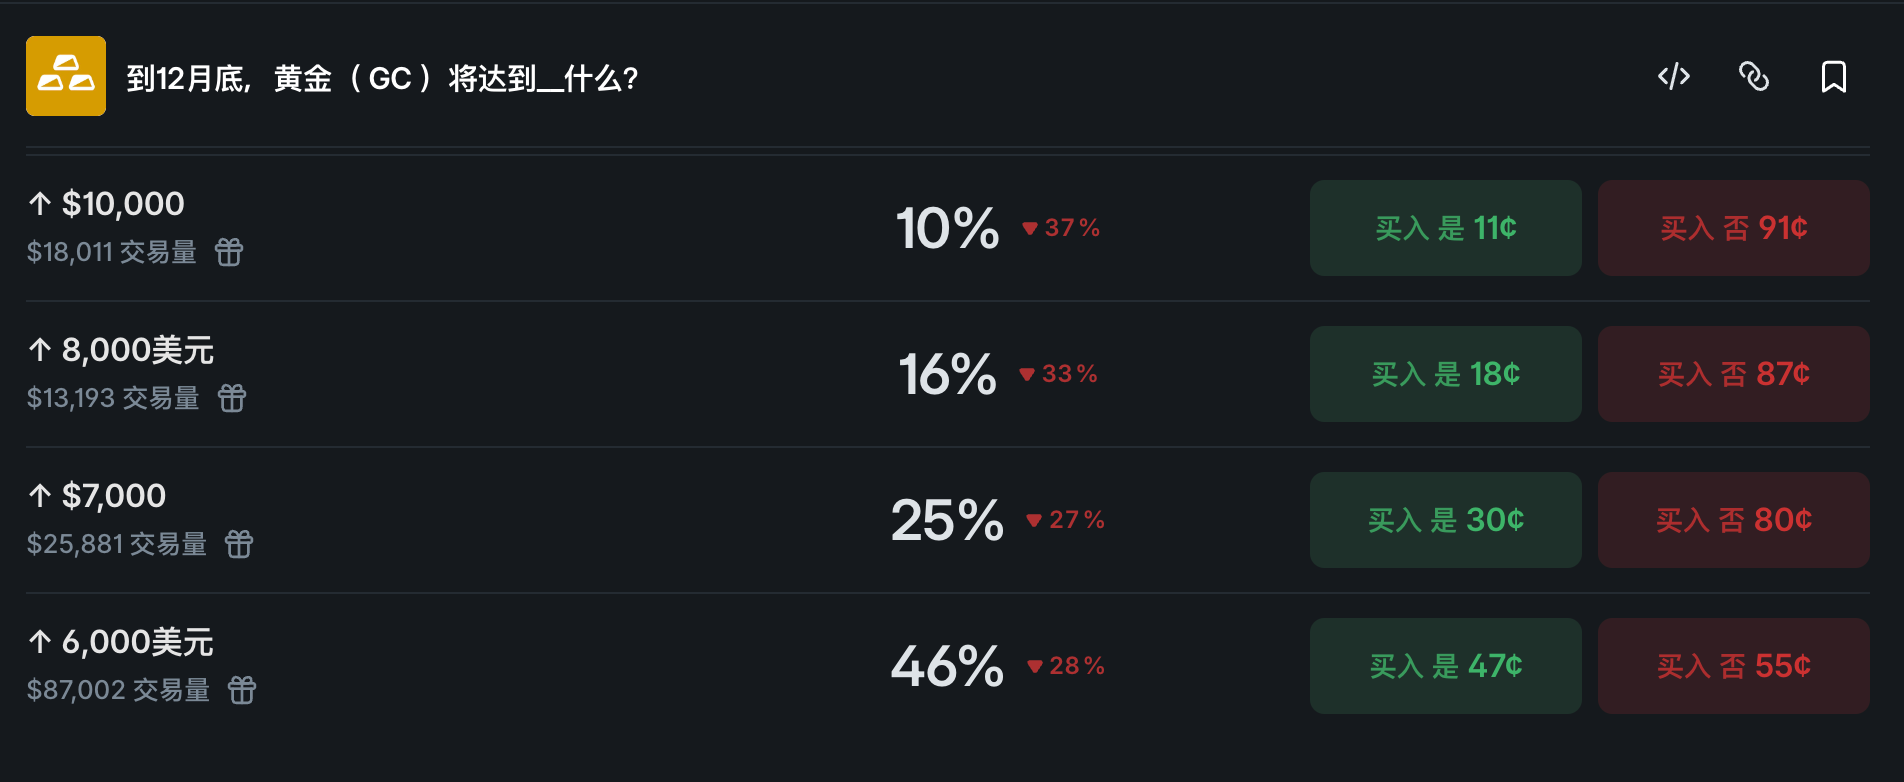
In other words, despite relatively low trading volume, prediction market users have priced in a nearly 20% chance of reaching above $6,000 this year.
It is important to note that the rules for gold-related events on Polymarket use the official settlement price of the active month CME Gold (GC) futures contract; intraday trading, high, low, bid, ask, midpoint, or indicative prices are not included.
Macro buying: Central banks around the world continue to increase reserves, with the Central Bank of Turkey exchanging gold for currency.
As the world's largest asset class by market capitalization, gold's largest buyers are naturally central banks around the world, which hold the power to issue fiat currency.
In early April, the World Gold Council released the February Central Bank Gold Purchases Monthly Report. It noted that central banks globally net purchased 19 metric tons of gold in February 2026, rebounding from 5 metric tons in January 2026, though still below the monthly average of 26 metric tons reported for 2025. The report also highlighted that several central banks maintained a streak of continuous net gold purchases, accumulating 44 metric tons from November 2024 to February 2026, with the Czech Republic reporting its 36th consecutive month of net buying. China extended its streak of monthly gold accumulation to 16 consecutive months (as of February data).
A Goldman Sachs report at the end of March indicated that gold’s medium-term outlook remains strong, supported by continued central bank buying and expectations that the Federal Reserve will cut rates twice this year, with gold prices potentially rising to $5,400 per ounce by year-end. UBS, also at the end of March, projected a target price for gold of $5,900 per ounce by early 2027.
On the 7th of this month, the People's Bank of China issued an announcement, reporting that China’s gold reserves as of the end of March amounted to 74.38 million troy ounces (approximately 2,313.48 metric tons), an increase of 160,000 troy ounces (approximately 4.98 metric tons) from the end of February, when reserves stood at 74.22 million troy ounces (approximately 2,308.5 metric tons), marking the 17th consecutive month of gold accumulation.
On the other side, traditional gold reserve powers such as the United States (approximately 8,100 tons), Germany (approximately 3,300 tons), Italy (approximately 2,400 tons), and France (approximately 2,400 tons) have remained largely unchanged.
Regarding the pressure on the fiat system in the Middle East due to the U.S.-Iran conflict, many are only aware of the surface: “The Central Bank of Turkey has sold over 120 tons of gold in the past three weeks, worth $20 billion.” In reality, most of this gold has not entered the market—it is part of gold-currency swap futures. In simpler terms, the Central Bank of Turkey has pledged its gold reserves as collateral to obtain U.S. dollar foreign exchange, thereby stabilizing the exchange rate of its domestic currency, the lira.
Structurally, the proportion of gold reserves in emerging market central banks' total reserves remains low, at just over 10%, with China's share even in single digits, indicating that global central banks have substantial room for further increases, and the strategic demand for "de-dollarization" will provide sustained, long-term buying pressure on gold for years to come.
Crypto buying pressure: Tether, the stablecoin giant, now ranks among the top 30 globally in gold reserves.
In February, Wall Street investment bank Jefferies released a report stating that stablecoin issuer Tether has continued to increase its gold holdings, with its gold reserves reaching approximately 148 metric tons as of January 31, valued at around $23 billion at current prices—surpassing the gold reserves of multiple sovereign nations and ranking among the top 30 largest gold holders globally.
The report shows that Tether added approximately 26 tons of gold in the fourth quarter of 2025 and continued to increase its holdings by about 6 tons in January this year, making its quarterly gold purchases second only to a few central banks such as those of Poland and Brazil. Its current gold reserves now exceed those of countries including Australia, the United Arab Emirates, Qatar, South Korea, and Greece.
The institution noted that the aforementioned gold is primarily used to back the USD-pegged stablecoin USDT and the gold-backed token XAUT (currently FDV market cap exceeds $3.3 billion). As Tether is a private company, its disclosed data may represent only the minimum level, and its actual gold holdings could be higher than reported. Tether CEO Paolo Ardoino previously stated that the company plans to allocate approximately 10%–15% of its portfolio to physical gold.
Retail buying: Being trapped at high levels ensures stable holdings.
In 2026, retail participation in gold investments increased significantly, with Asian capital emerging as a new main force in the gold market.
In January, Asian gold ETFs saw a record monthly inflow of $10 billion.
In addition, Chinese investors purchased 432 metric tons of gold bars and coins in 2025, setting a new all-time high. The scenes of long queues outside gold shops rushing to buy accumulated gold, along with frequent sell-outs of accumulated gold on bank apps, reflect strong public confidence in gold’s value-preserving function.
However, the flip side of retail buying is increased volatility in gold prices. In January, gold plunged over 9% in a single day following the nomination of Kevin Warsh as Fed Chair, marking its largest single-day drop in nearly 40 years; in March, gold prices briefly fell below $4,200 per ounce, leaving many retail investors trapped at high levels. In contrast, the People’s Bank of China’s significant gold accumulation highlights a clear divergence: retail panic selling versus sovereign funds buying on dips.
As a result, the large volume of retail buying at higher levels prevents excessive gold selling throughout the year.
Institutional view: Gold will reach new highs, with prices potentially around $5,200 by end of June.
At the institutional level, UBS, long known for its keen interest in the precious metals market, has frequently shared its views this year.
On January 21, UBS precious metals strategist Joni Teves stated that demand for portfolio diversification is the core driver behind this rally in gold prices, with institutional investors, retail investors, and central banks around the world increasing their gold holdings to hedge against macroeconomic uncertainty. Gold prices are expected to maintain upward momentum in the first half of the year; if concerns over the Federal Reserve’s independence continue to rise, gold could potentially reach $5,000 per ounce in the first half. Silver, supported by the upward pressure from gold and a narrowing supply-demand gap, may challenge $100 per ounce this year.
Subsequently, gold and silver surged, with gold briefly rising to nearly $5,600 per ounce and silver reaching as high as $120 per ounce.
On February 24, UBS stated that gold prices are expected to reach $6,200 per ounce in the coming months, as the key factors driving its strong rally over the past year remain in place.
Subsequently, on February 28, the U.S.-Iran conflict officially erupted as Israel and the United States jointly launched strikes against Iran, igniting regional hot warfare.
On March 5, UBS analysts noted in a report that data dating back to 1900 shows economic risks have proven more significant than geopolitical risks for financial markets. They stated that, in most cases, investors perform best when they can “look through” geopolitical noise.
At the end of March, UBS estimated that gold's target price in early 2027 will be $5,900 per ounce.
On April 2, UBS strategist Joni Teves expected that, despite recent volatility in gold prices, gold will reach a new high this year, viewing the recent pullback as a buying opportunity. UBS forecasts the average gold price to be $5,000 per ounce in 2026, and $4,800 and $4,250 per ounce in 2027 and 2028, respectively.
On April 7, UBS lowered its gold price forecast for the end of June to $5,200 per ounce, as investor demand cooled amid increased market volatility.
In addition, in early February, JPMorgan publicly expressed strong bullish sentiment toward gold, estimating a year-end target of $6,300, representing a 34% upside potential.
Understanding the nature of gold: a safe-haven asset and the core of a de-dollarized monetary system
Finally, let’s briefly discuss the essence of gold investment.
In 1971, the United States dismantled the Bretton Woods system it had established. Since then, the price of gold has surged from $35 per ounce to nearly $5,000 per ounce today, representing a cumulative increase of over 94 times. Looking at investment cycles of 4 to 5 years, this has spanned at least 10 full bull and bear market cycles.
Following the outbreak of the Russia-Ukraine conflict in 2022, the economic process of "de-dollarization" accelerated rapidly, prompting central banks worldwide to launch a new round of gold reserve accumulation, gradually giving rise to the past three years' "super cycle" for gold.
As we enter 2026, with the United States, under Trump, mobilizing military forces in the Middle East following provocations from Israel’s Netanyahu (Odaily Planet Daily note: Rumors suggest the U.S. and Israel are collaborating to target Iran, with Netanyahu personally lobbying for this move), although U.S. political and economic conditions are not collapsing overnight due to factors and policies such as AI, technology, and the return of domestic industry, the monetary credibility of the U.S. dollar is already showing signs of decline.
In January of this year, the renowned investment bank Morgan Stanley stated, the role of the U.S. dollar in the global system is being continuously and gradually weakened; however, due to the limited availability of credible alternative currencies, gold has emerged as the greatest challenger to the dollar in an increasingly multipolar world. According to Morgan Stanley’s research, the international influence of the U.S. dollar has declined across multiple indicators, including a reduction in its share of foreign exchange reserves held by central banks and decreased usage in corporate and emerging market sovereign issuances. Nevertheless, the dollar still holds the largest share of global reserves, indicating that no substantial challenger has yet emerged. However, the situation changes when gold is taken into account: the share of gold in central bank asset holdings has risen from approximately 14% to 25–28%, and this upward trend “shows no signs of slowing.” Risk premiums and hedging behaviors will continue to exert pressure on the dollar while supporting demand for gold.
Despite the turmoil in Dubai caused by the U.S.-Iran conflict, which has cast doubt on gold’s status as a safe-haven asset due to its inconvenience in transport, it remains, under current global conditions, the only universally recognized hard currency besides the U.S. dollar.
The fact that Iran, which controls the Strait of Hormuz, has begun accepting renminbi, BTC, and other cryptocurrencies for toll fees has, to some extent, exposed the declining credibility of the US dollar within the global economic system.
Therefore, despite Bloomberg Intelligence Senior Market Analyst Mike McGlone warning in his April Metals Market Outlook report that gold and silver may have topped out, and the “once-in-a-generation” peak may have passed, gold remains at a relatively low point for the year given Trump’s current inconsistent and unpredictable political stance.
Based on the above multi-dimensional analysis, the 2026 gold price trajectory may be summarized as a three-phase structure: "a peak in Q1, a shallow correction in Q2, and a bottoming-out and recovery in Q3 and Q4." The core trend remains upward, but volatility will be significantly higher than in previous years.
At the current price level of $4,800 per ounce, gold may be in a corrective rebound phase, with $4,900 serving as the key resistance zone in the near term. The progress of U.S.-Iran ceasefire negotiations, U.S. CPI data, and Federal Reserve policy signals will be the most critical price catalysts in the short term. If the ceasefire agreement holds and oil prices continue to decline, heightened expectations for rate cuts could propel gold toward the $5,200 mark by the end of the second quarter.
In the second half of the year, as U.S. inflation pressures ease alongside falling oil prices, the Fed’s window for rate cuts reopens, and a weaker dollar will provide greater upward potential for gold. Additionally, the uncertain outcome of the midterm elections will offer some political momentum for price increases in gold, BTC, and other assets.
Regarding price ceilings, based on institutional forecasts and market trends, the reasonable upper price range for gold in 2026 is projected at $5,400 to $6,000 per ounce, with potential increases to $6,200–$6,400 per ounce under optimistic scenarios.
In summary, the United States is like the declining Qin dynasty—“When the Qin lost its deer, all under heaven raced to chase it.” At this time, among all major asset classes, which other can offer secure protection and value preservation better than gold?
Recommended Reading
What’s more noteworthy behind the gold retracement: the loosening of the old system