


Original Author:Garrett
Translated by Jiahuan, ChainCatcher
Recently, some analysts have been comparing the current BTC price movement to that of 2022. Admittedly, short-term price patterns may appear somewhat similar.But if we look at the long-term picture, such a comparison is entirely absurd.
Whether it's from:
Long-term Price Patterns
Macro-economic Background
Investor Composition and Supply/Holding Structure
itsThere are fundamental differences in the underlying logic..
In the analysis and trading of financial markets,The biggest mistakeIt is no more than fixating solely on short-term, superficial statistical similarities while ignoring long-term, macro-level, and fundamental driving factors.
Opposite macro background
In March 2022, the United States was deeply entrenched in a period of high inflation and interest rate hikes, driven by factors including:
Excess liquidity during the COVID-19 pandemic
The crisis triggered by the outbreak of the war in Ukraine has further intensified inflation.
At that time, risk-free interest rates were continuously rising, liquidity was being systematically withdrawn, and financial conditions were becoming increasingly tight. In such an environment, the primary objective of capital isRisk mitigationWhat we saw at that time on BTC was essentially aHigh-Position Distribution Structure During a Tightening Cycle.
Currently, the macro environment is exactly the opposite:
The conflict in Ukraine is cooling down (partly due to the United States' efforts to reduce inflation and interest rates).
The CPI (Consumer Price Index) and the risk-free interest rate in the U.S. are declining.
The AI technology revolution has significantly increased the likelihood of the economy entering a long-term "disinflation" cycle. On a long-term cycle, interest rates have already entered a phase of reduction.
Central bank liquidity is being reinjected into the financial system.
The behavior pattern of capital is "increasing risk appetite."
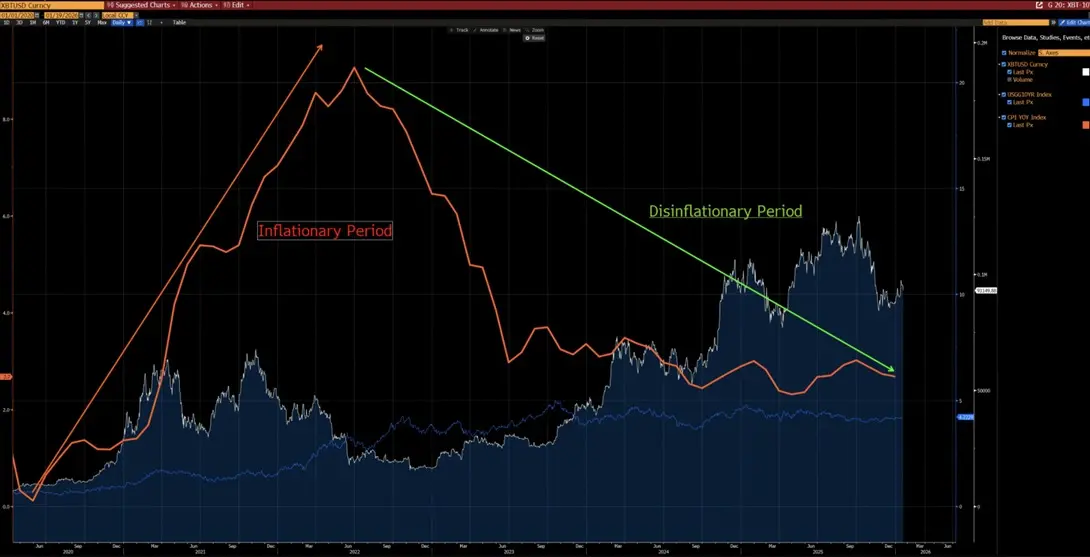
As can be seen from the chart above, since 2020, the year-over-year changes in BTC and CPI have shown a clear correlation.Negative correlation—BTC often declines during inflationary periods but rebounds during disinflationary cycles. Under the AI-driven technological revolution, long-term disinflation is a highly probable scenario—Elon Musk has echoed this view, further supporting our argument.
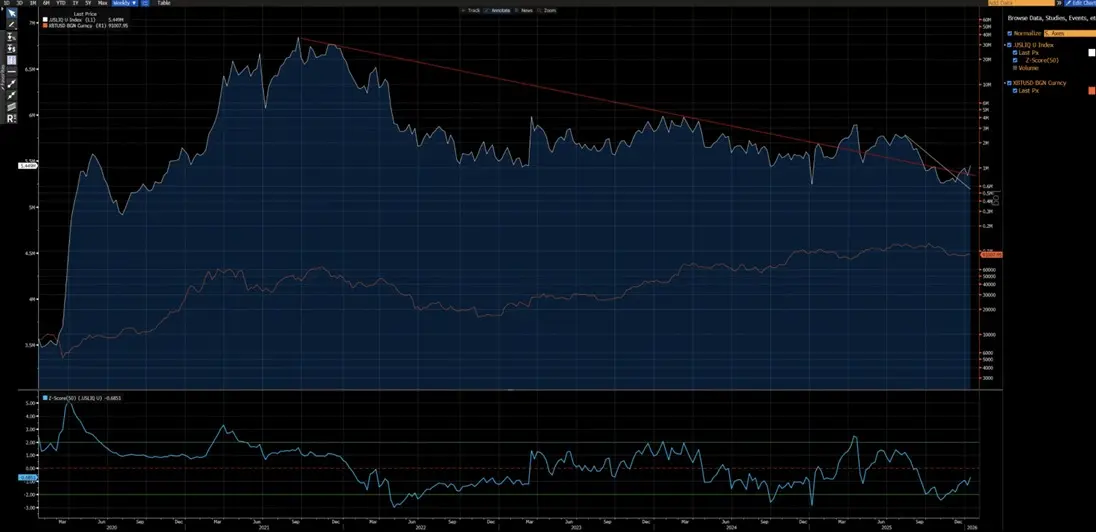
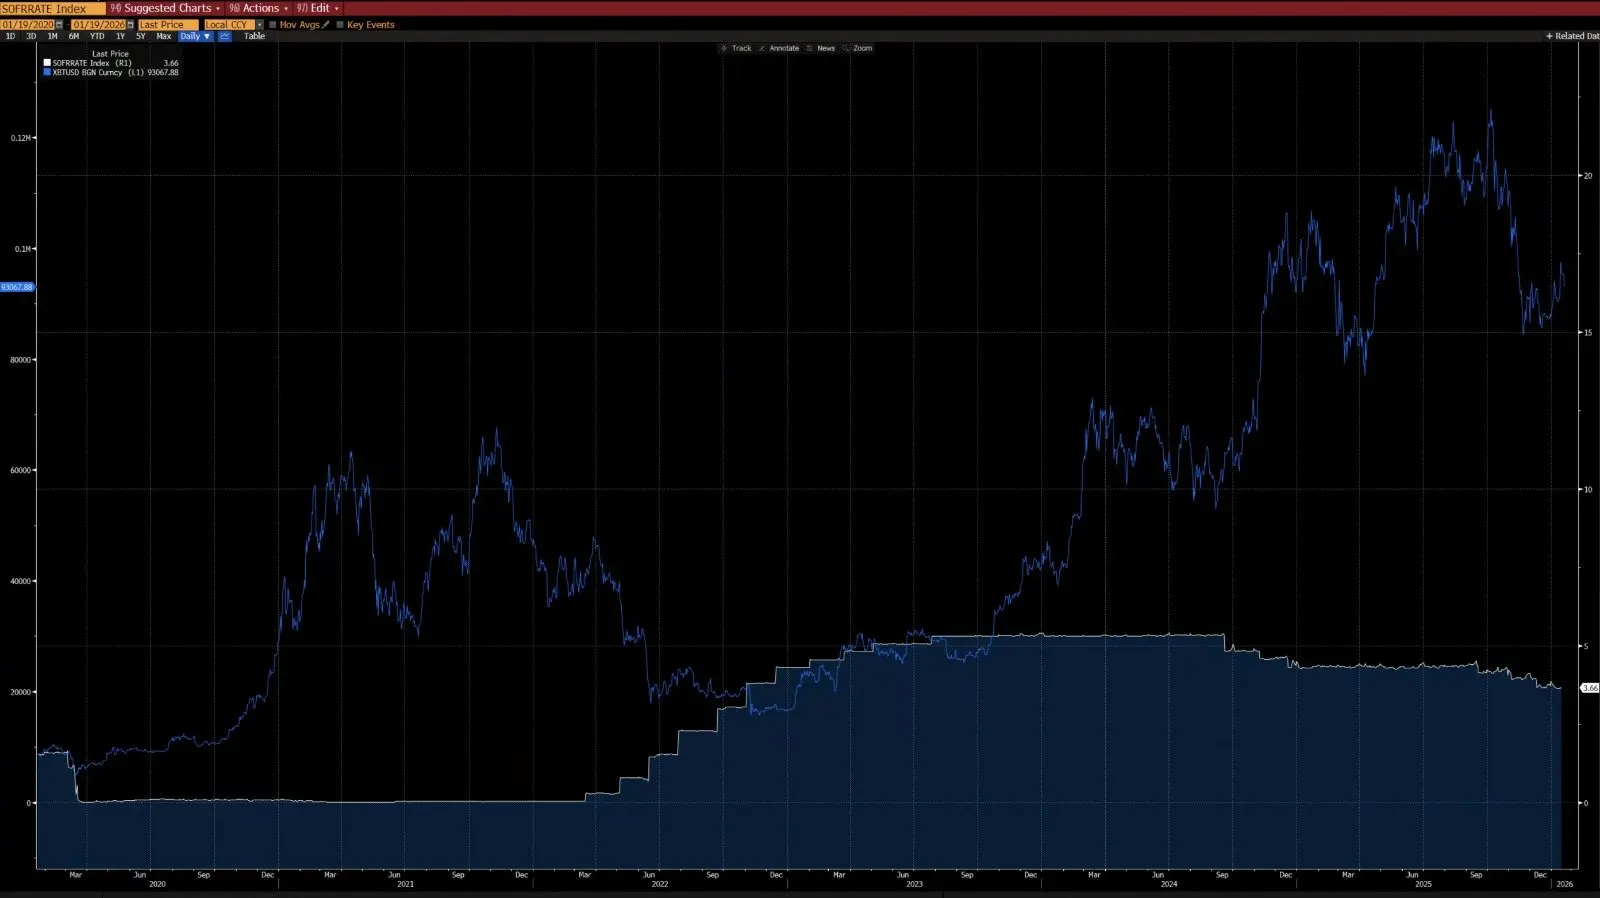
As shown in the chart above, since 2020, BTC has shown a very strong correlation with the U.S. liquidity index (excluding the distortion in 2024 caused by ETF inflows). Currently, the U.S. liquidity index has broken through both its short-term (white) and long-term (red) downward trend lines.A new upward trend is already in sight..
Different technical architectures
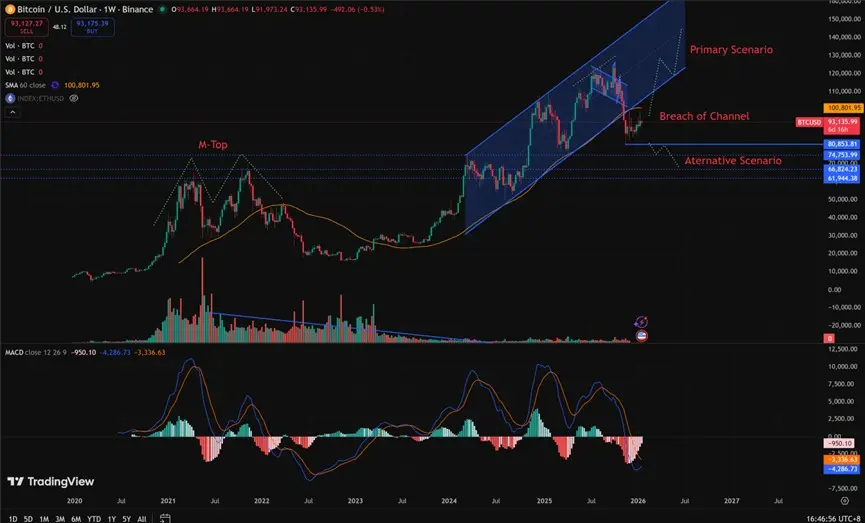
2021–2022: The "M-top" pattern on the weekly chart is a structure typically associated with long-term market tops, which can lead to prolonged price suppression.
2025: The weekly chart has broken below the ascending channel. From a probabilistic perspective, this appears more like a "bear trap" before a potential rebound.
Yes, we cannot completely rule out the possibility that this could evolve into a continuation of the bear market seen in 2022. However, the key is to pay attention to... 80,850 / 62,000 This area has undergone sufficient consolidation and share turnover. This prior digestion of shares provides an excellent risk-reward ratio for the bulls' positioning: The upside potential is significantly greater than the downside risk.
What conditions are needed to replicate the bear market of 2022?
How many must be met?Hard requirements:
- A new round of inflationary shocks, or a major geopolitical crisis of a scale similar to that of 2022.
- The central bank resumes interest rate hikes or balance sheet reduction.
- The price decisively and continuously breaks below 80,850
Asserting a structural bear market before these conditions are met is premature and speculative, rather than based on rational analysis.
Different investors
2020–2022: A retail investor-dominated market with limited participation from institutional investors, especially a lack of long-term配置型资金 (configuration-type funds).
After 2023: The introduction of a BTC ETF brings in structural long-term holders, effectively locking up supply, significantly reducing trading turnover, and substantially lowering volatility.
2023 marks a structural turning point for BTC as an asset in both macro and quantitative terms. The volatility mechanism of BTC has undergone a transformation: from historical... 80–150%Transform into 30–60%, this is a fundamentally different asset behavior pattern.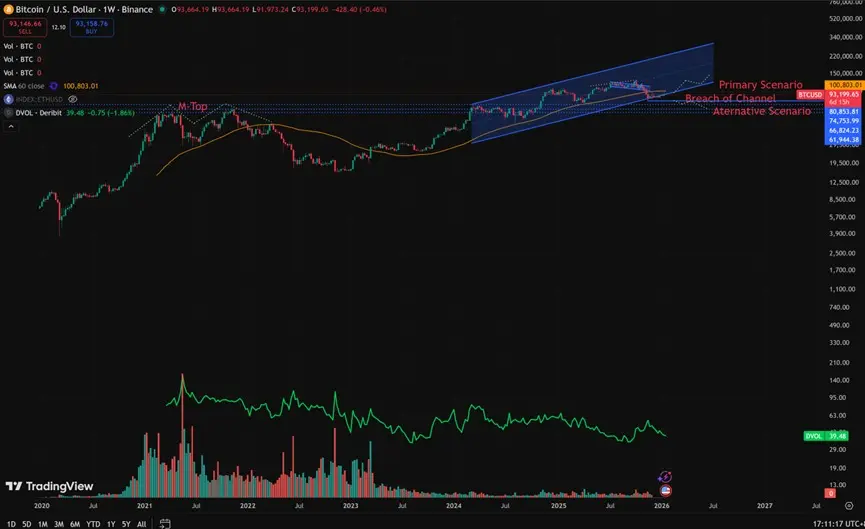
Core Structural Differences
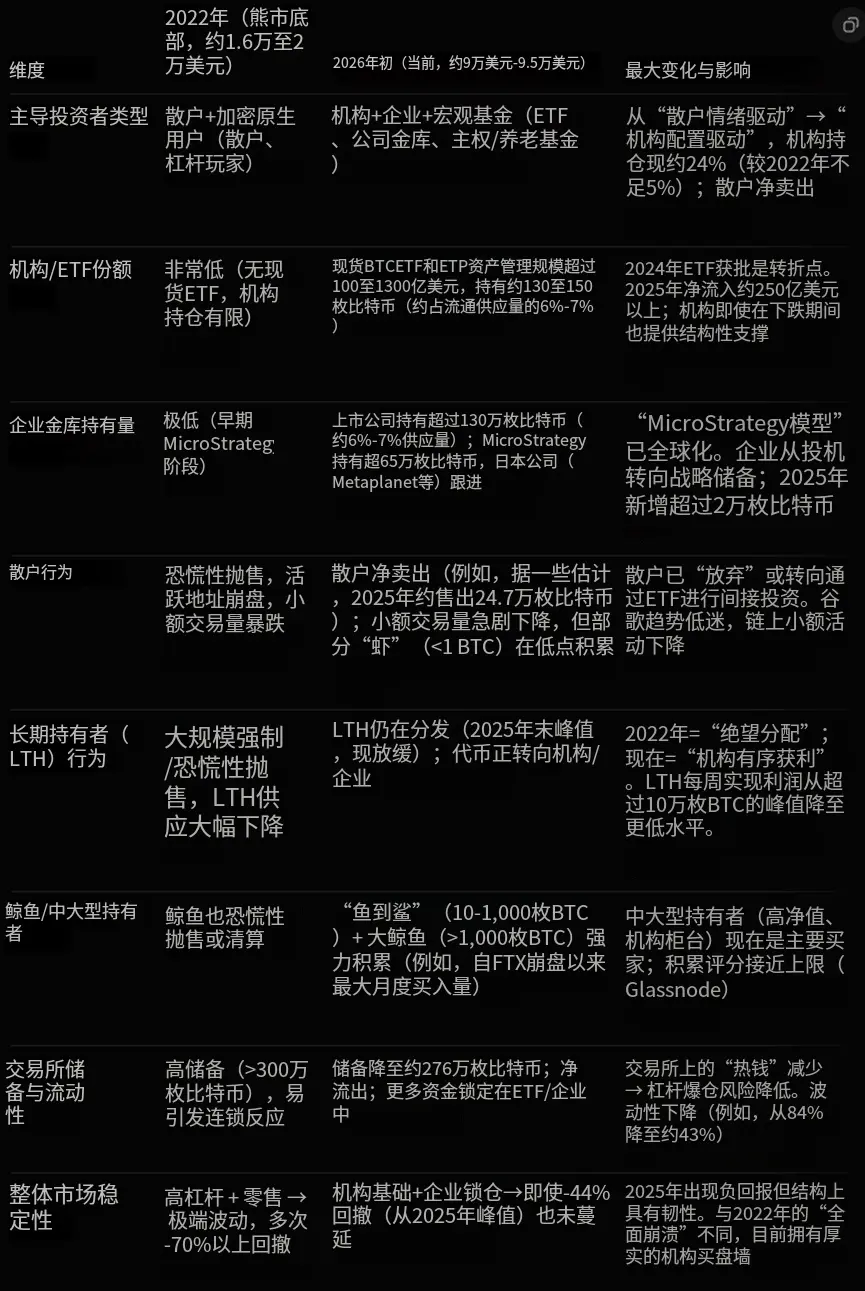
Compared to 2022, the biggest difference in the structure of BTC investors now (early 2026) lies in the following transformation:
From Retail-driven, high leverage speculation
Turn Institution-led, Structural Long-term Holding.
In 2022, BTC experienced a classic "crypto-native bear market," primarily driven by retail panic selling and a chain of leveraged liquidations (defaults). Today, BTC operates in a more mature institutionalized era, characterized by:
Stable underlying demand
Locked supply
Institutional-level volatility
Here is a core comparison by Grok based on on-chain data (e.g., Glassnode, Chainalysis) and institutional reports (e.g., Grayscale, Bitwise, State Street), with data as of mid-January 2026 (BTC price in the range of $90k–$95k):