


In September 2024, the Federal Reserve officially initiated rate cuts. At the time, the median of the dot plot clearly indicated a path to 3.4% by the end of 2025, with four additional cuts.
Six quarters have passed. Last night’s March SEP told us that this line has completely gone off track.
The Federal Reserve kept interest rates unchanged at 3.50%-3.75%, which was no surprise to the market. But what happened inside the dot plot is more worth unpacking than the rate decision itself. Among the 19 members, 7 believed no rate cuts should occur this year, and 7 believed one cut was appropriate—a perfect split. The median remained unchanged, but consensus has fractured.
Using the three images below, let’s briefly understand how the Fed has gradually adjusted its expectations in response to reality, the extent of internal disagreements, and why its inflation forecasts are likely to once again be underestimated.
The collapse of interest rate cut expectations
According to the Fed's official SEP data, at the September 2024 rate cut initiation, the median dot plot forecast for year-end 2025 rates was 3.4%, implying four additional cuts from the then-existing range of 4.75%-5.00%.
In the December SEP three months later, this figure jumped to 3.9%, leaving only two more rate cut possibilities. After four subsequent SEP updates in March, June, September, and December 2025, the year-end forecast never returned to 3.4%. The actual year-end rate for 2025 settled in the range of 3.50%–3.75%, a full 25 basis points higher than initially expected at the start of the easing cycle.
The prediction for 2026 followed the same path. In September 2024, the Fed anticipated that interest rates would fall to 2.9% by the end of 2026. By last night’s March SEP, this figure had stabilized at 3.4%, 50 basis points higher than the initial expectation.
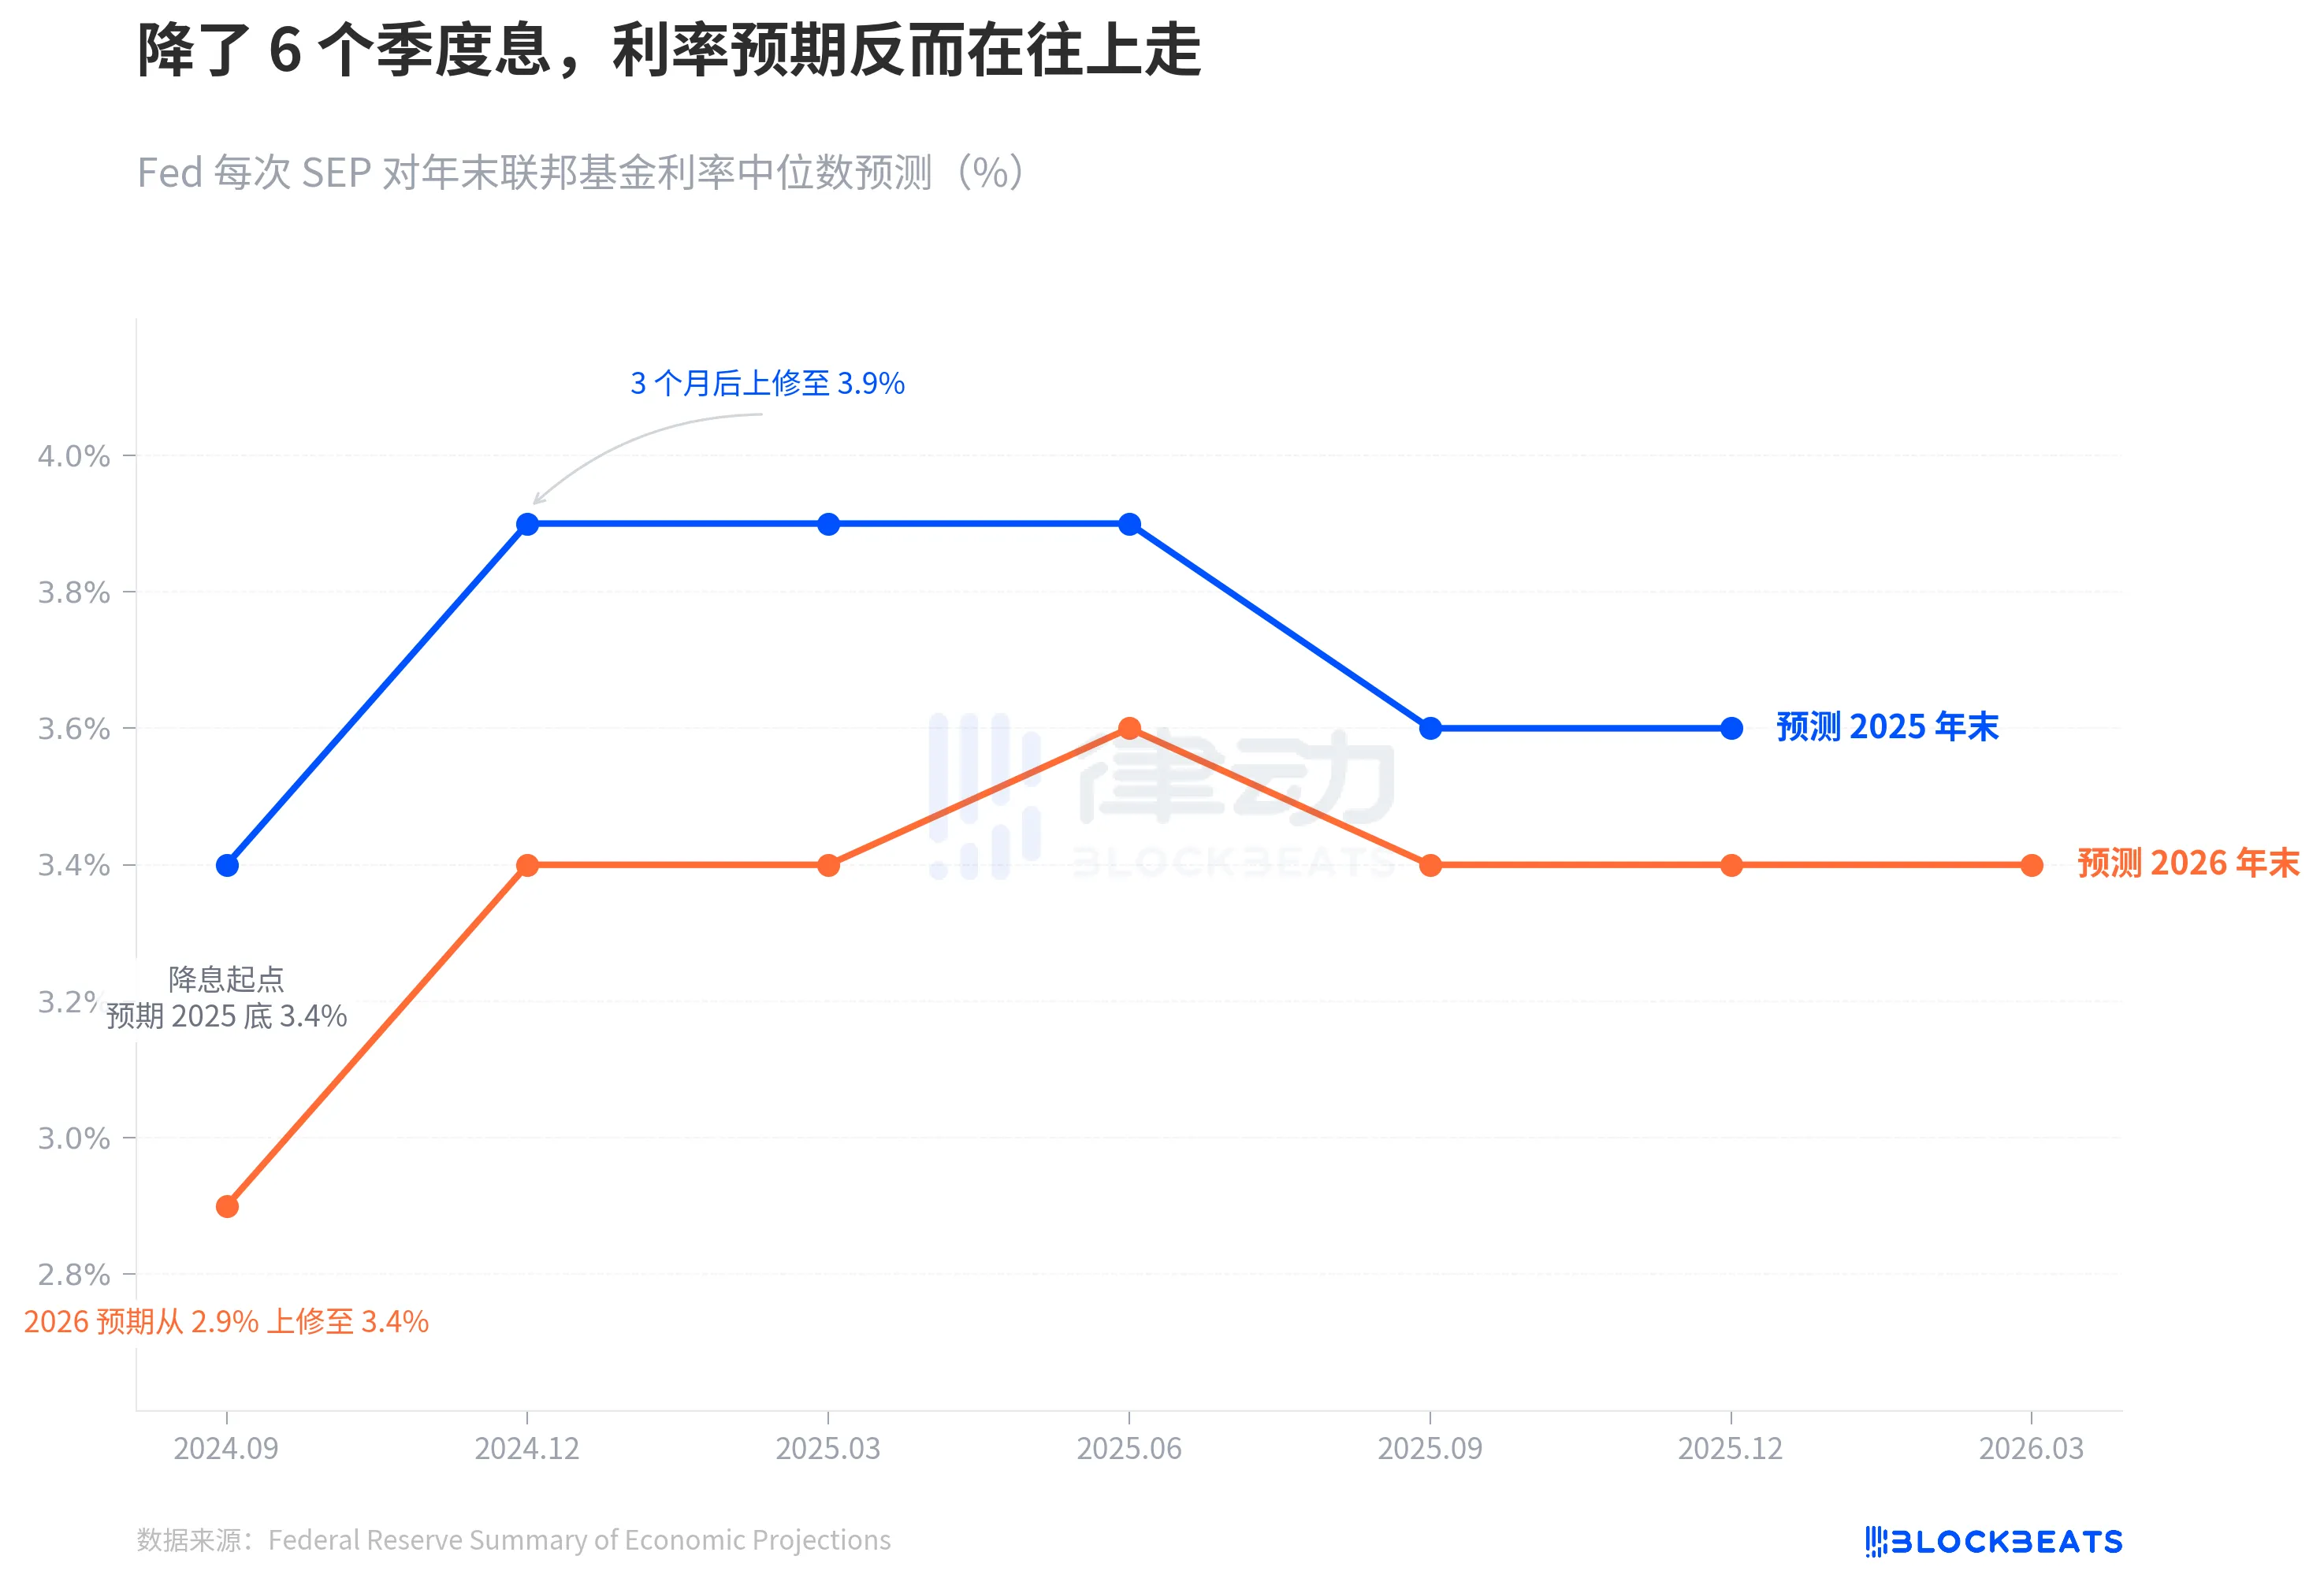
The movement of the blue and orange lines conveys the same message: the rate-cut cycle has indeed begun, but the Fed’s own assessment of the terminal rate continues to rise.
This drift becomes more apparent when viewed over a longer time horizon. In September 2024, the Fed had just lowered rates from their peak of 5.25%-5.50% to 4.75%-5.00%. At the time, market confidence in the path of rate cuts was strong—the CME FedWatch tool once implied a 4-5 cut probability for 2025. But the Fed’s own projections quickly diverged—in December, it slashed half of the expected easing space, with the blue line jumping from 3.4% to 3.9%, a single-quarter move of 50 basis points. Since then, regardless of economic data fluctuations, that line has never returned.
In other words, just three months into the interest rate cut cycle, the dot plot has already begun to slow down the path of rate cuts.
7:7, the Fed is unclear on its direction
The median is a number that obscures the division behind the numbers.
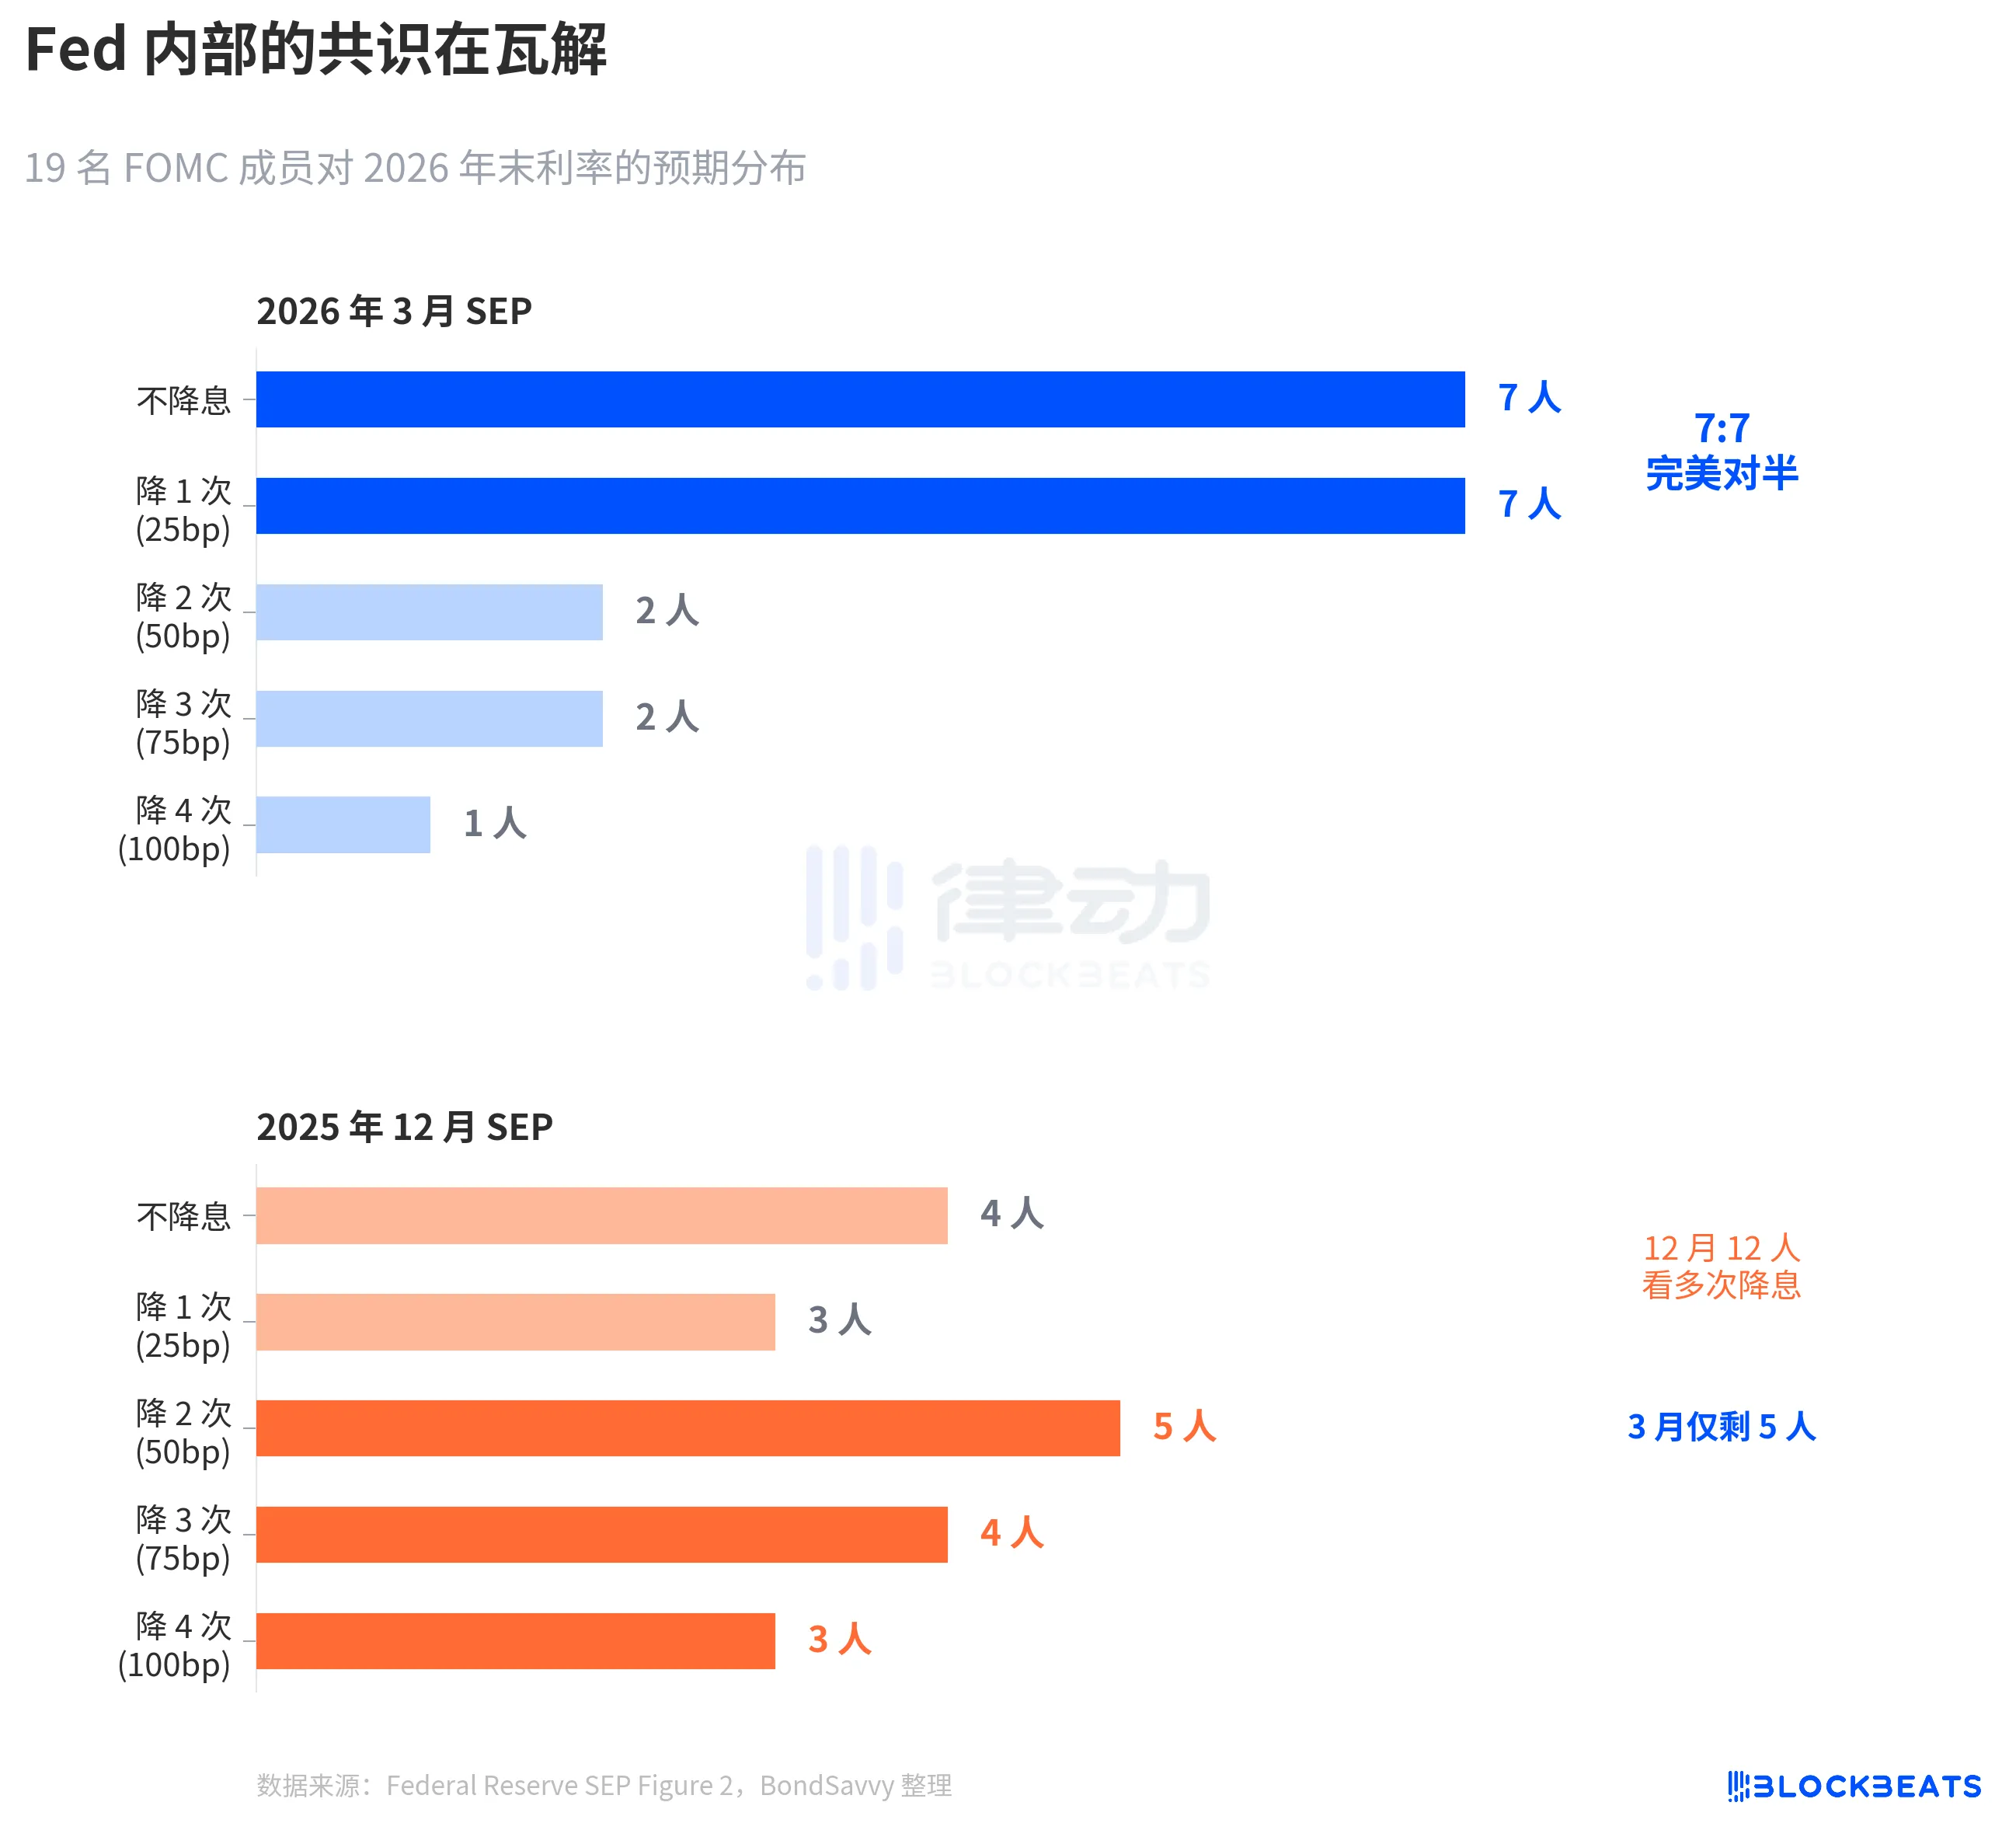
According to the Fed’s March SEP Figure 2 dot plot (compiled by BondSavvy), among the 19 participants, the distribution of votes for the interest rate at the end of 2026 is as follows: 7 voted for no cuts, 7 voted for one cut, 2 voted for two cuts, 2 voted for three cuts, and 1 voted for four cuts.
7:7, a perfect split. Fourteen people concentrated on "hold" and "cut once," while only five expected more than one rate cut.
Compared to the SEP in December 2025, the shift has been dramatic. In December, 12 participants expected two or more rate cuts; by March, only five did. Powell also confirmed this shift during the press conference: “Four to five people changed their expectation from two cuts to one cut.”
This symmetric split is extremely rare in FOMC history. According to a 2023 study by the San Francisco Fed (Bundick & Smith), internal dissent in the dot plot was nearly zero during the 2020 pandemic, then gradually increased with the rate-hiking cycle. However, past disagreements were primarily about “magnitude”—whether to hike by 25 or 50 basis points—with consensus on direction. The March 2026 dissent is about “direction”—whether to cut at all.
The median remains at 3.4%, but beneath this 3.4%, two groups are pulling in opposite directions.
More notably, the way the distribution has narrowed is concerning. In December, the dot plot was widely dispersed, with participants ranging from significant rate cuts to holding rates steady. In March, the distribution narrowed instead—14 dots squeezed between two tiers—but this was not a convergence of consensus; rather, two opposing camps each consolidated internally. Dispersed uncertainty became concentrated disagreement. This is more dangerous than dispersion, because any unexpected inflation data could cause one group to shift en masse, triggering a jump in the median.
The Fed always underestimates inflation.
The root of the interest rate debate is the inflation debate.
According to the Fed’s various SEP data, in December 2024, the Fed provided its first PCE inflation forecast for 2026: 2.1%. Since then, the forecast has been revised upward each quarter: 2.2% in March 2025, 2.4% in June, and 2.6% in September. It briefly dipped to 2.4% in December, then rose again to 2.7% in March 2026. Over six quarters, the cumulative upward revision amounted to 0.6 percentage points.
This pattern is not unprecedented. In 2025, PCE inflation followed exactly the same path. In December 2024, the Fed forecasted 2025 PCE at 2.5%, then gradually revised it upward quarter by quarter to 2.7%, 3.0%, 3.0%, and 2.9%. According to data from the U.S. Bureau of Economic Analysis (BEA), the actual year-over-year PCE in December 2025 was 2.9%. The Fed spent the entire year playing catch-up, finally matching the figure in the final estimate.
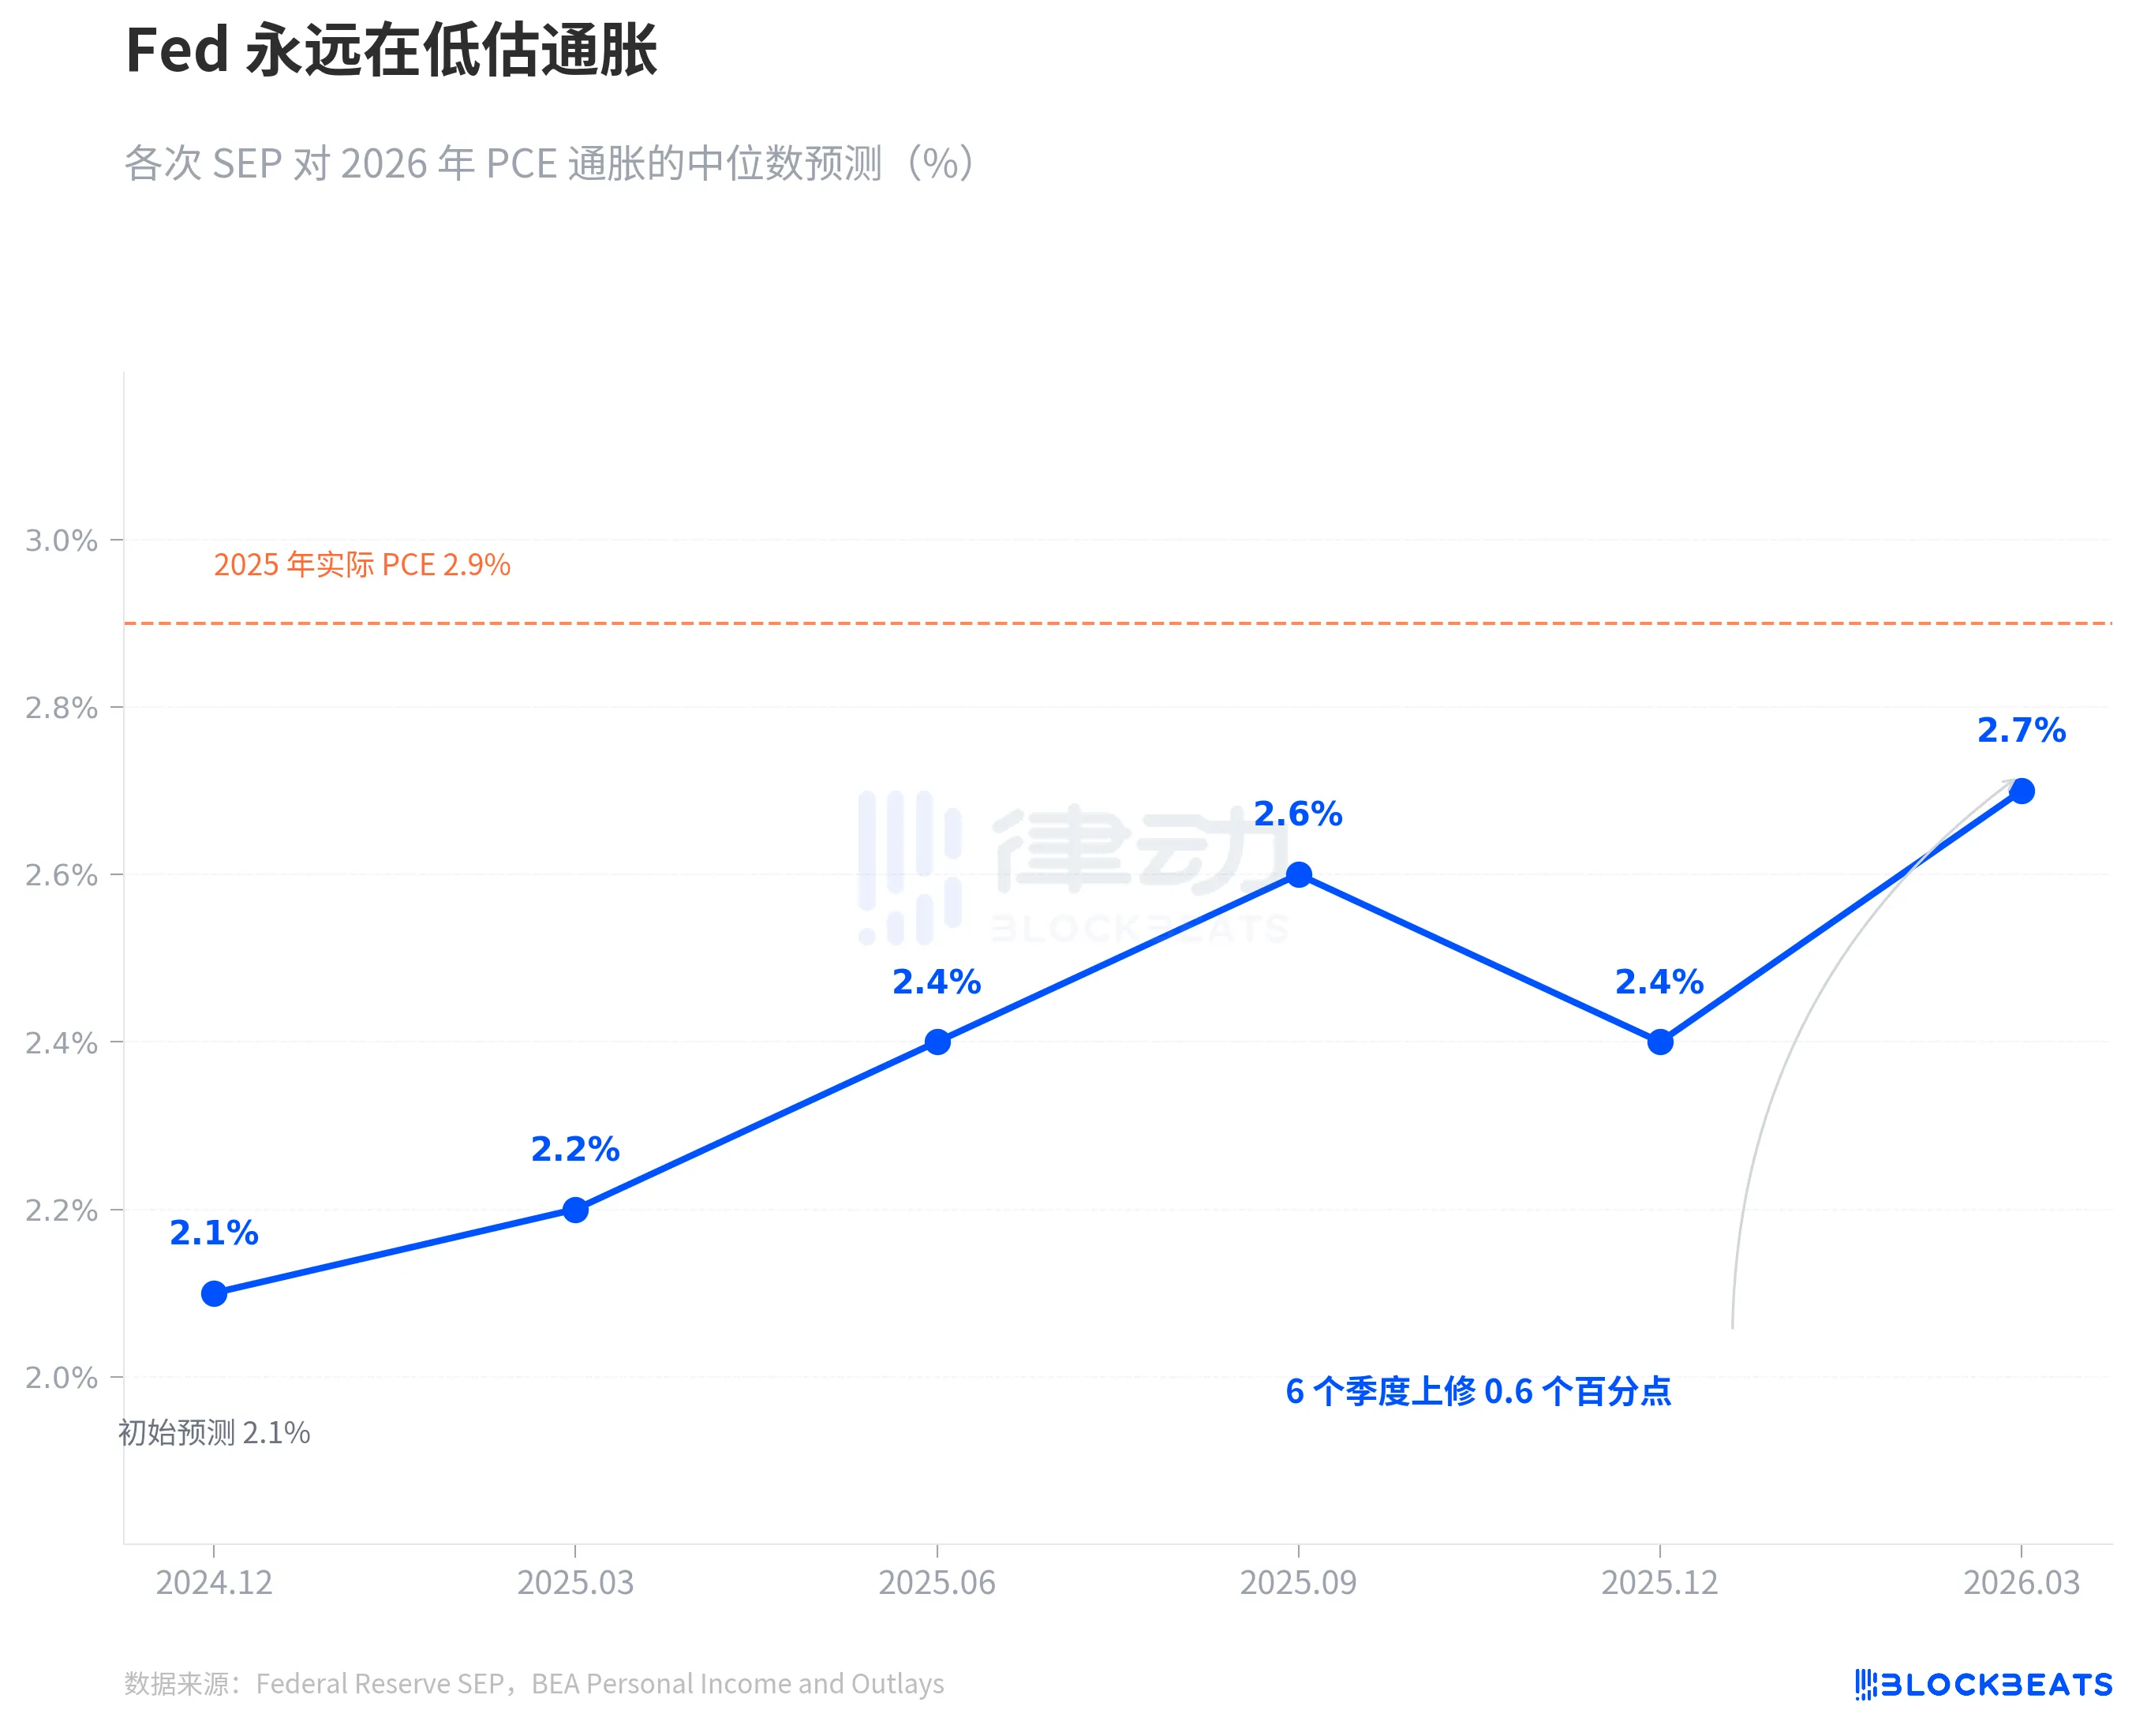
The Fed now says PCE will be 2.7% in 2026. The orange dashed line on the chart shows the actual 2025 value at 2.9%. Based on their own historical record, 2.7% is most likely just a starting point, not the end. It’s not a conspiracy—it’s a pattern. Over the past two years, the Fed’s real-time inflation forecasts have moved in only one direction—upward.
Particularly noteworthy is the core PCE. The March SEP raised the 2026 core PCE forecast from 2.5% in December to 2.7%, an upward revision of 0.2 percentage points for the quarter—the largest adjustment among all indicators. Core PCE excludes volatile food and energy prices and is regarded by the Federal Reserve as a more reliable inflation indicator. When this metric is revised upward, it suggests the issue is not merely oil price fluctuations, but rather stronger-than-expected underlying inflationary pressures.
In the same March SEP, GDP forecasts rose slightly from 2.3% in December to 2.4%, while the unemployment rate remained unchanged at 4.4%. The economy improved slightly, inflation proved more persistent, but the interest rate path stayed the same.
There is tension among these three judgments. If inflation proves more persistent than expected, why should the interest rate path remain unchanged? The 7-7 split provides the answer—it’s not that the Fed believes rates don’t need to change, but rather that there is itself a division within the Fed regarding the trajectory of inflation.
According to CME FedWatch data, the market is currently pricing in for the full year of 2026: a 32.5% probability of two 50-basis-point cuts, a 25.9% probability of three 75-basis-point cuts, and a 21.1% probability of only one cut. The market-weighted expectation is approximately 50 basis points, more dovish than the Fed’s median forecast of 25 basis points. However, the divergence between the most probable scenario and the Fed’s median forecast mirrors the 7:7 split within the Fed itself.
No one knows the answer. Not even the Federal Reserve itself.
Click to learn about the open positions at BlockBeats
Welcome to the official BlockBeats community:
Telegram subscription group: https://t.me/theblockbeats
Telegram group: https://t.me/BlockBeats_App
Official Twitter account: https://twitter.com/BlockBeatsAsia