


Key Insights:
- Ethereum price targets $4,867 if bullish breakout confirms above resistance
- ETH price structure supports long-term $30,000 cycle target projection
- Price momentum strengthens as buyers hold key support levels
Ethereum price continues to tighten within a critical technical range. Analysts now see rising breakout pressure across several higher timeframes. This structure implies that a decisive move may be imminent.
Ethereum Price Holds Key Levels As Breakout Pressure Builds
Ethereum price continues to be supported above short-term moving averages. The market structure has shown consistently lower lows since the November rebound. This behavior represented increasing buyer confidence across spot markets.
Michael van de Poppe had noted Ethereum’s bounce from an ideal accumulation zone. He said ETH price had been in an uptrend since late April. He also showed the importance of sustained trading above the 21-day moving average. This level often defines short-term trend strength. Holding above it usually supports continuation setups.
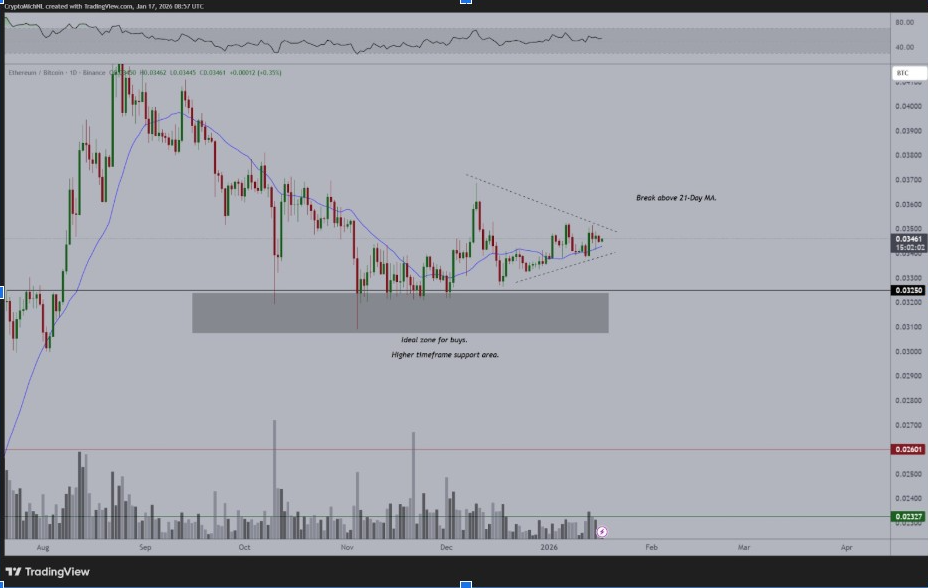
Compression patterns now control Ethereum’s chart structure. Such formations are often followed by expansions in volatility. Traders keep a close watch out for these zones. Breakouts off compression ranges tend to be attractive to momentum capital. Ethereum price is now trading within one such tightening structure.
Volume behavior also provides evidence that supports this view. Buying activity increased during consolidation. Sellers are less aggressive in pullbacks. This imbalance is favorable to upside continuation pressure.
Resistance Zones Define ETH Near-Term Market Direction
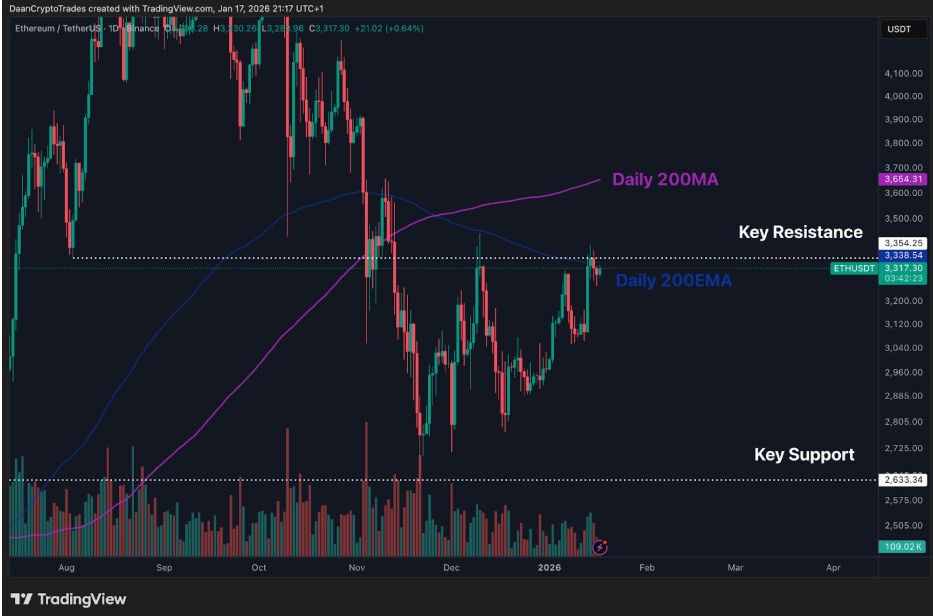
Ethereum price is still testing a strong level of resistance around $3,350. This level is one of the key technical barriers. Market participants monitor the daily closes around this region.
Daan Crypto Trades highlighted $3,350 as the key breakout level. He said that a clean close above this level could open higher targets. He also strongly emphasized interaction with the daily 200 EMA and 200 MA. These moving averages often behave as a dynamic resistance.
Ted Pillows added that Ethereum still has the support zone of over $3,300. He explained how regaining $3,400 could spell an enhanced uptrend phase. However, he said there was downside risk if resistance holds. Failure could see Ethereum price head for the $3,200 region.
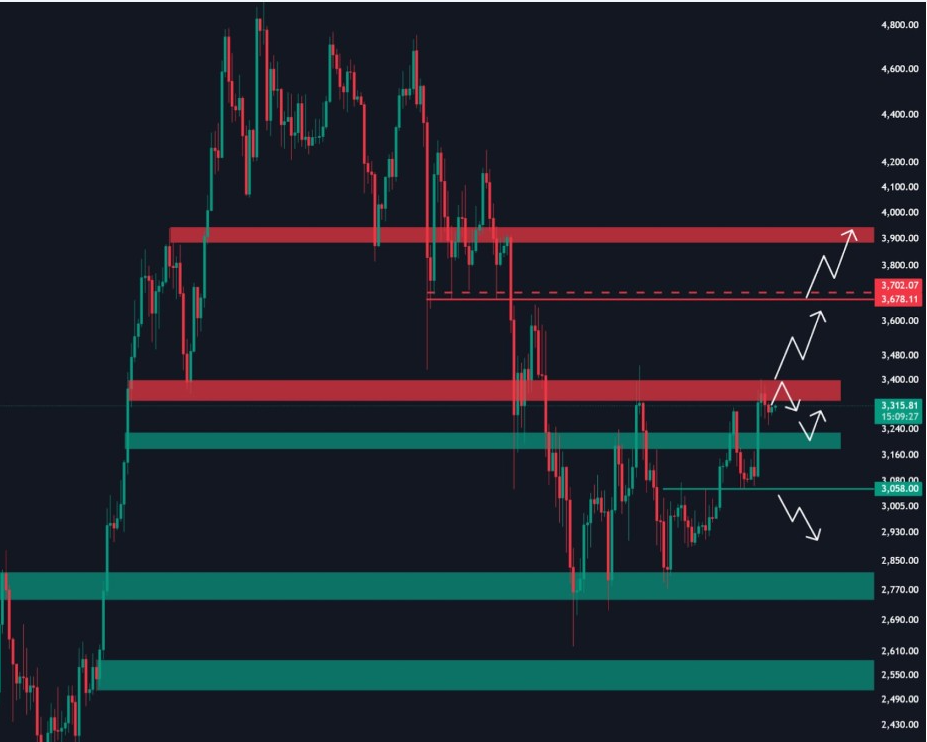
Despite attempts at rejection, price action is still constructive. Ethereum price is still creating higher intraday lows. Buyers defend dips near support zones repeatedly.
Long-Term Channel Structures Support Long Upside Projections
Ethereum’s price also trades within a multi-year ascending channel. Long-term technical frameworks indicate potential for continued upside. Historical cycles revealed similar channel behavior before the major expansions.
Crypto Patel shared a long-term ascending channel on Ethereum’s weekly chart. He projected a potential long-term target of $30,000 by 2028. This projection uses channel expansions and Fibonacci retracements.
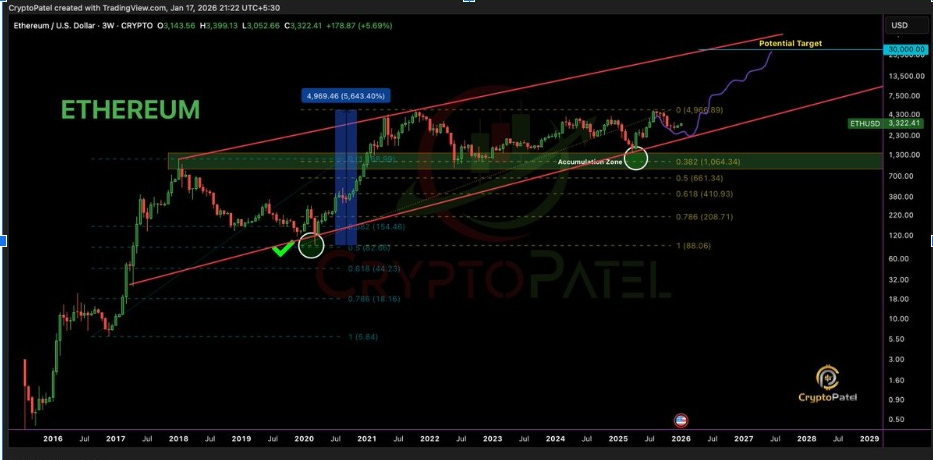
The chart also showed long zones of accumulation. Ethereum consolidated in these ranges for long periods. These zones typically provide powerful structural foundations. Breakouts from such bases often support multi-year rallies.
Historical price behavior supports this interpretation. Each major Ethereum expansion followed extended consolidation phases. The current structure mirrors these earlier patterns.
Pattern Structures Signal Potential Upside Continuation
Ethereum price is also showing bullish reversal structures on higher timeframes. Growing upside momentum potential based on pattern analysis. Weekly charts are now showing improving technical alignment.
Donald Dean identified an inverse head and shoulders formation on Ethereum’s weekly chart. This pattern is often an indication of trend reversals. He pointed out the 0.618 Fibonacci retracement level as a breakout trigger. According to his analysis, ETH could go for the $4,867 zone.
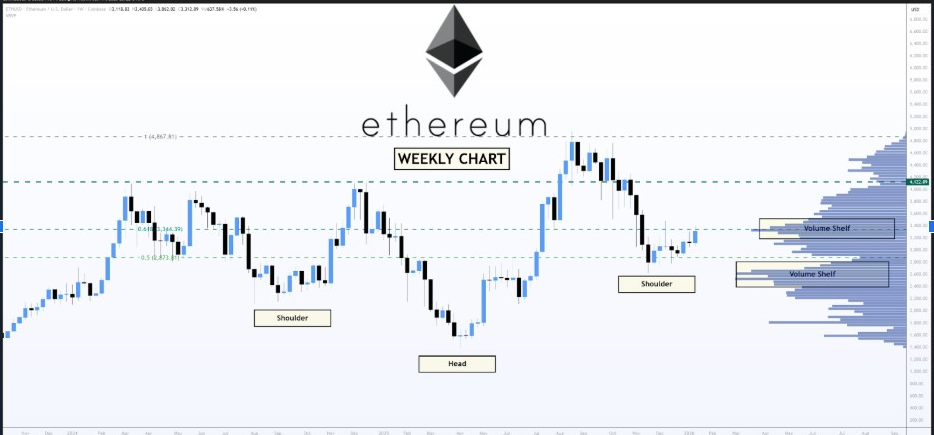
Volume profile data also supports this scenario. Large volume shelves are below current price levels. The neckline area continues to be the critical confirmation area. A sustained breakout would confirm the bullish pattern. Traders now closely monitor the weekly closes. Ethereum price is still gaining structural strength as markets await confirmation.
The post Ethereum Price May Surge Toward $4,800 If $3,350 Resistance Breaks appeared first on The Market Periodical.