


Key Insights
- Ethereum price has rebounded in the past few days.
- The weekly chart shows that it has formed an inverse head-and-shoulders pattern.
- ETF inflows and the number of transactions are rising.
Ethereum price continued its recent rally, reaching its highest level since December as the crypto market recovery accelerated. ETH was trading at $3,345, and its technicals and strong fundamentals suggest that it has more room to run, potentially to the psychological point at $5,000.
Ethereum Price Prediction: Weekly Chart Points to More Gains
The weekly chart shows that Ethereum price has bounced back after falling to the key support level at $2,661 in November last year. This price was notable as it coincided with the Major S&R Pivot Point of the Murrey Math Lines tool.
A closer look shows the coin has been forming an inverse head-and-shoulders pattern, a common bullish reversal pattern. Its head was at $1,350, its lowest level in April last year. It has already completed the formation of the two shoulders and is now aiming to retest the neckline zone.
Therefore, this pattern suggests that Ethereum has more upside as long as it remains above the Major S&R Pivot Point of the Murrey Math Lines tool. If this happens, the initial target level to watch will be the psychological point at $4,000.
A move above that level will point to more gains, potentially to the all-time high of $4,965, followed by $5,000, which is also the Ultimate resistance of the Murrey Math Lines tool.
Crossing that level will signal further gains in the coming months, with the next key level being the extreme overshoot point at $6,250.
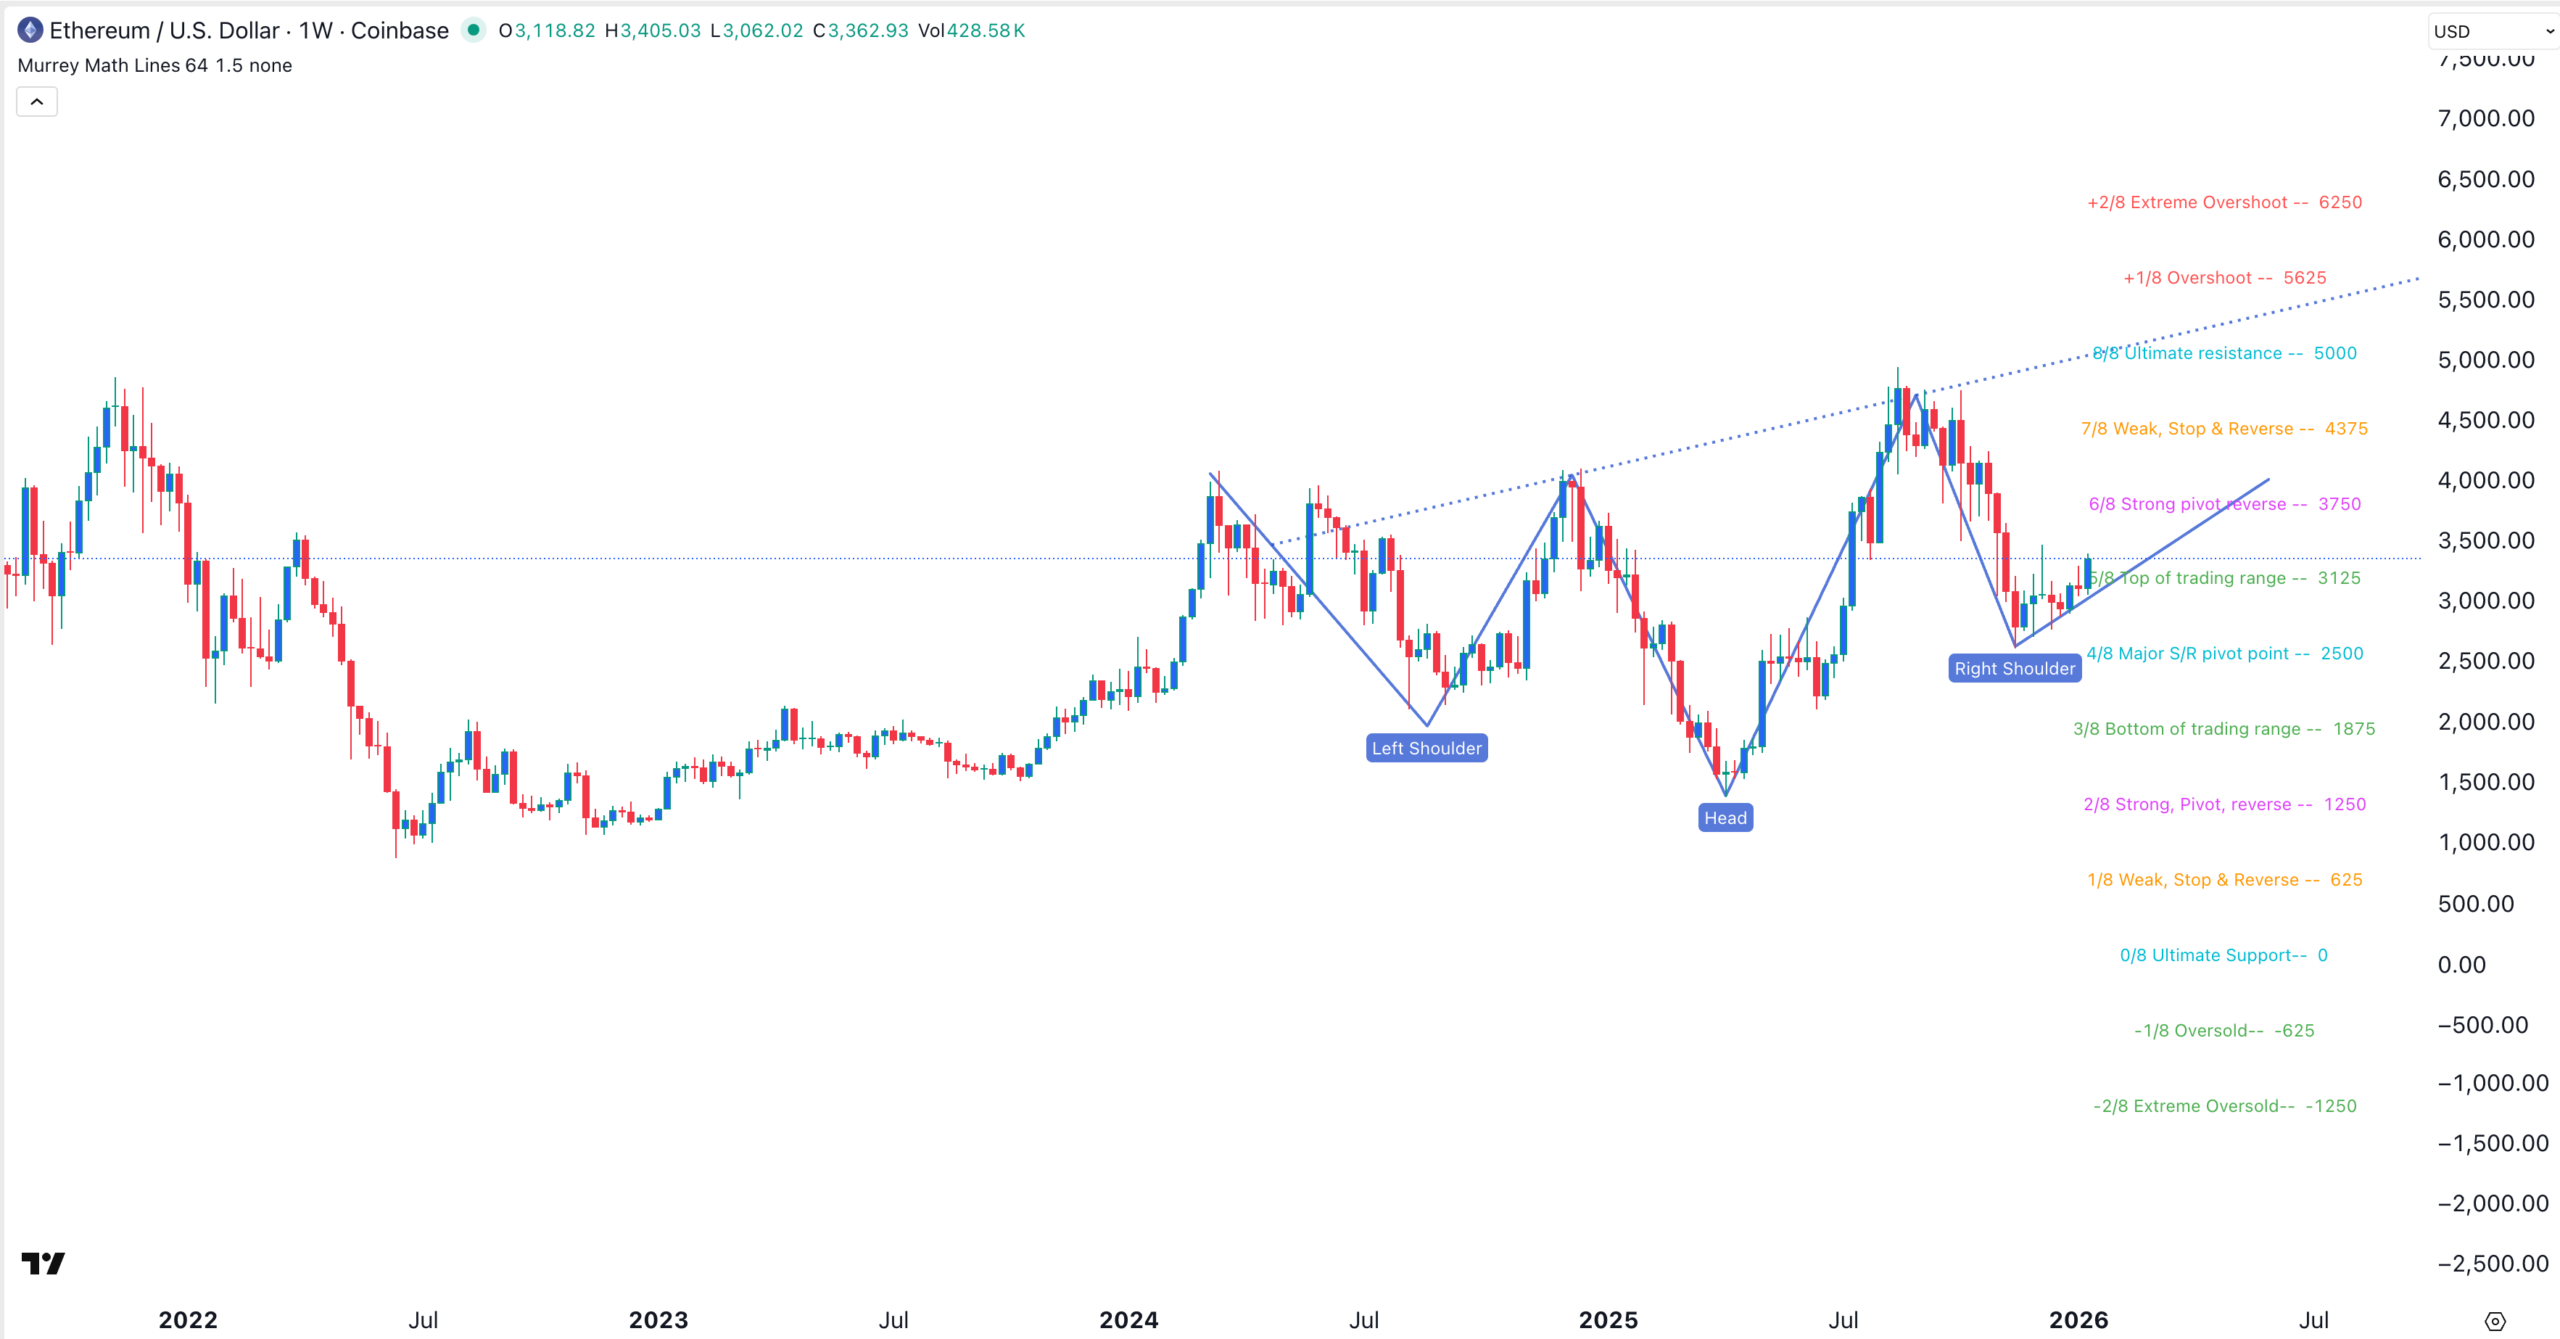
Ethereum price chart | Source: TradingView
Ethereum Transactions and Users are Soaring
One major catalyst for Ethereum price is that its network metrics have surged after the recent Fusaka upgrade, which happened in December last year.
Data compiled by Nansen and Santimet shows that activity has soared, with the number of users and being in a strong uptrend. Active addresses on Ethereum rose to a record high of 17.16 million in December last year. They have jumped to 11 million this month, a sign that the final figure will be higher.
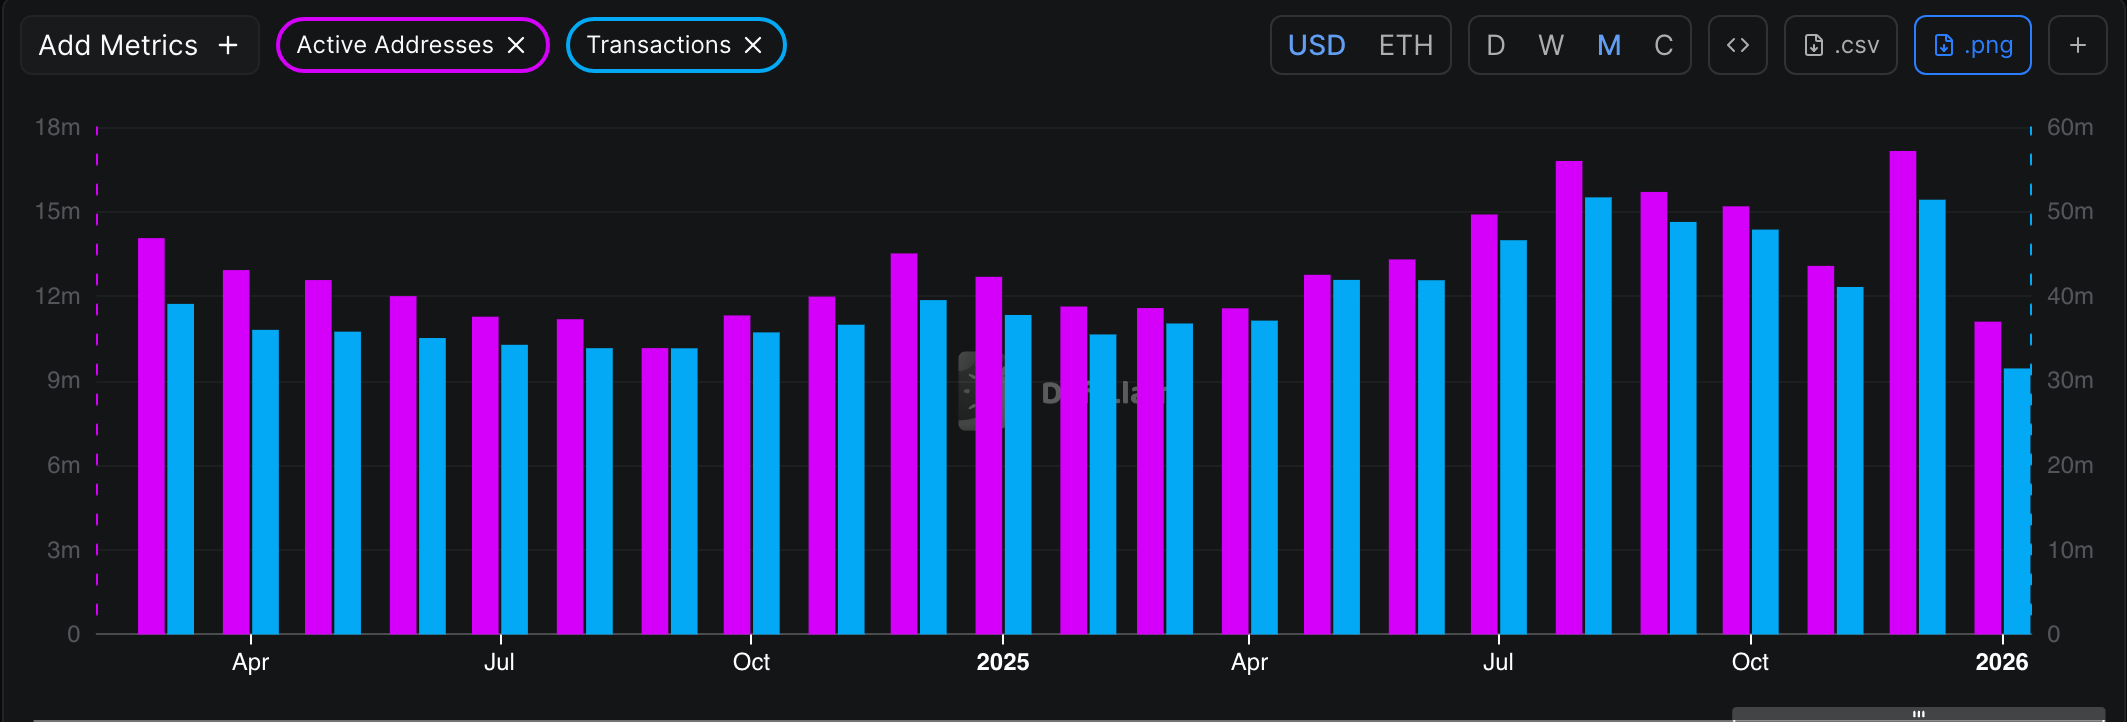
Ethereum active addresses and transactions | Source: DeFi Llama
More data shows that the number of transactions in the network are soaring. They jumped to over 51 million in December and are already up 32 million this month. This growth is largely driven by ongoing demand for products on Ethereum’s network.
For example, stablecoin transactions on the network have remained elevated over the past few months. The network has a stablecoin supply of $170 billion. It handled 50 million transactions worth over $972 billion in the last 30 days.
In contrast, Solana, its biggest competitor, has $14.1 billion in stablecoin supply and handled over $236 billion in stablecoin transactions.
More data shows that Ethereum is the most dominant player in the Real-World Asset (RWA) tokenization industry, which has continued growing. Its dominance in this industry has jumped to over 60%.
Spot Ethereum ETF Demand is Rising
Meanwhile, data shows that American investors are starting to buy spot Ethereum ETFs. Data shows that these investors have acquired $415 million in Ethereum tokens this year, with BlackRock’s ETHA holding the largest market share.
ETH ETF accumulation | Source: SoSoValue
At the same time, BitMine has continued to buy ETH and now holds over 4.1 million tokens. It has more room to buy as its goal is to buy 6 million coins. Also, the company will likely execute more purchases if its shareholders approve increasing the number of shares from 500 million to 50 billion.
All this accumulation is happening at a time when concerns are rising that supply is fading. Data shows that the supply of Ethereum on exchanges has continued to fall over the past few months and is now at its lowest level in years. As such, falling supply and rising demand means that the token will keep rising.
The post Ethereum Price Rare Pattern Points to a Surge to $5k as Catalysts Mount appeared first on The Market Periodical.