


Ethereum is trading close to $2.1k to close out Q1 2026, and the picture remains largely unchanged from recent weeks. It’s a market that has lost more than half its value from the late-2025 highs and is struggling to build any conviction on the recovery. With macro headwinds persisting and altcoins broadly underperforming, ETH continues to face an uphill battle heading into the new quarter.
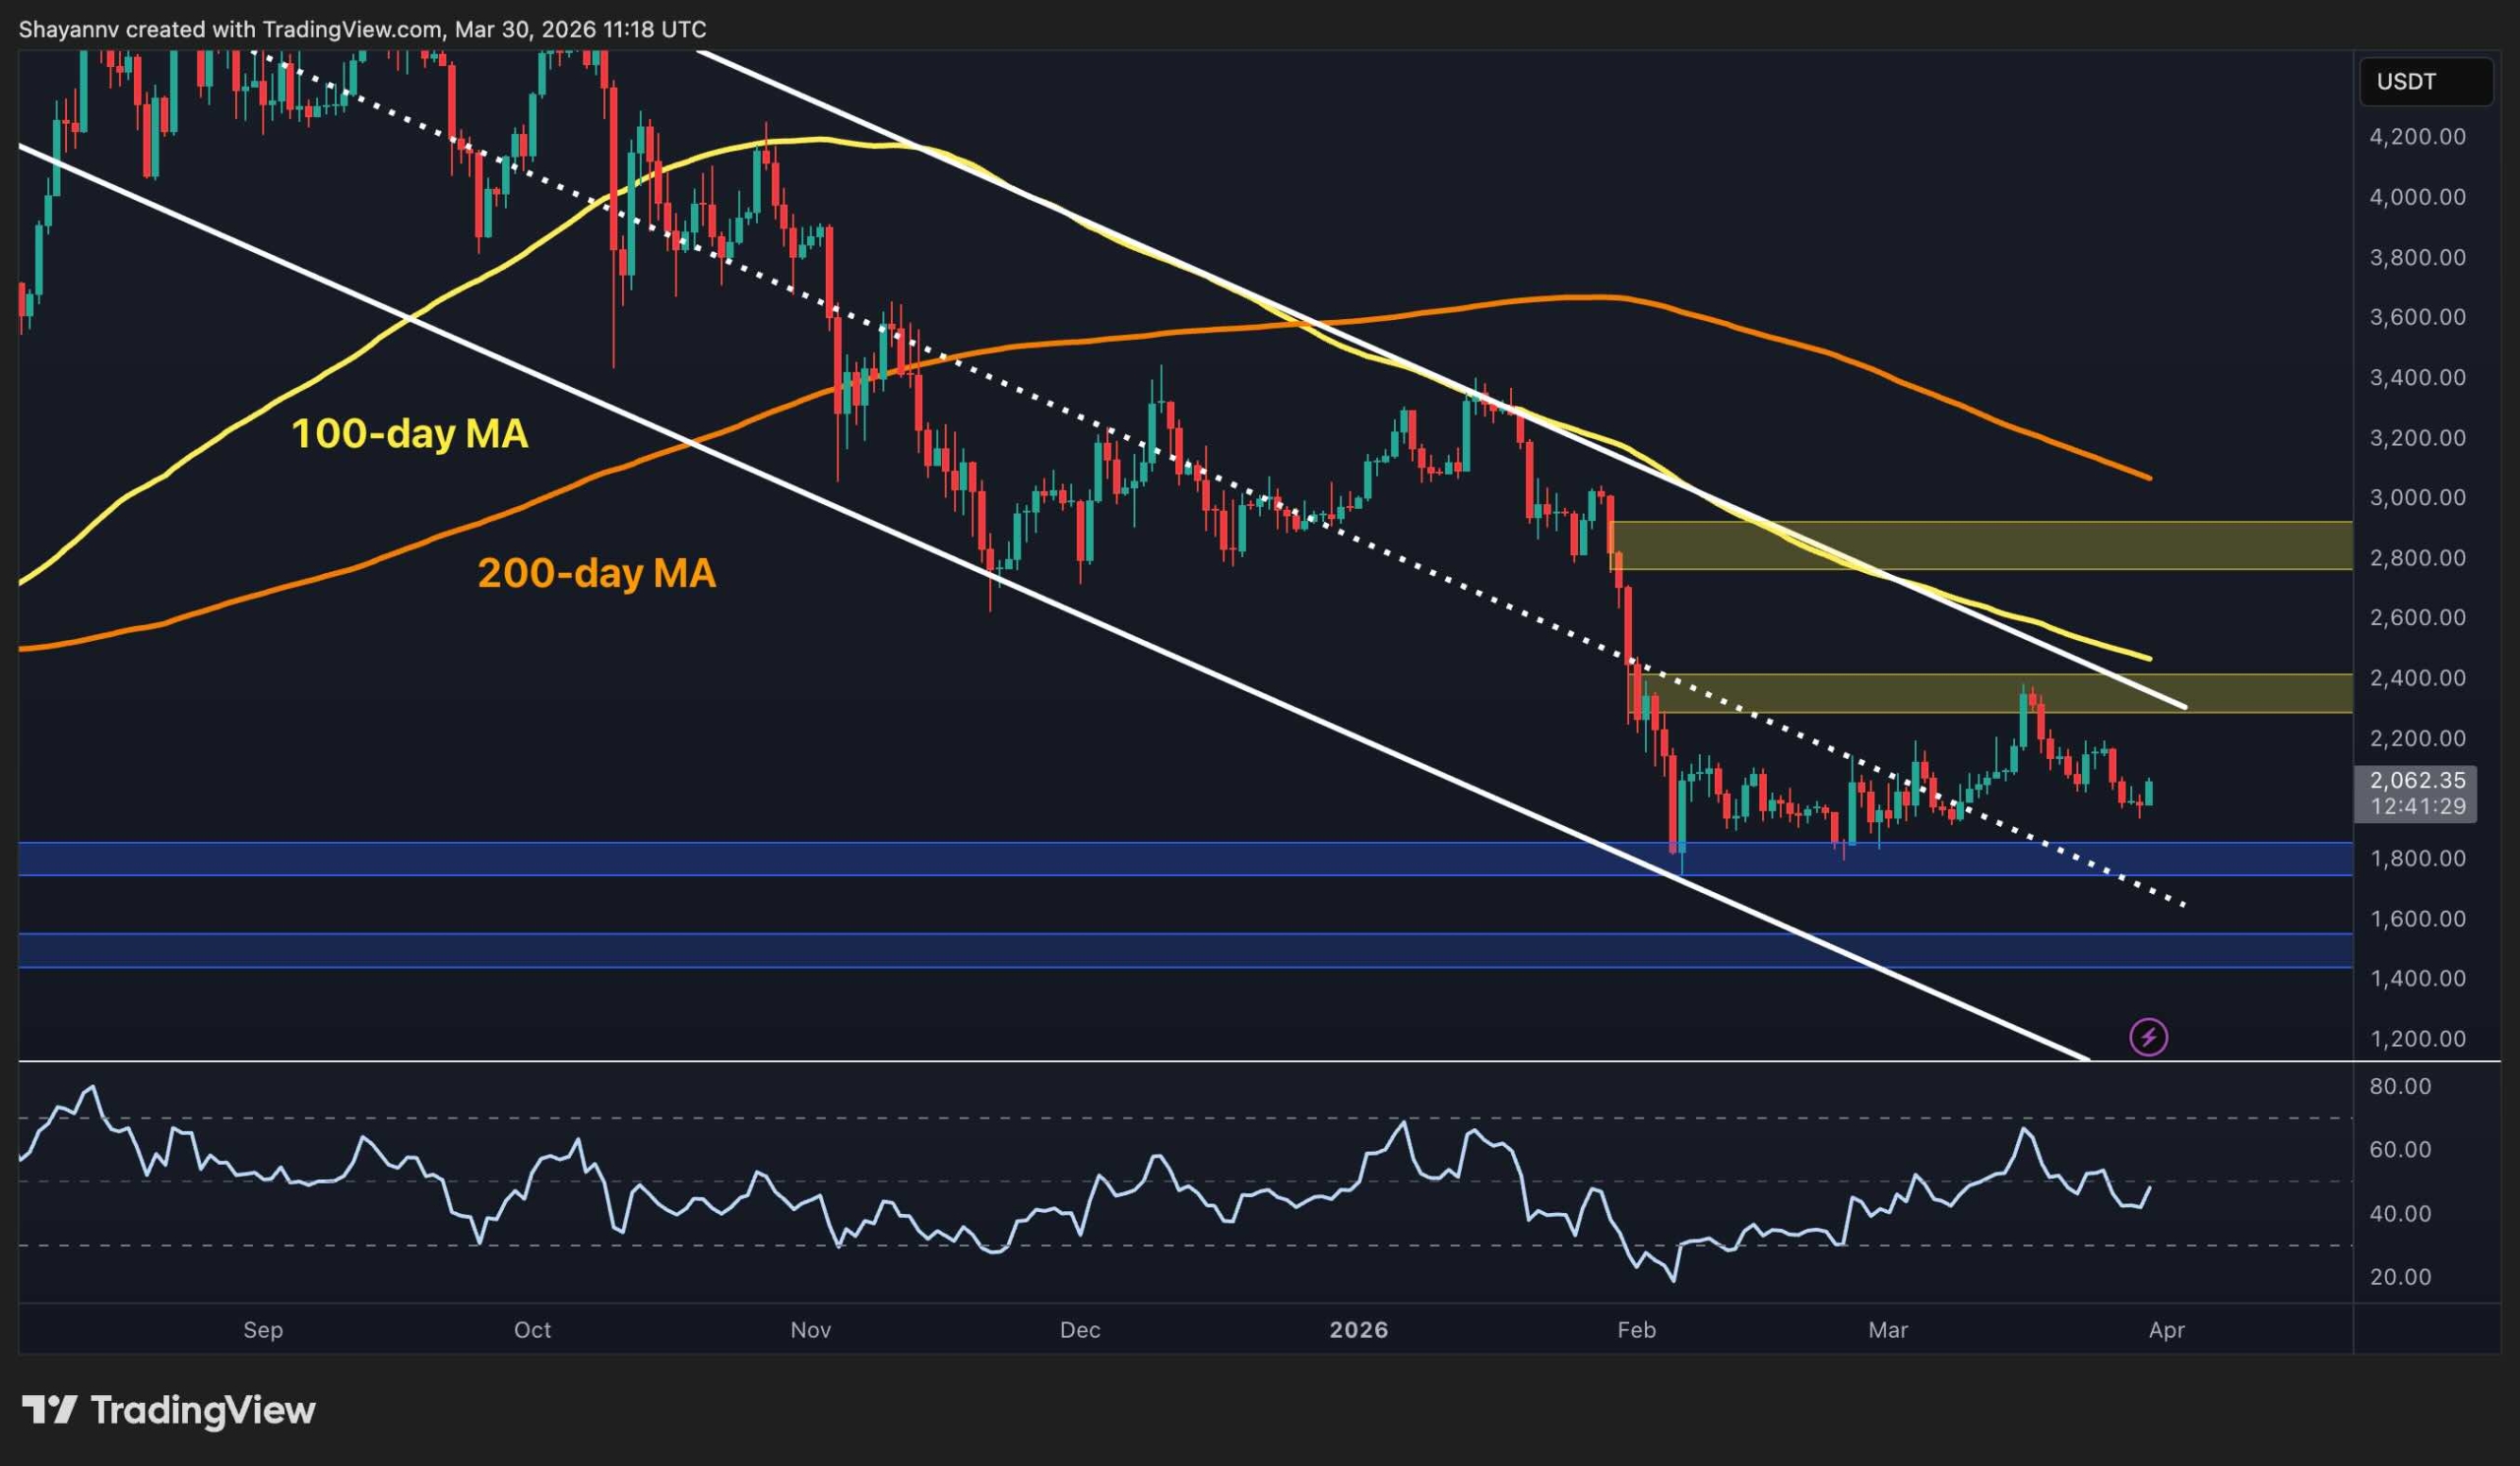
Ethereum Price Analysis: The Daily Chart
The descending channel that has defined ETH’s price action since late 2025 remains fully intact on the daily chart. Both the 100-day moving average (~$2.4k) and the 200-day moving average (~$3k) are declining and sitting well above the current price. They form a compressing wall of resistance that has rejected every meaningful recovery attempt since December last year.
The $2.3k–$2.4k supply zone has proven particularly stubborn, as the price pushed into it in mid-March but was rejected sharply. The $1.8k support level also held earlier during the February capitulation wick and remains the key line in the sand to the downside. The $1.6k and $1.4k levels are the next areas of consequence if the $1.8k support zone breaks.
Moreover, the RSI has recovered from its February lows near 20 and is now hovering around the mid-40s. This indicates some stabilization but no clear directional momentum yet.
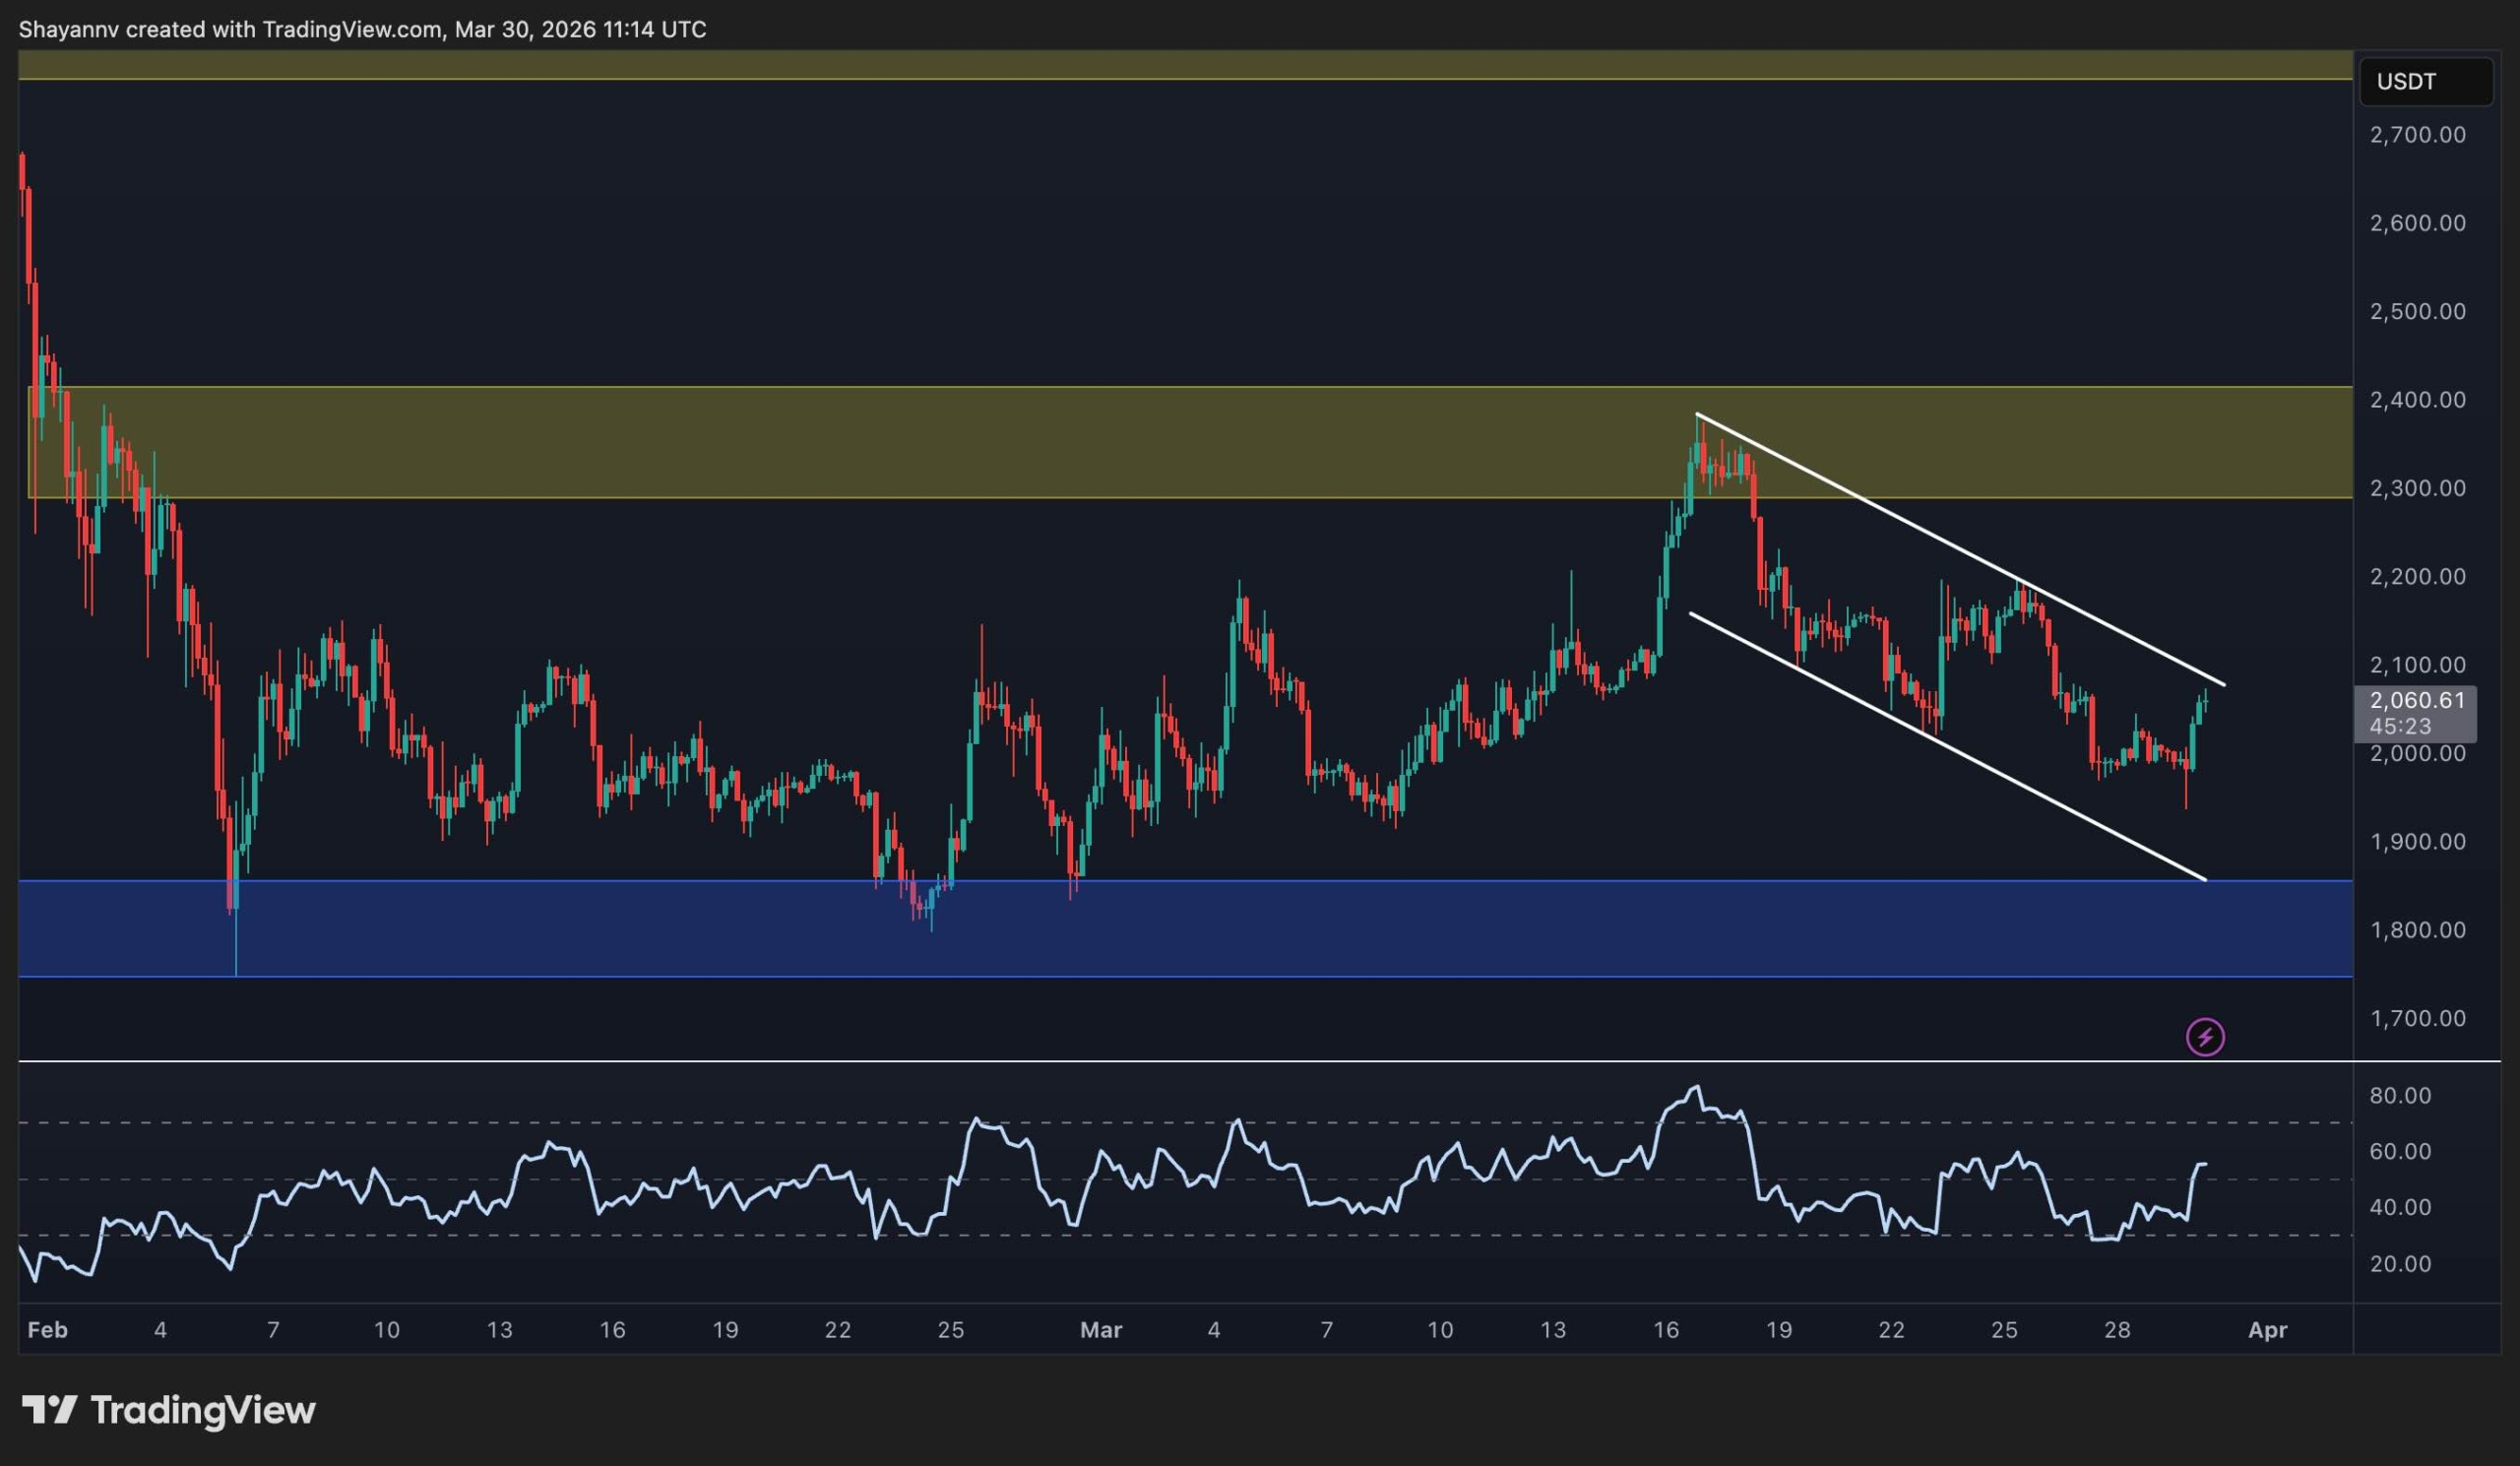
ETH/USDT 4-Hour Chart
Following the failed breakout attempt into the $2.3k–$2.4k resistance zone a couple of weeks ago, ETH has been trading inside a short-term descending channel on the 4-hour chart. The price is currently close to $2.1k, near the higher boundary of that channel. But every recovery attempt has fresh selling pressure to this point.
The RSI on this timeframe has also bounced from the low-30s back toward the mid-50s. This suggests that the immediate selling pressure may be temporarily fading. However, buyers still need to break above the channel’s upper boundary and, at least, reclaim the recent high near $2.2k on a sustained basis to shift the short-term structure. Failure in doing that will make a retest of the critical $1.8k support zone a realistic short-term scenario.
Sentiment Analysis
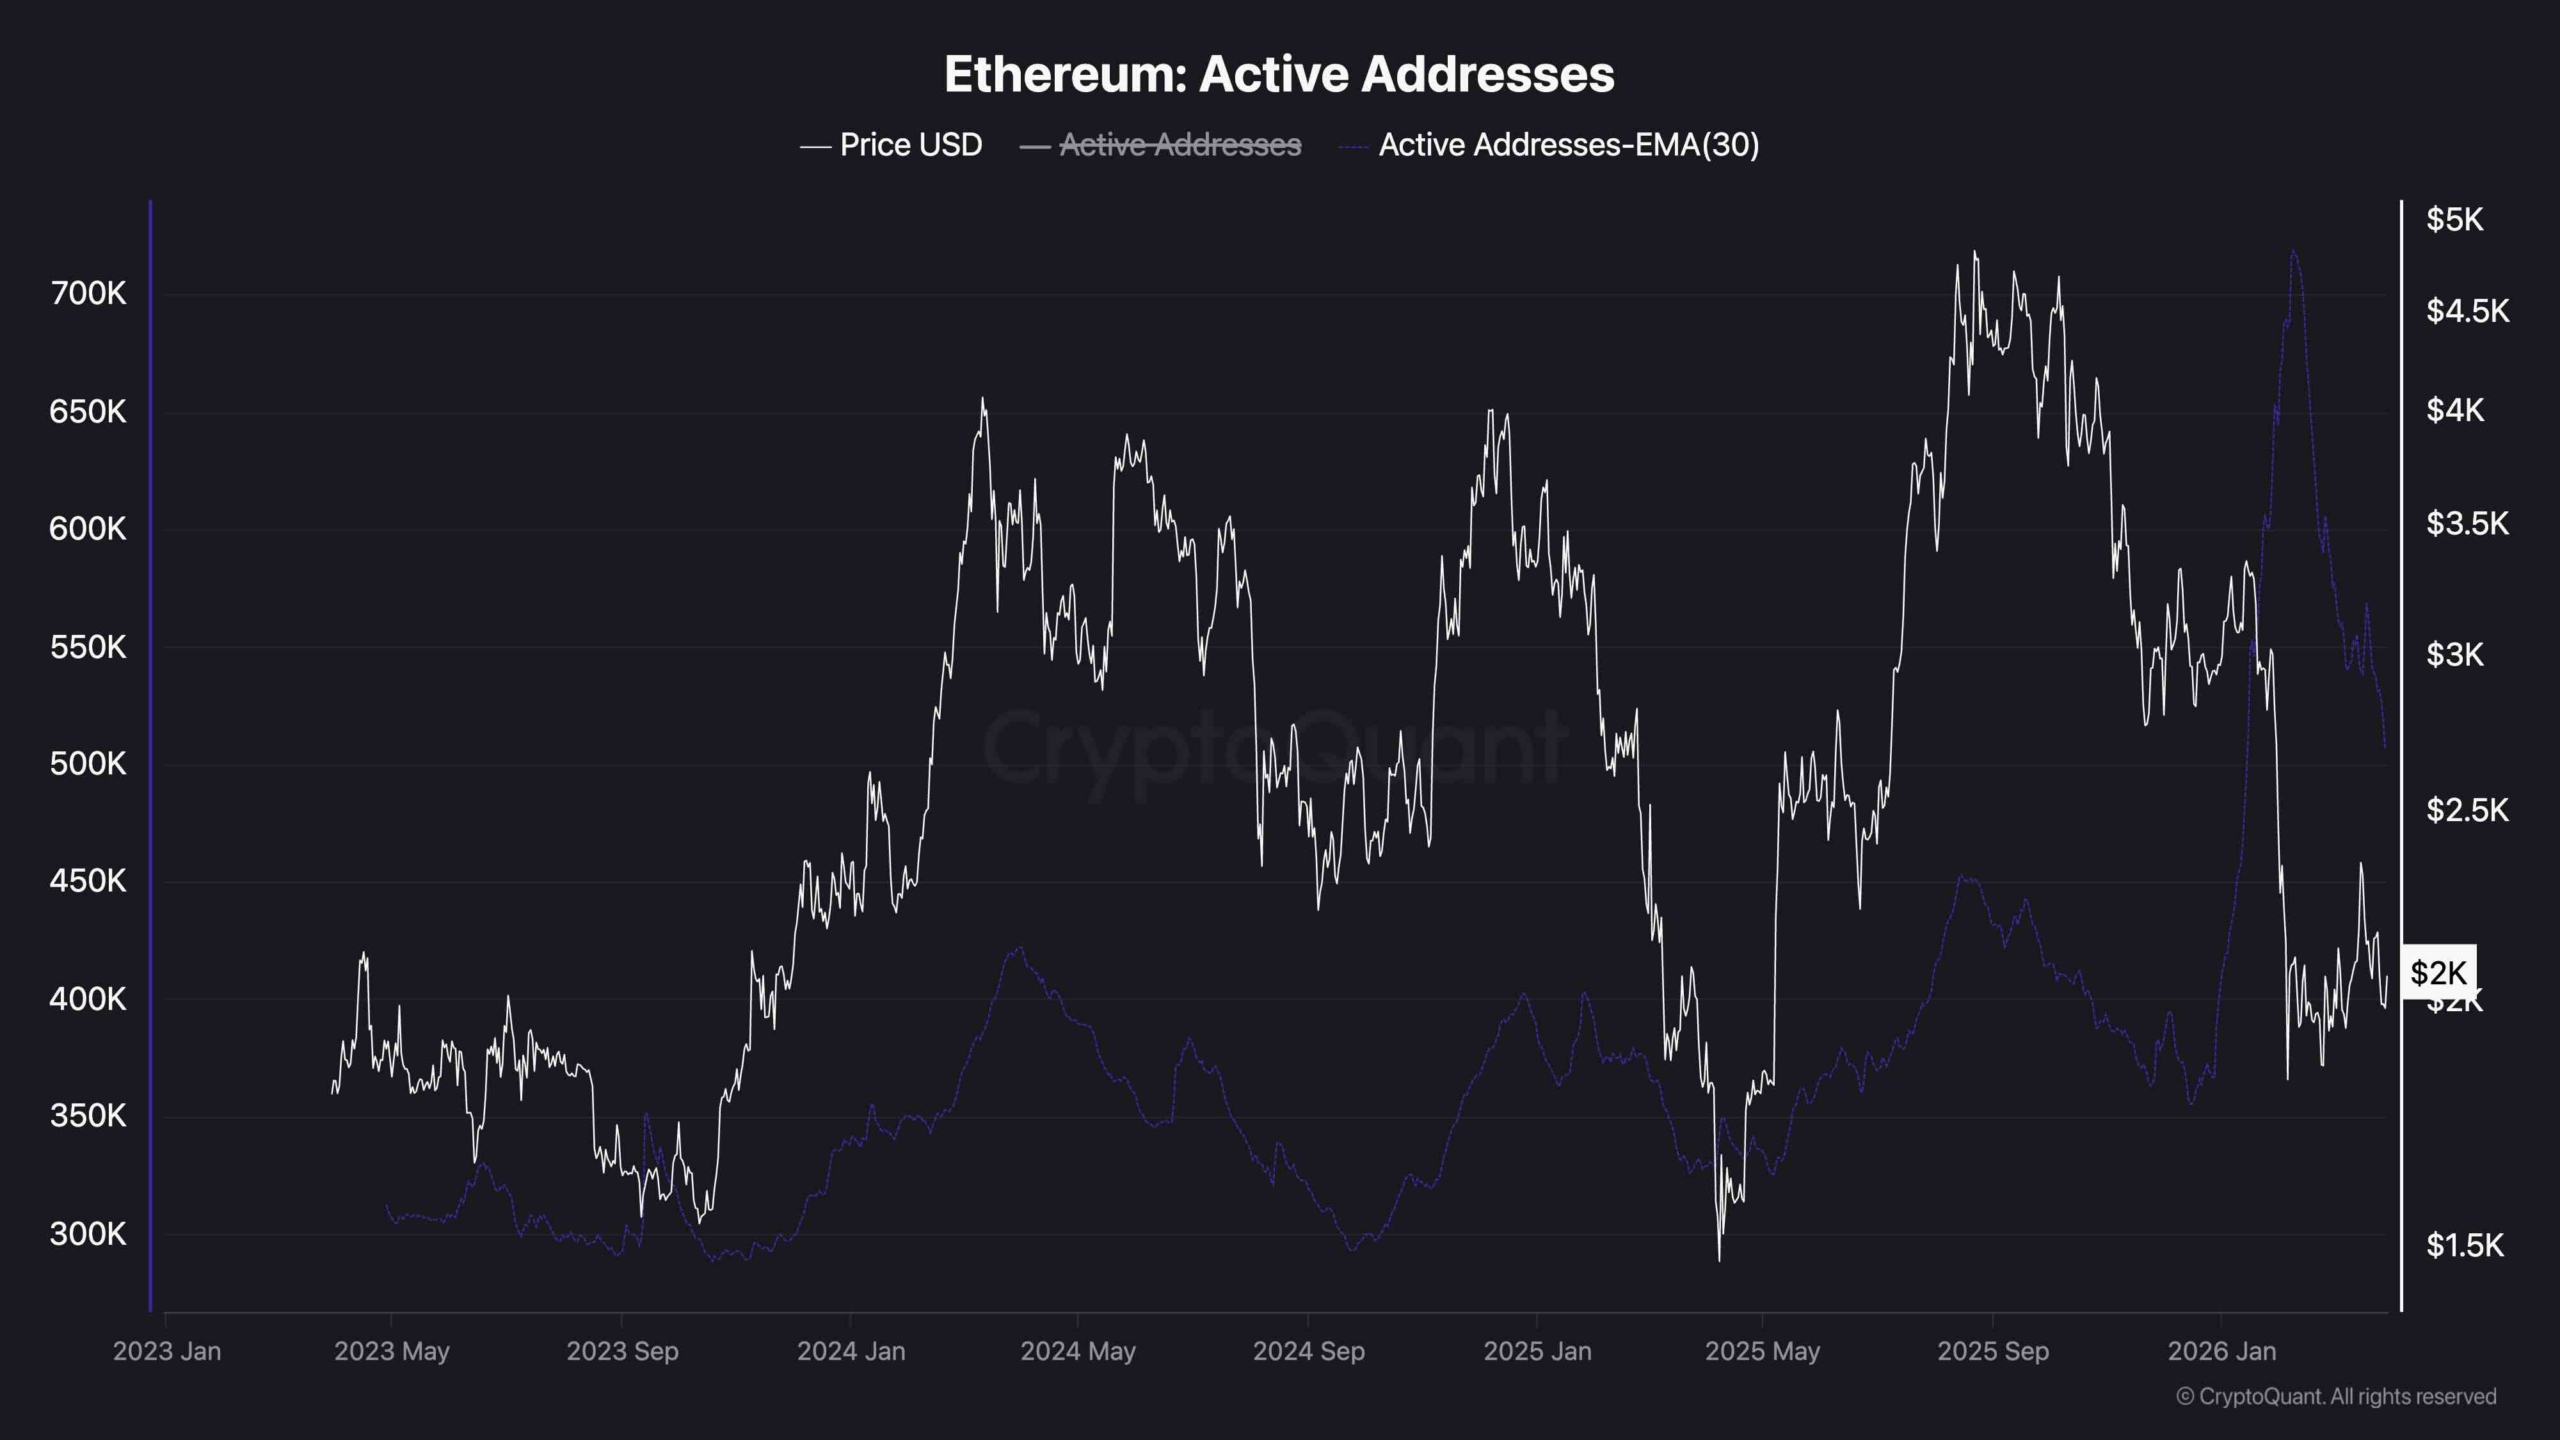
Ethereum’s active address count showed a notable spike during the February crash and around the subsequent lows, significantly surging above levels seen during the last two years. While that kind of activity burst can appear constructive at first glance, the context suggests it was more likely a capitulation event, which is a rush of panicked selling and liquidations rather than a wave of fresh demand entering the market.
Yet, for ETH to build a credible bullish case, on-chain activity needs to recover sustainably, not just spike during moments of market stress. Until daily active addresses trend higher on a consistent basis, with the price also climbing, the network data support a cautious outlook rather than a recovery narrative.
The post Ethereum Price Analysis: ETH Reclaims $2K but Bearish Momentum Still Persists appeared first on CryptoPotato.