


Ethereum has staged a notable rebound from the recent capitulation low near the mid-$1,700s, but the broader structure remains corrective after months of persistent downside.
The current advance looks more like a short-term relief rally within an established downtrend than a confirmed trend reversal, so the focus is on whether the price can reclaim key resistance zones and invalidate the series of lower highs that has dominated since late 2025.
Ethereum Price Analysis: The Daily Chart
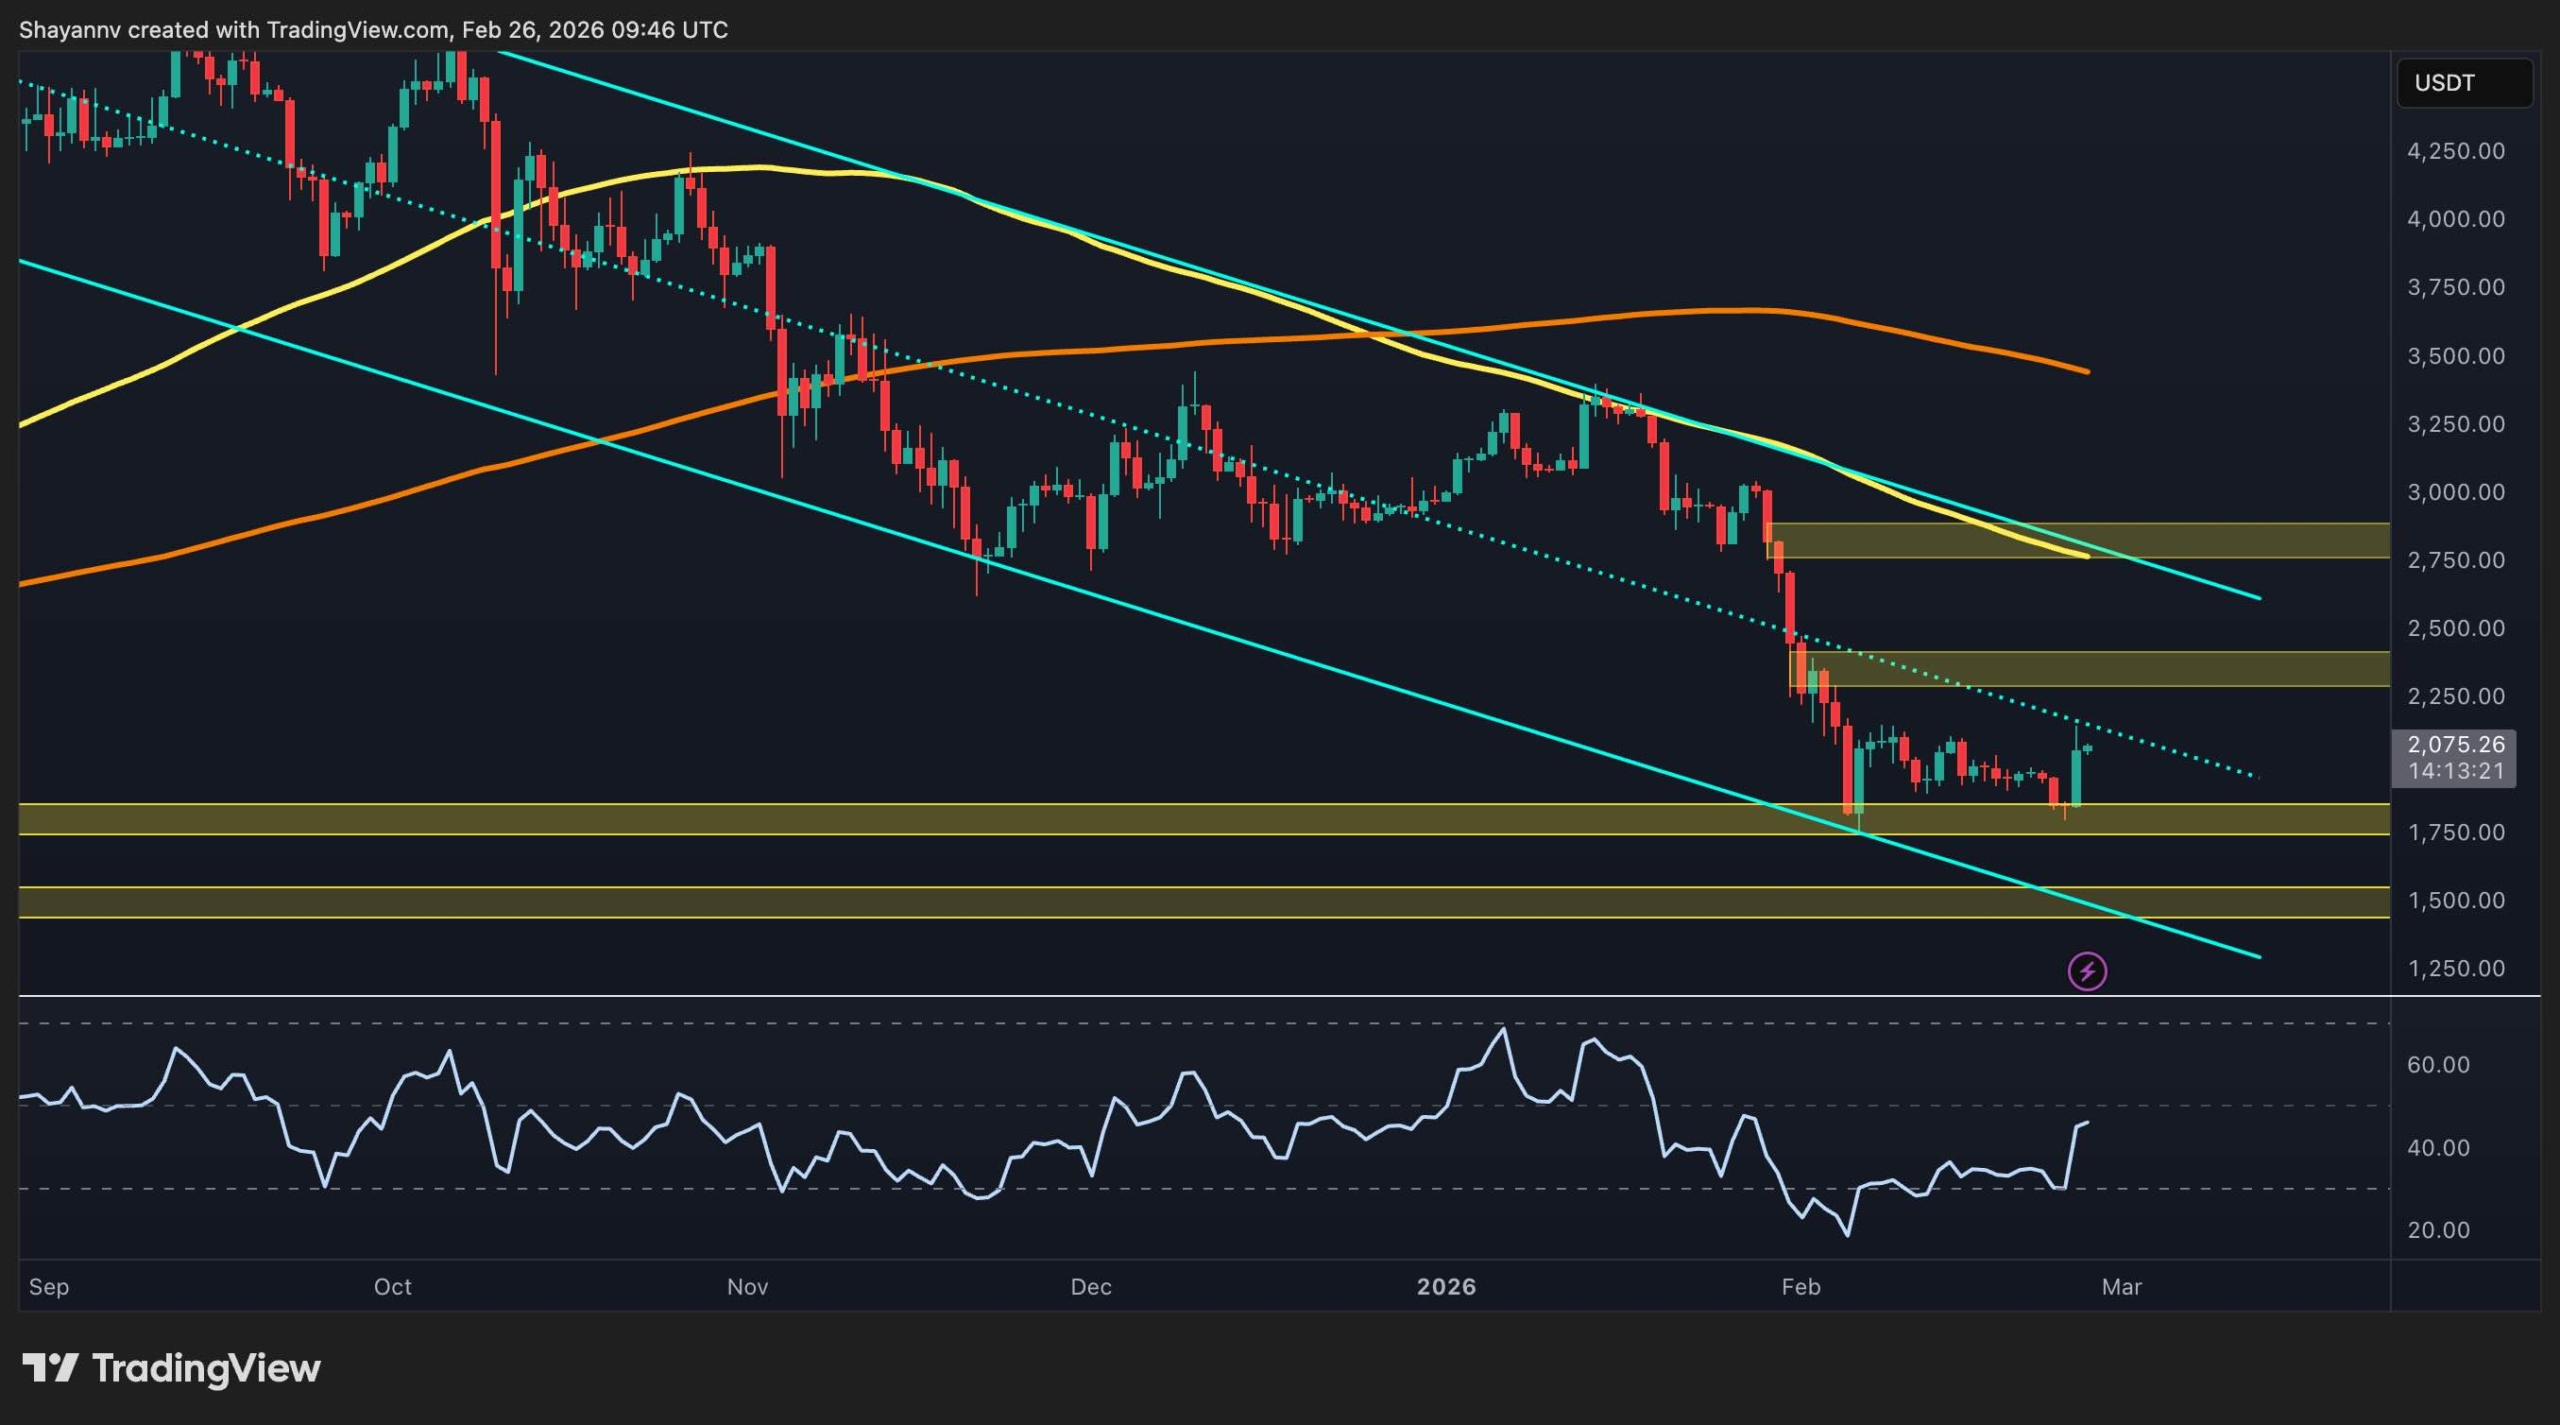
On the daily timeframe, ETH continues to trade inside a well-defined descending channel, with the latest sell-off driving price from above the $3,000 mark down to the $1,700–$1,800 demand region near the lower boundary.
The bounce from this support has pushed RSI out of oversold territory and carried the price back toward the mid-line of the channel, but ETH still sits below the major resistance cluster formed by the $2,300–$2,400 supply zone, while the declining 100-day (yellow) and 200-day (orange) moving averages remain overhead.
As long as the channel remains intact and these resistances cap the market, the dominant trend points lower, and any rallies into that band are best viewed as tests of supply rather than evidence of a completed bottom.
ETH/USDT 4-Hour Chart
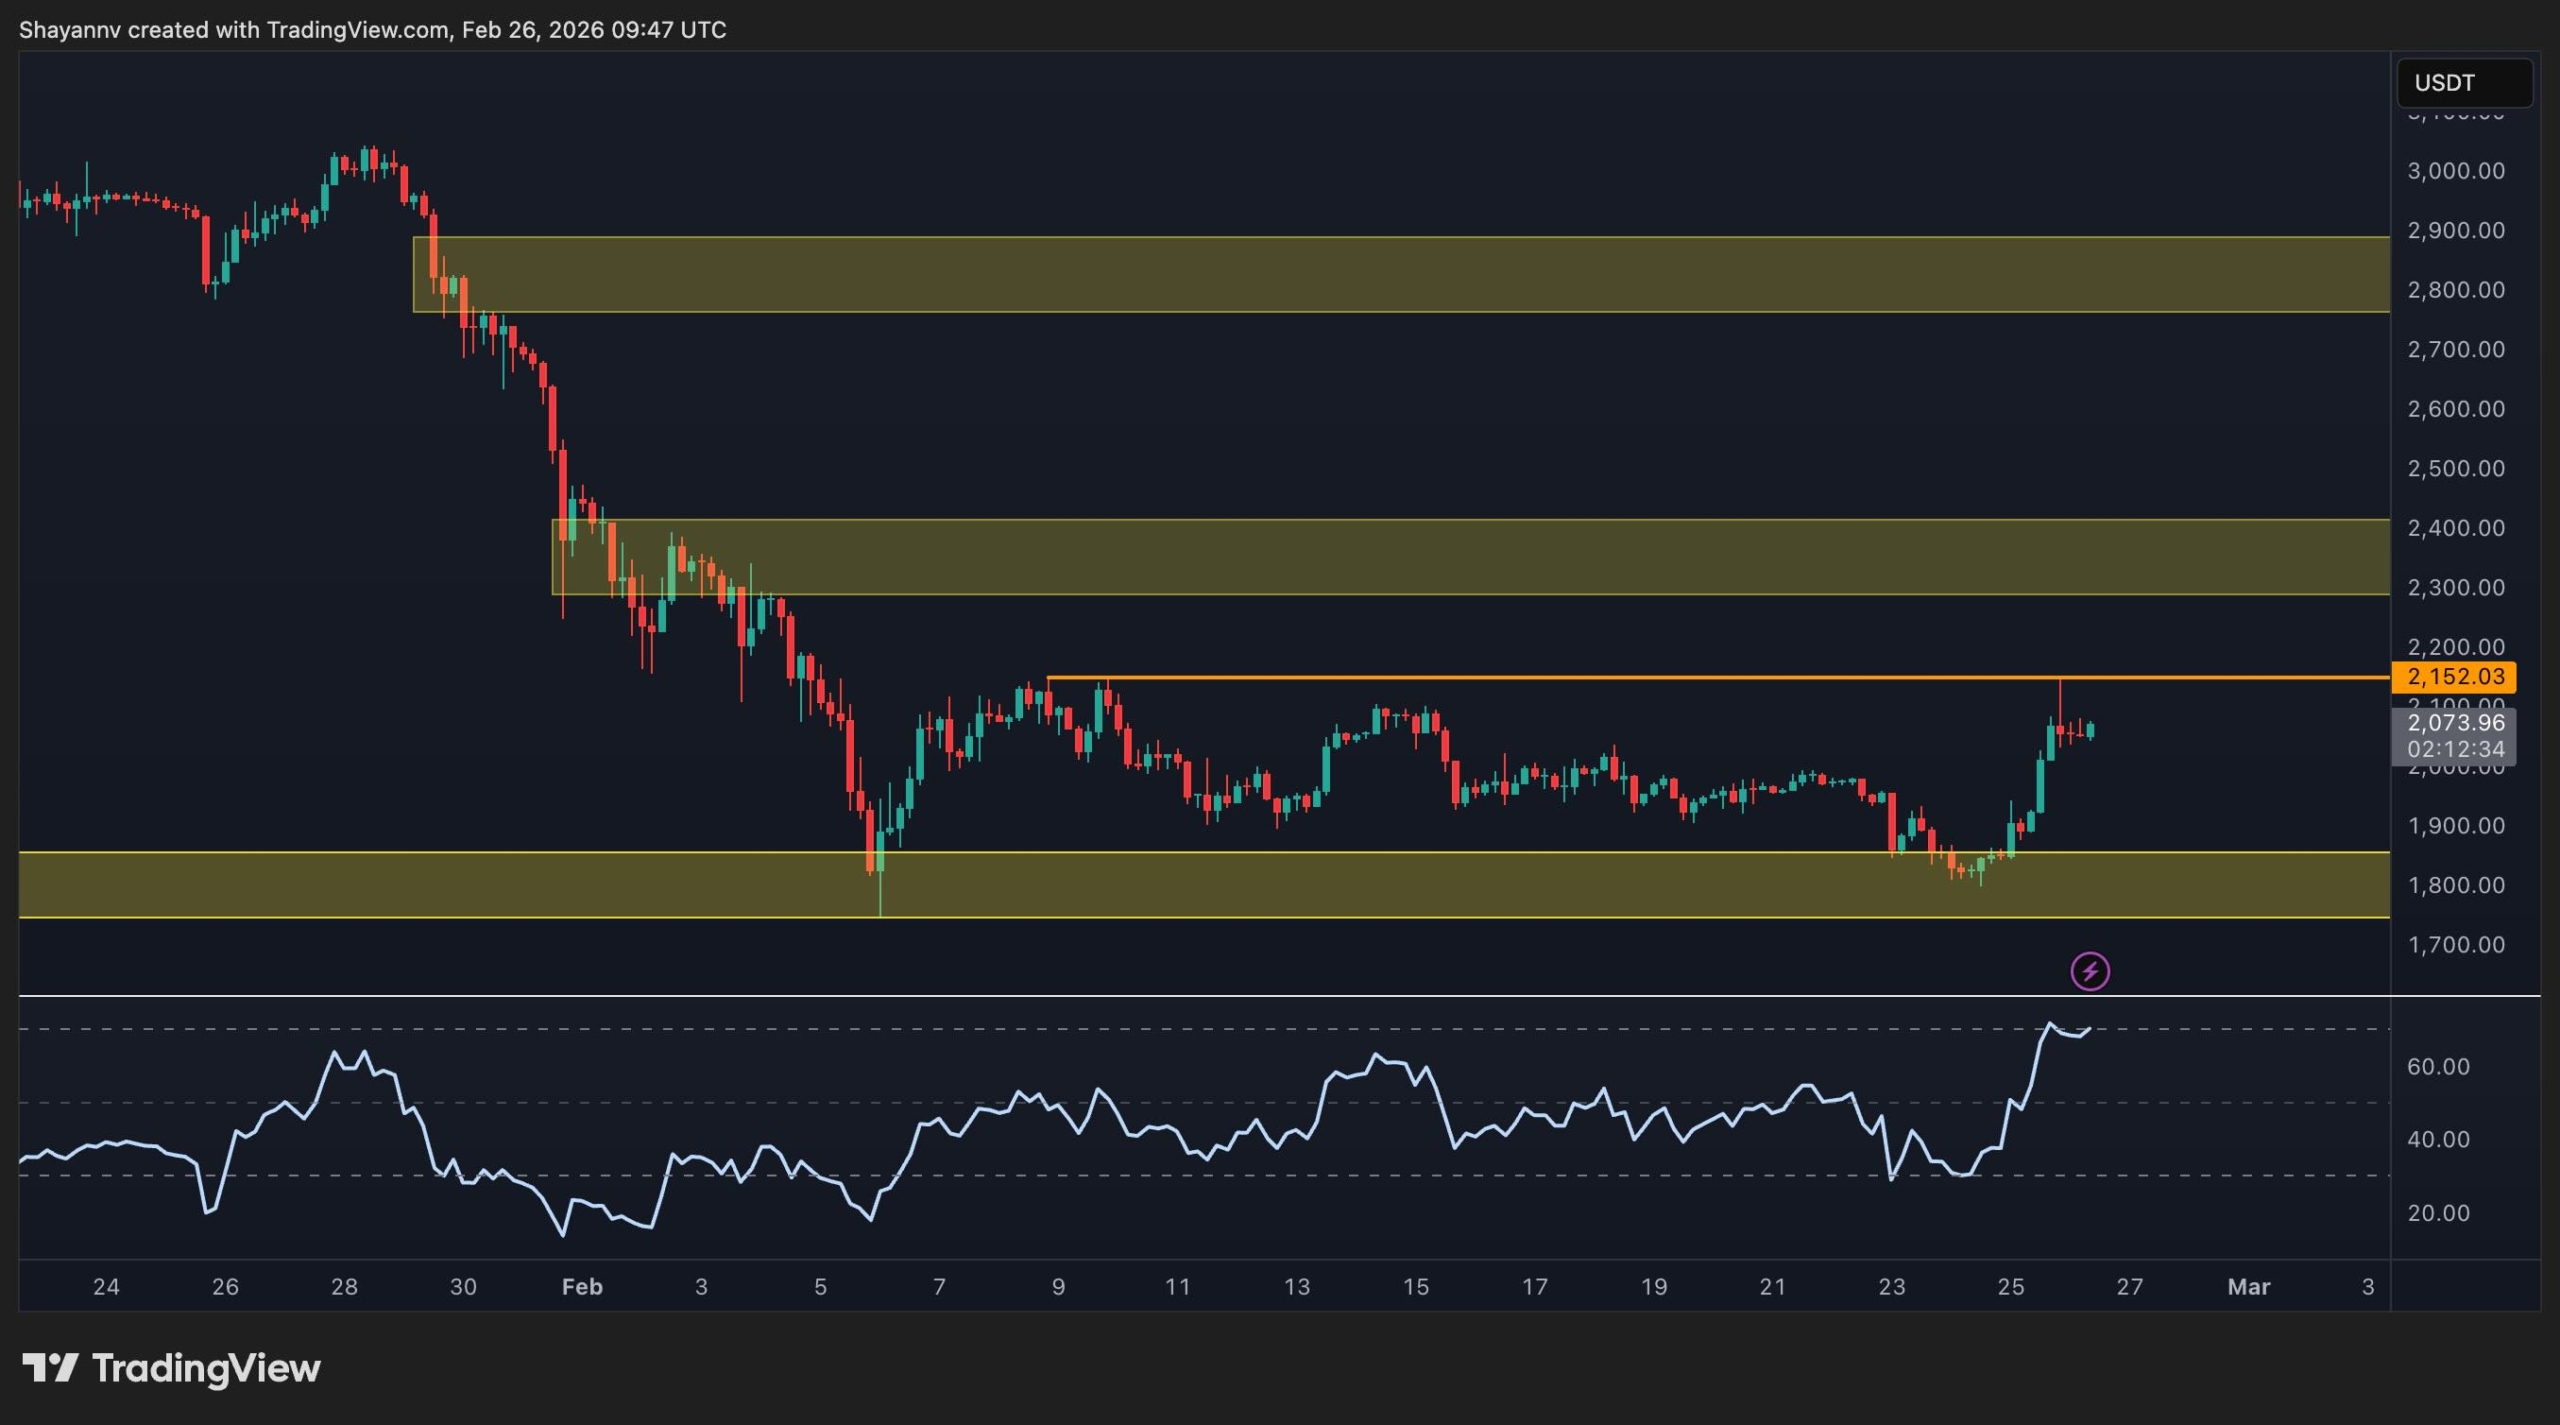
The 4-hour chart shows the rebound in greater detail: ETH has recovered sharply from the $1,800 area and is now pressing into the horizontal resistance level at the recent prominent high around $2,150. Short-term momentum has improved, with the RSI breaking out from a prolonged sub-40 regime and now printing an overbought signal.
Yet, the market is effectively range-bound between the $1,750–$1,800 support floor and the $2,150 ceiling. A clean breakout and consolidation above the latter would open room toward $2,300–$2,400, whereas a failure here followed by a return below $2,000 would suggest that the rebound is losing steam and that a re-test of the recent lows at $1,700 remains likely.
On-Chain Analysis
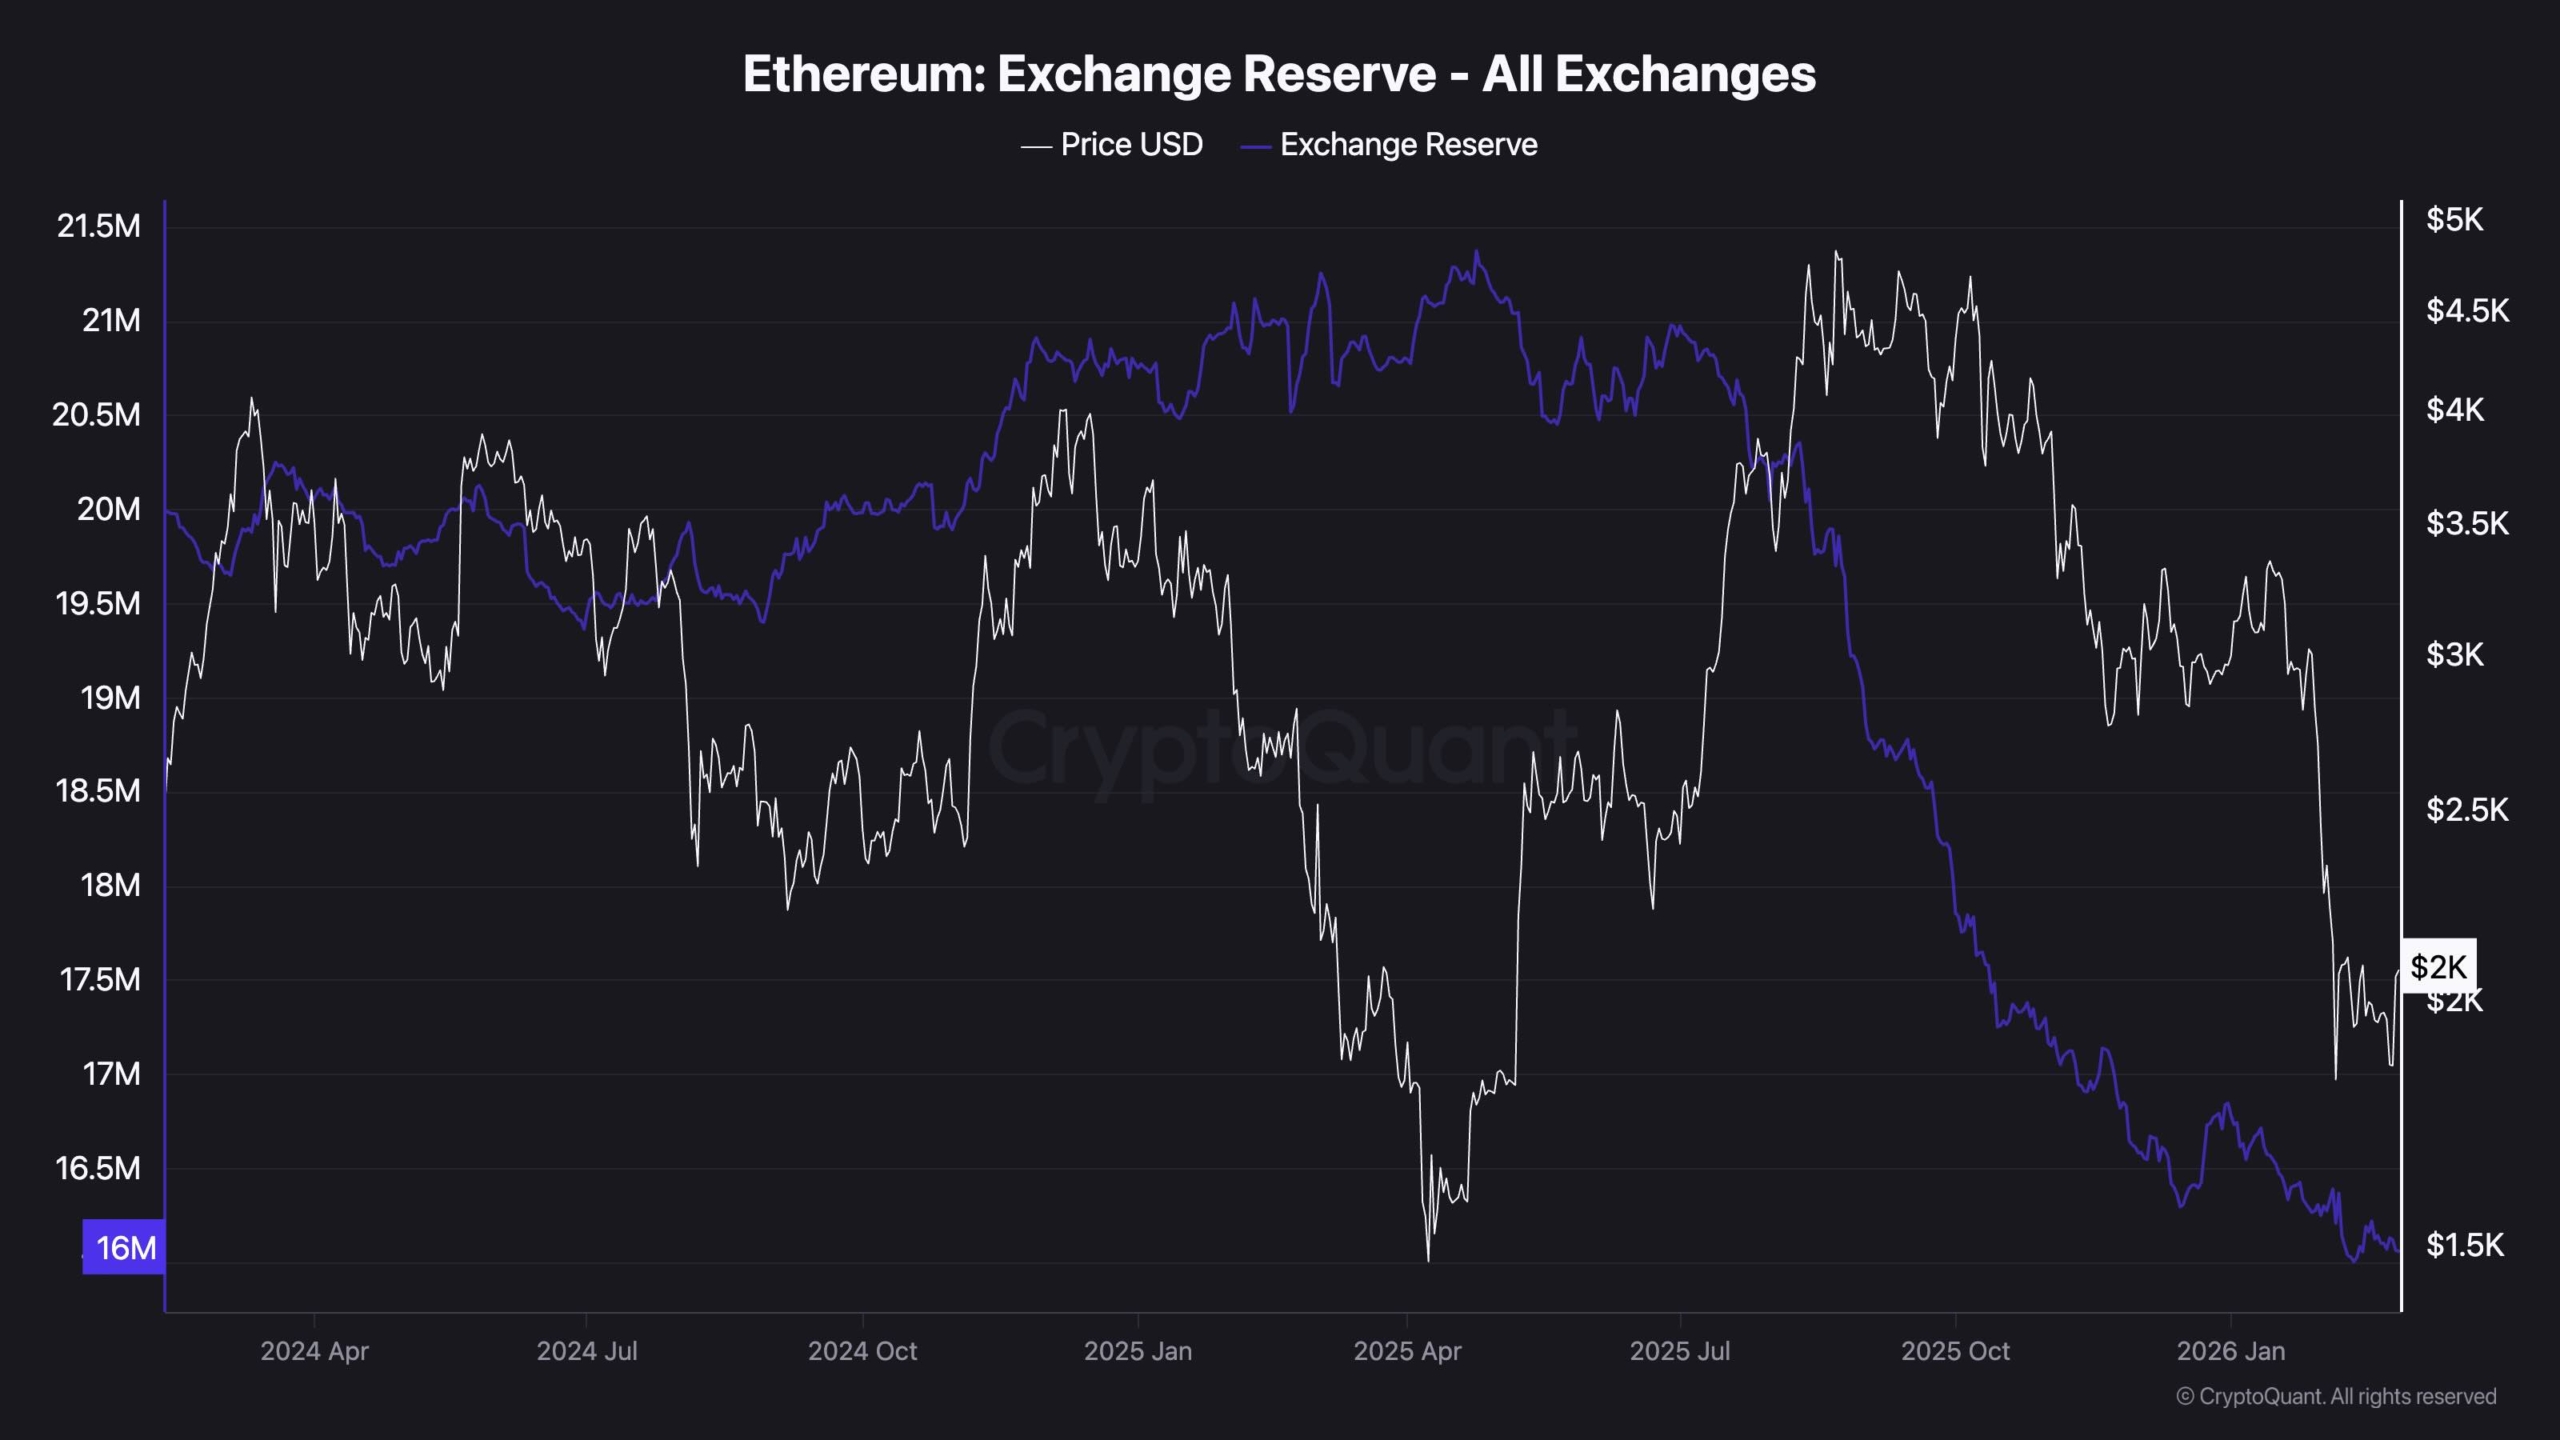
On-chain data from the exchange reserve metric indicate that the amount of ETH held on centralized exchanges has been trending down for many months and is now near multi-year lows. This structural decline in exchange balances, even as price has weakened, implies that a growing share of supply is being moved off-exchange, whether into self-custody, staking, or other long-term holdings, reducing the immediate pool of coins available for spot selling.
While this does not guarantee an imminent reversal, it is generally more consistent with an environment of underlying accumulation than one of broad distribution, and it suggests that, once the current downtrend exhausts, the reduced exchange supply could amplify the impact of renewed demand on the price.
The post Ethereum Price Analysis: Relief Rally or Trend Reversal? ETH At a Crossroads After 20% Surge appeared first on CryptoPotato.