


Ethereum is trading at $2,340 as April closes out, having quietly done what it failed to accomplish for the better part of six months: break out of the descending channel that has defined its entire corrective structure since October 2025. The breakout is fresh, unconfirmed on higher timeframes, and happening right below the $2.4k resistance zone.
That alone makes this one of the more interesting technical setups ETH has presented in this cycle.
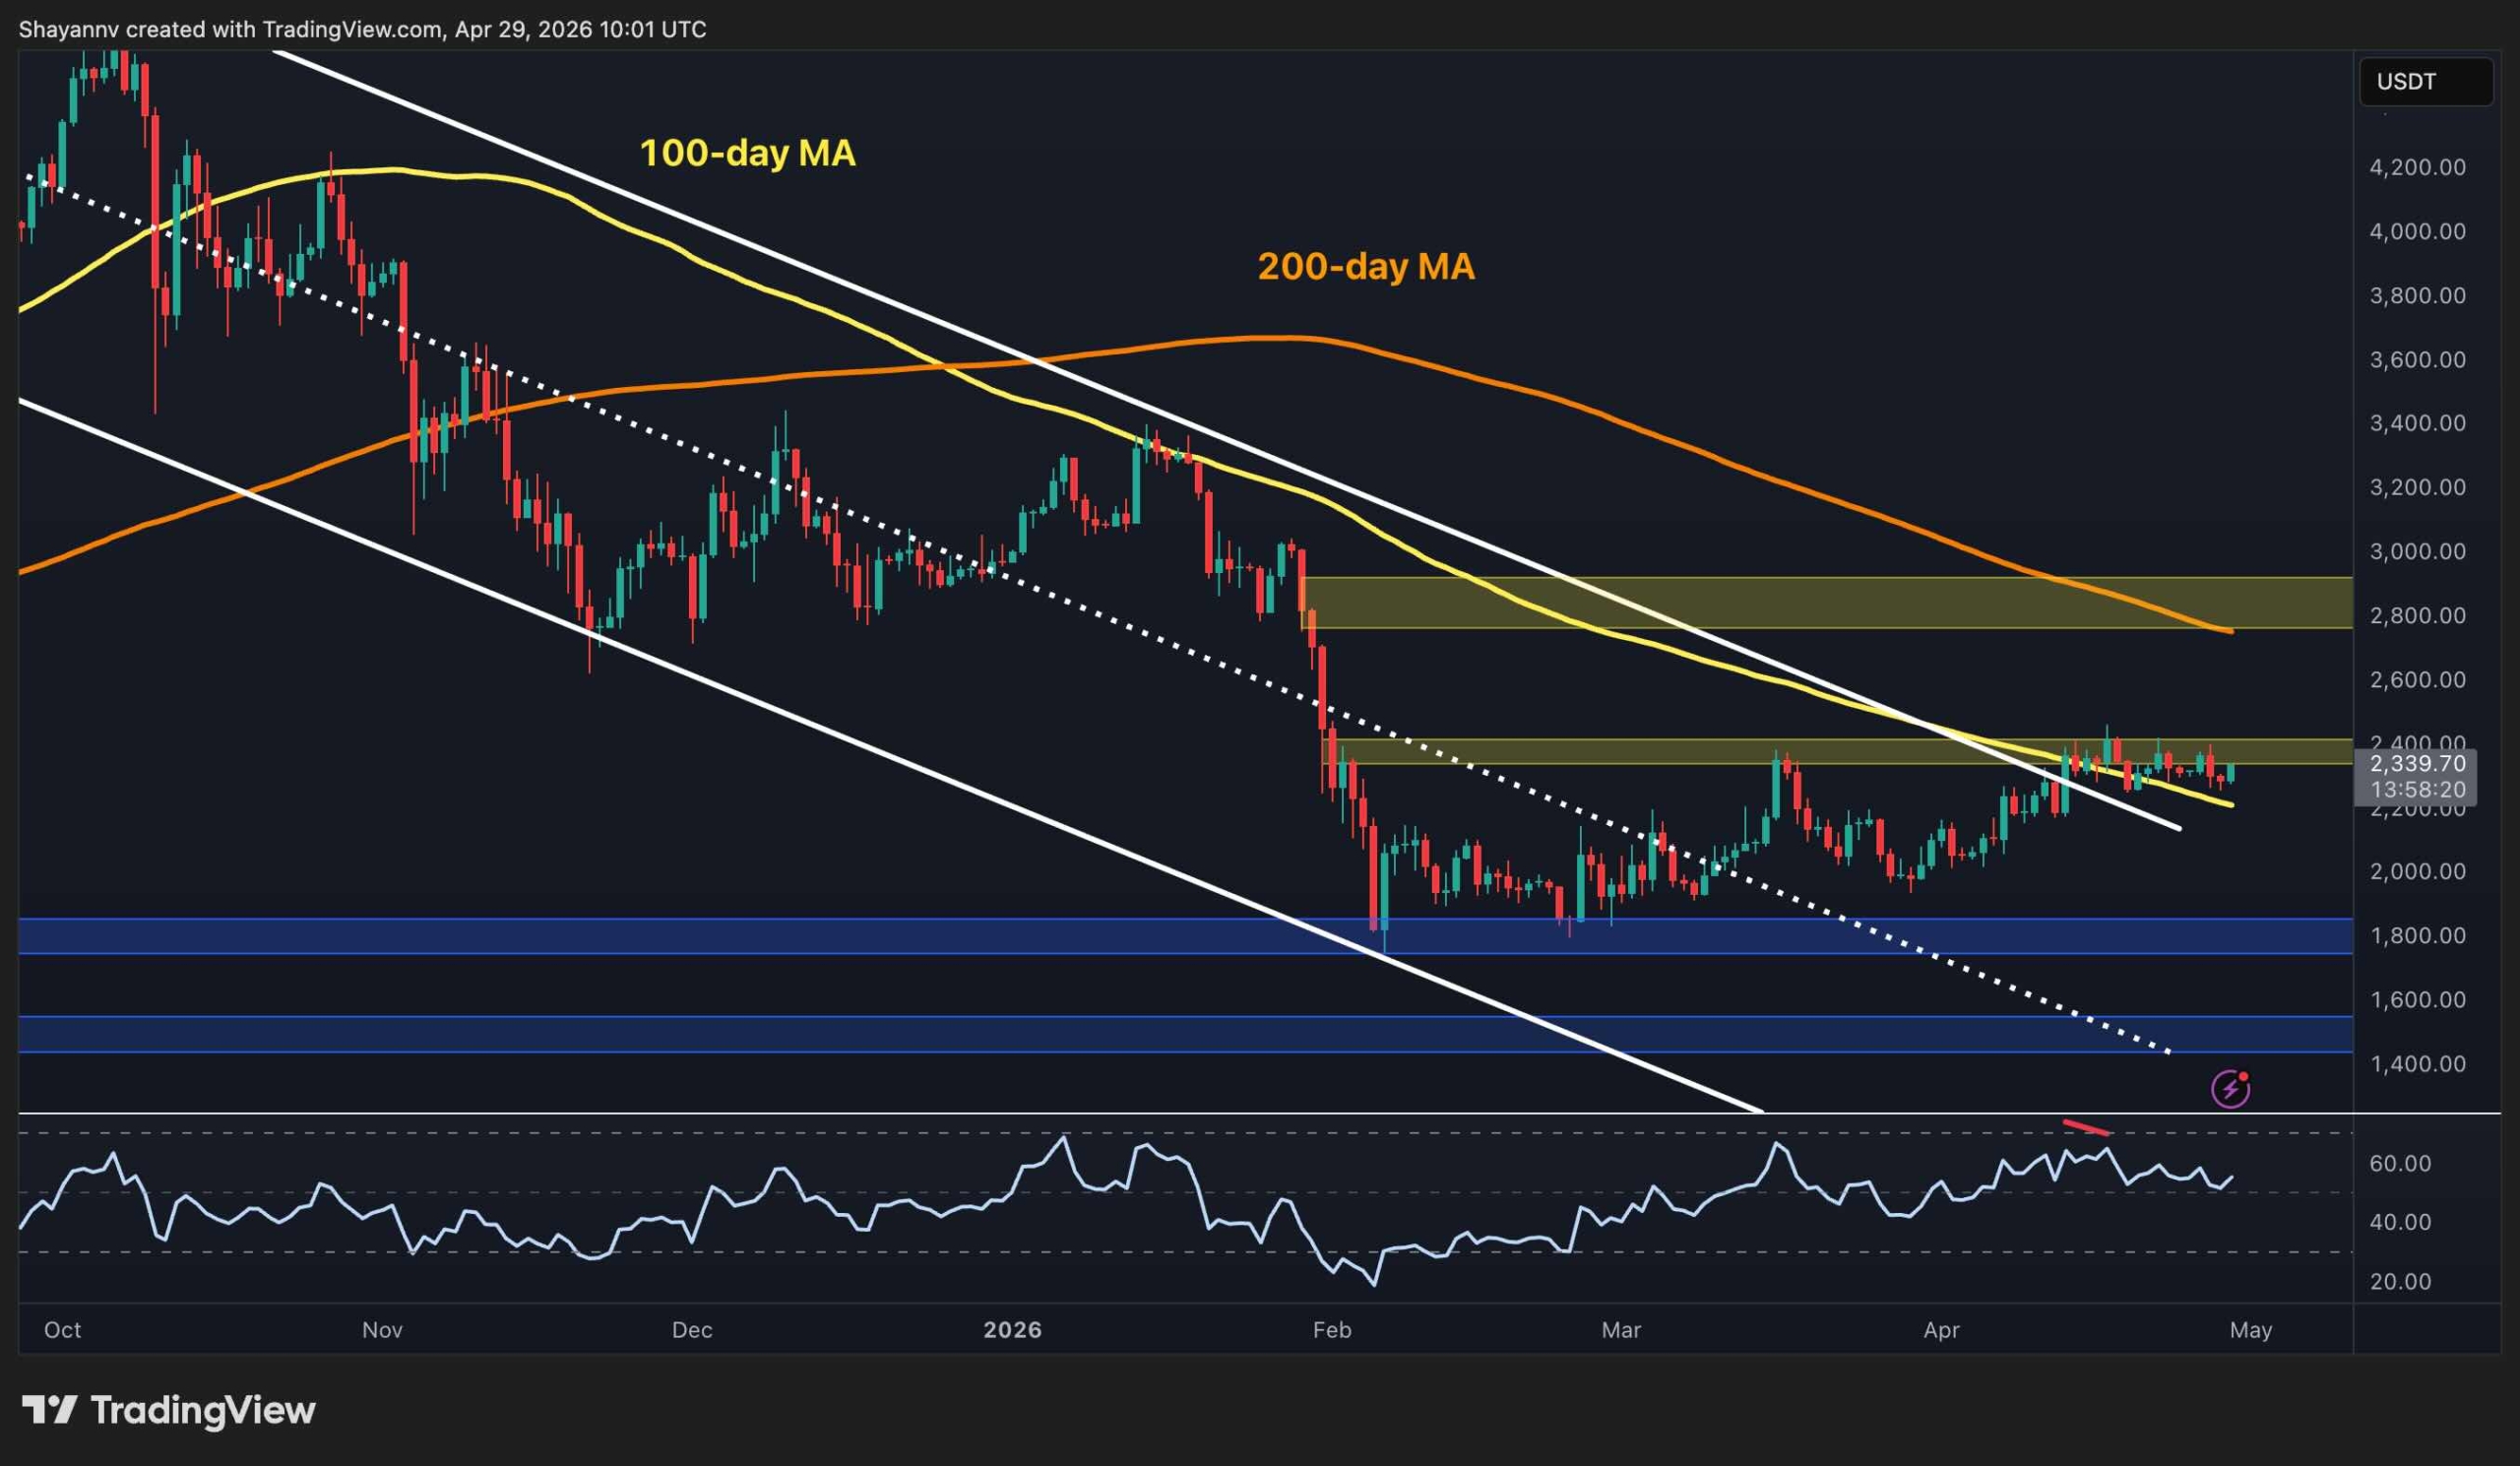
Ethereum Price Analysis: The Daily Chart
For the first time since the downtrend began, ETH has pushed above the upper rail of the descending channel that contained the price from the late 2025 peak through the February lows. The price is currently just above the 100-day MA, which has declined to approximately $2.2k, meaning the channel breakout and the moving average recapture have occurred simultaneously, giving the current zone dual significance that prior breakout attempts simply did not have. The RSI is also hovering around 55–60 and has not confirmed the price highs with significant momentum, which is a caution flag worth watching.
The immediate overhead test is the $2.4k horizontal supply zone, which has rejected ETH on every approach since mid-March. A clean daily close above it would be the first genuine structural shift of the cycle, opening the path toward the $2.8k resistance area, where the 200-day MA is also located. On the downside, the reclaimed channel boundary and the 100-day MA near $2,200 form the new line of defense.
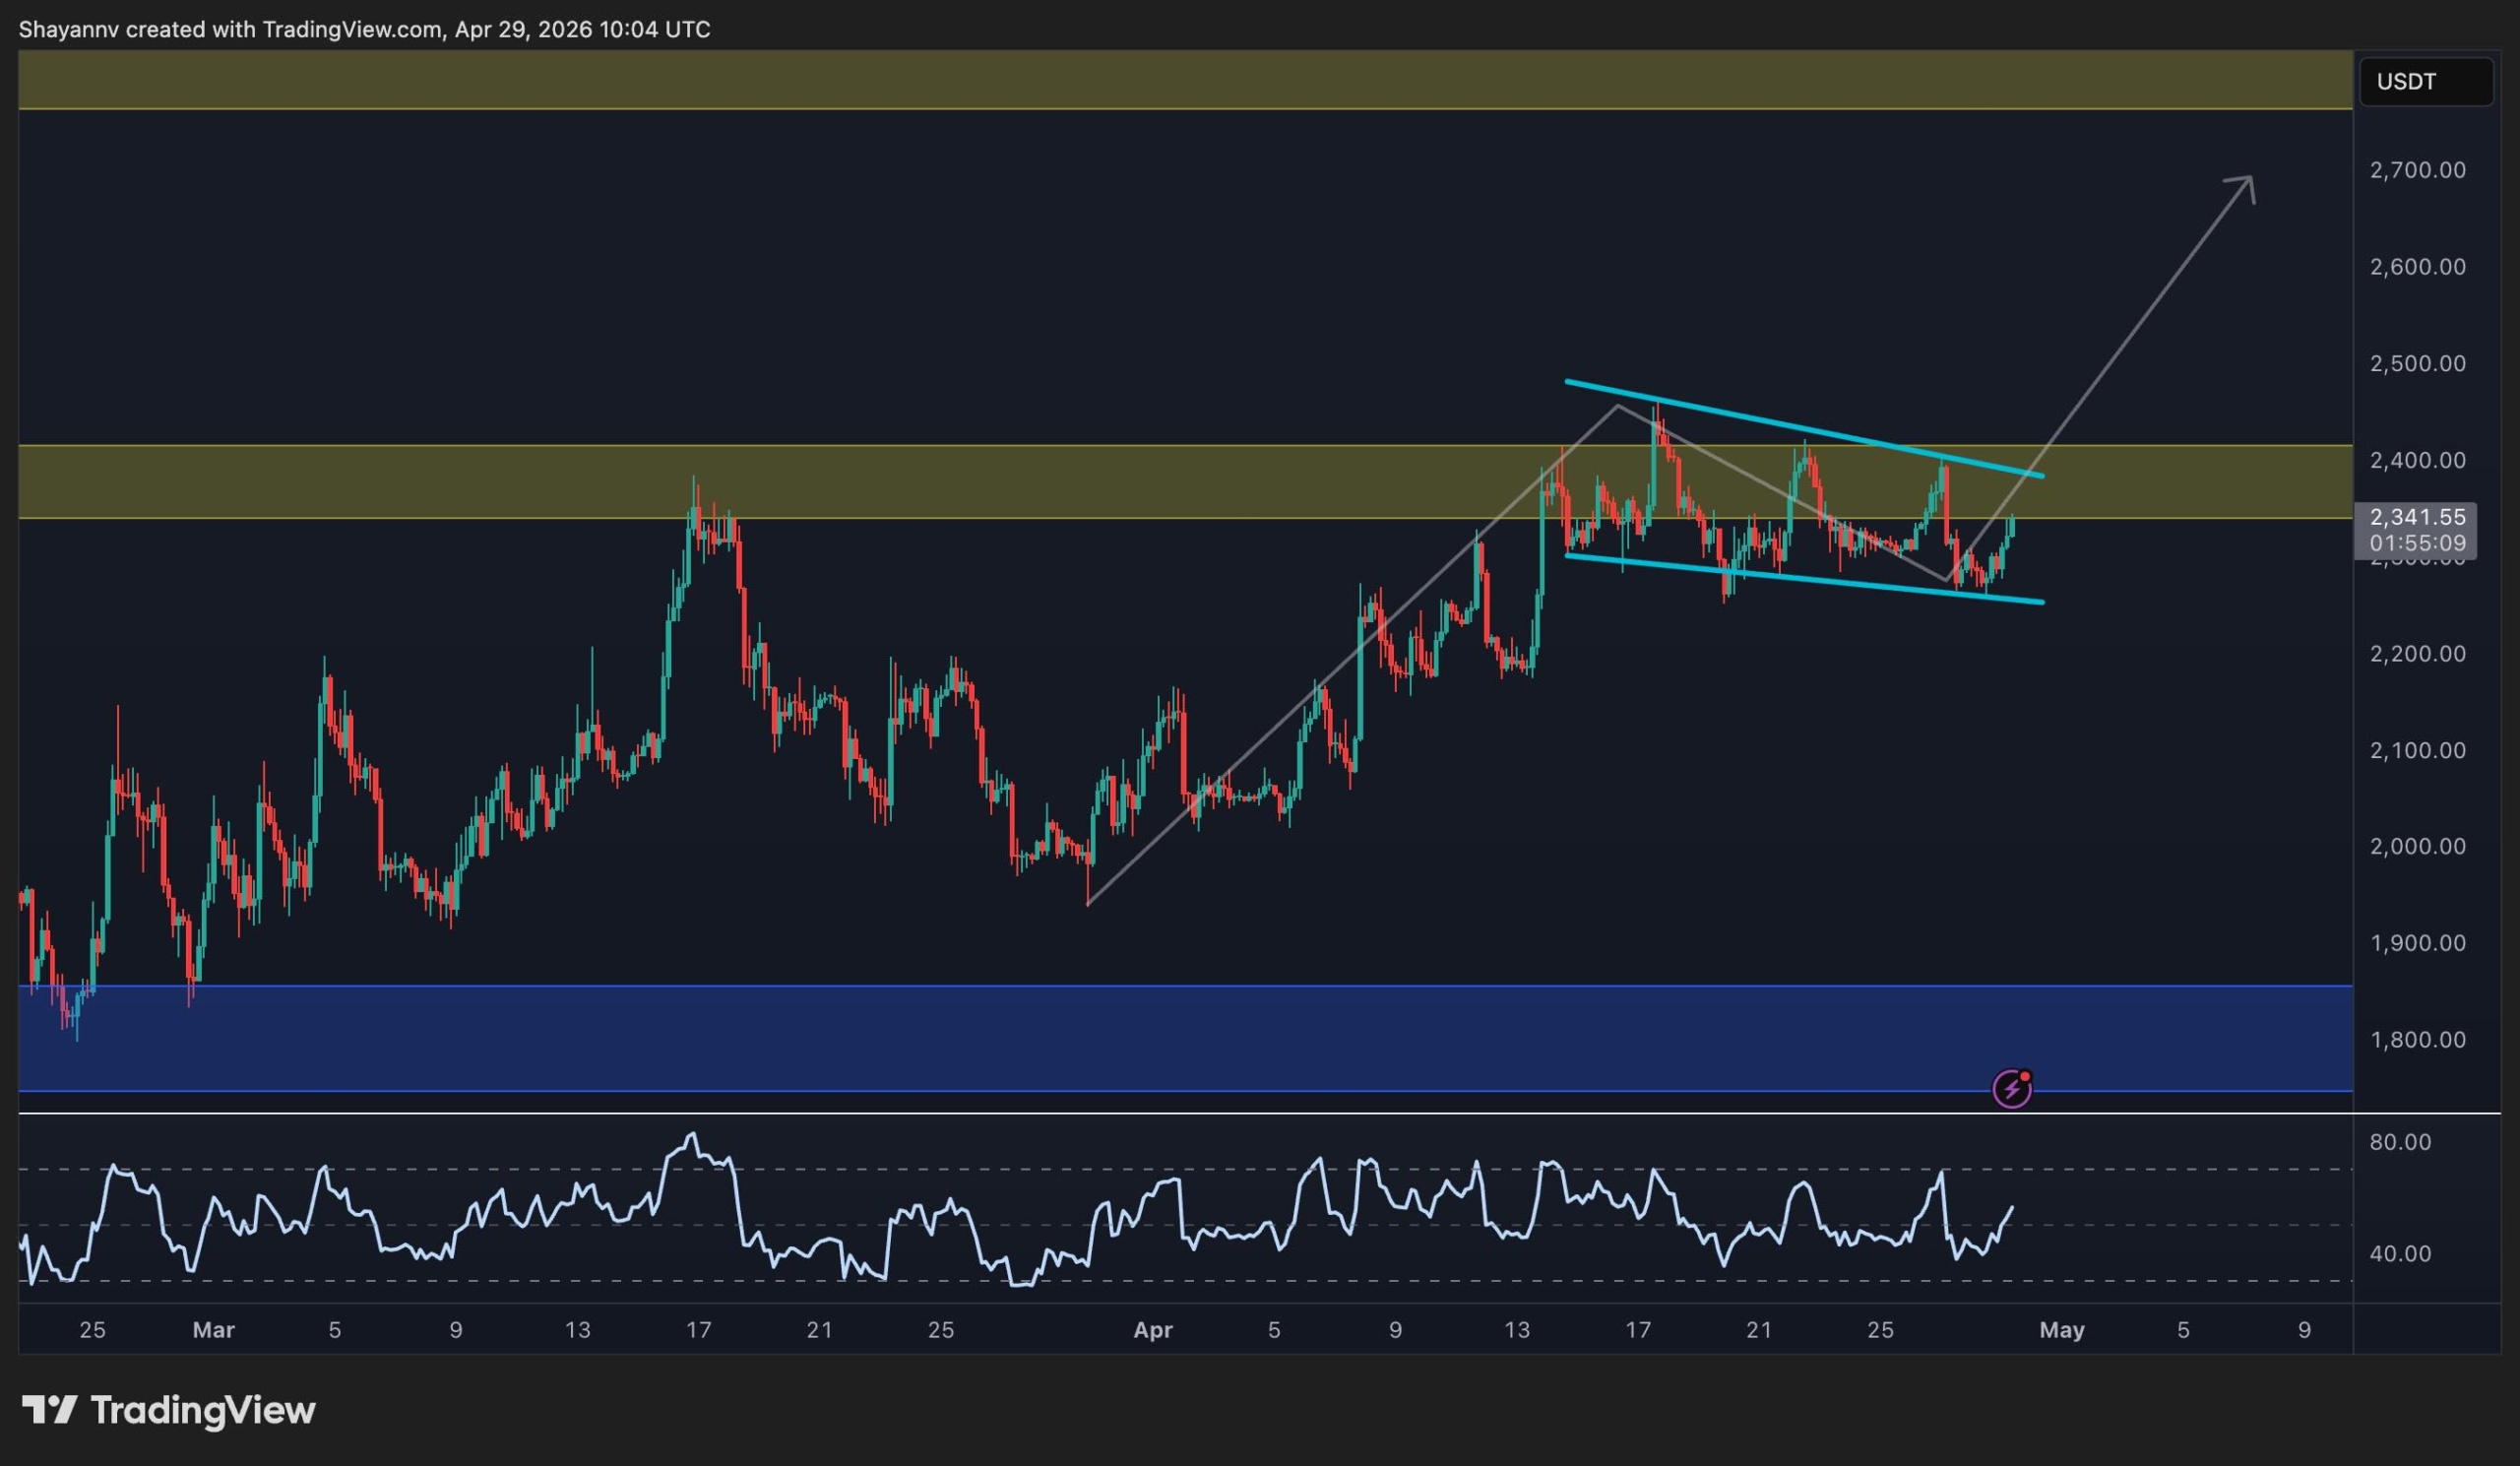
ETH/USDT 4-Hour Chart
On the 4-hour chart, the structure is arguably more constructive than the daily timeframe. After tagging $2.4k in mid-April, ETH has carved out a falling wedge, which is a tightening descending pattern with converging trendlines, that has historically resolved to the upside when it forms following an impulsive move higher.
The price has recently rebounded from the lower boundary of that wedge around $2,250, and the RSI has also recovered above 50, which indicates that a retest of the upper boundary of the pattern and the $2.4k supply zone is highly probable.
As the projected breakout target from the wedge, which is marked by the grey arrow on the chart, shows, the market is likely to rally toward the next resistance zone around $2.7-$2.8k in case a breakout occurs. On the other hand, a decisive drop and close below the pattern invalidates it and shifts focus back to the $2k and $1.8k levels below.
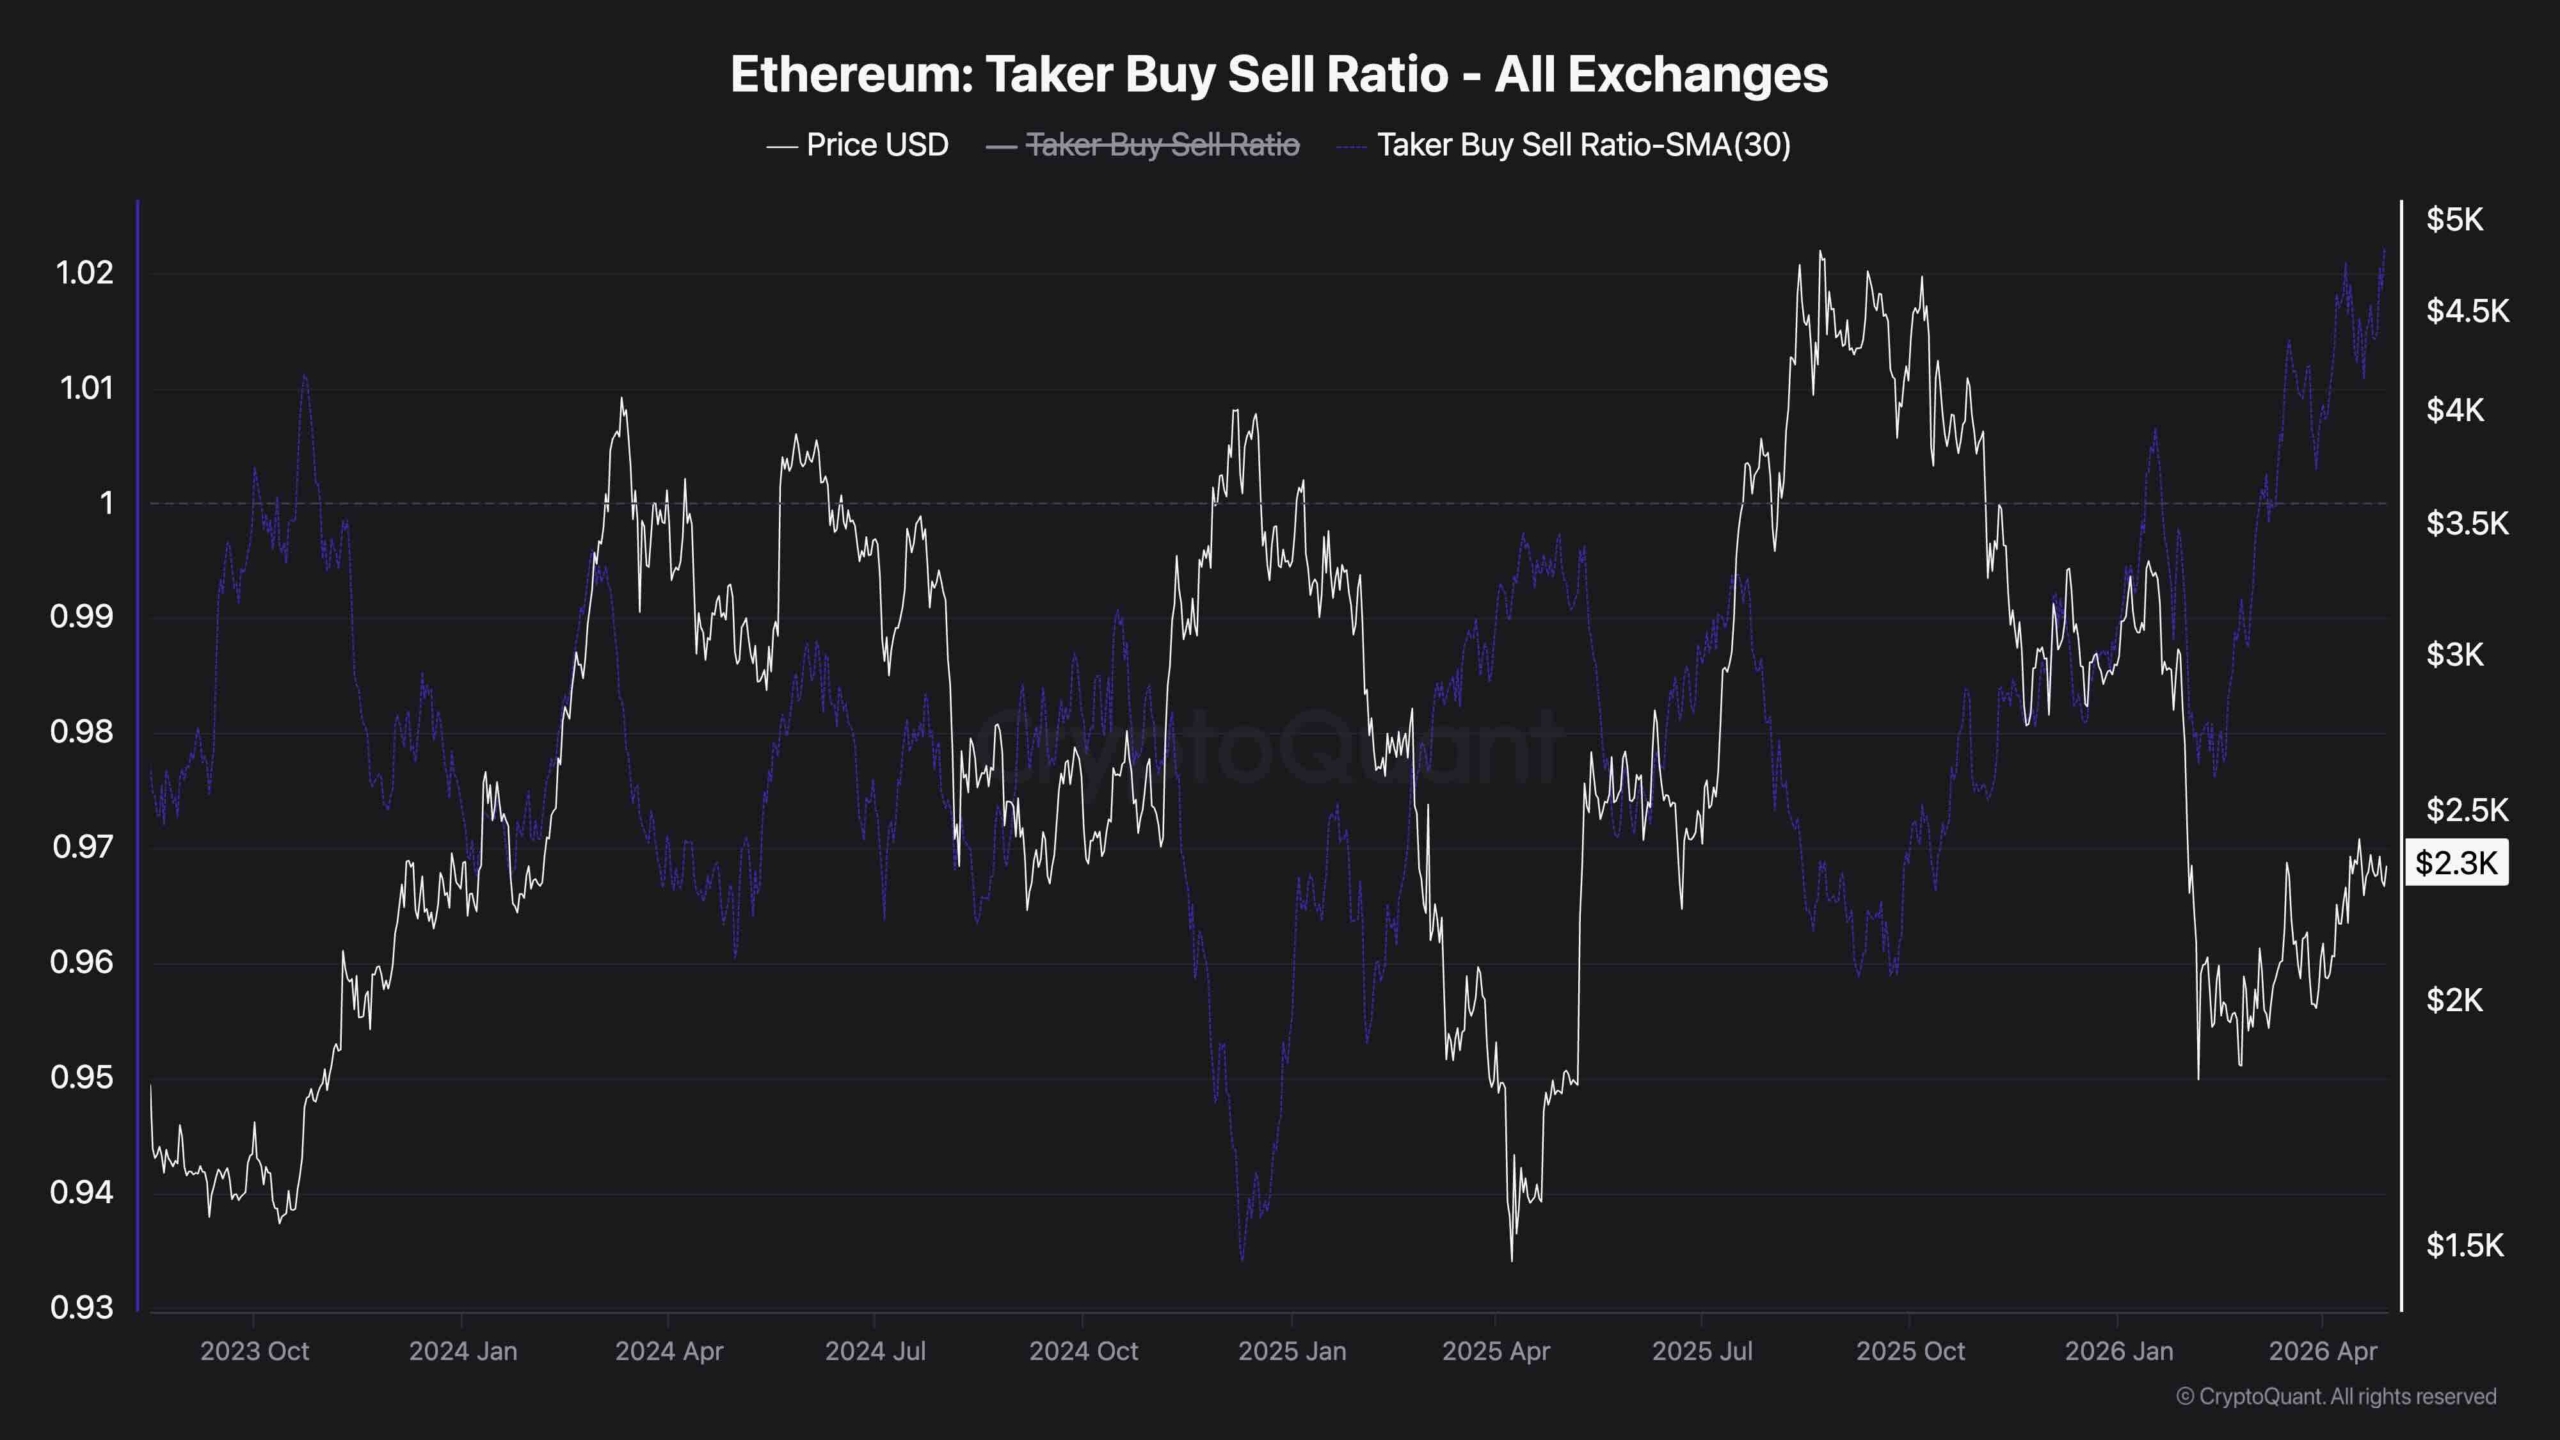
On-Chain Analysis
The 30-day moving average of the Taker Buy/Sell Ratio across all exchanges has spiked to 1.02, its highest reading in the dataset since late 2023. The raw ratio and its 30-day SMA are both climbing in tandem, and the move is happening alongside price pushing into the $2.4k resistance zone. Historically, readings above 1.0 have coincided with sustained bullish momentum, an optimistic signal for the short term.
This signal could mean aggressive taker buying is about to force the issue and catalyze the breakout, or it could flag overextended short-term demand that fades if $2.4k rejects once more. Either way, it is the most bullish derivatives sentiment reading ETH has produced this entire cycle, and it is hard to ignore.
The post Ethereum Price Prediction: ETH Breaks Key Downtrend—Is $2.8K Next? appeared first on CryptoPotato.