


The broader cryptocurrency market is showing signs of recovery as of April 16, 2026, supported by improving sentiment around a potential easing of geopolitical tensions in the Middle East. The total crypto market capitalization is hovering around $2.5–$2.6 trillion, with major assets posting modest gains.
Bitcoin is trading near $74,000–$75,000, up around 1%, while Ethereum is holding steady near $2,350–$2,360, gaining roughly 1–2%. Amid this positive backdrop, ether.fi has emerged as a standout performer.
ETHFI Sees Strong Momentum
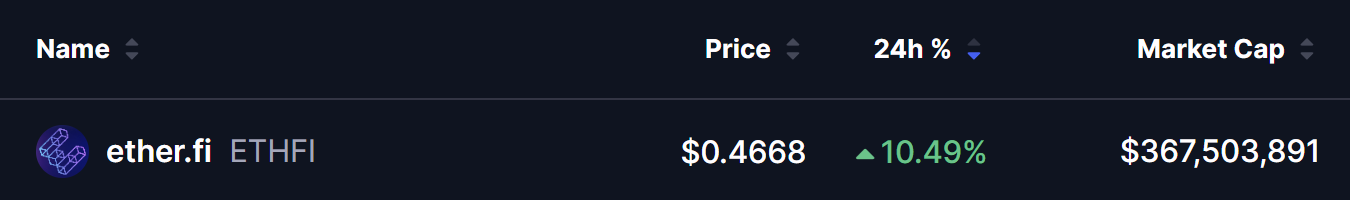
ETHFI has surged by an impressive 10%, pushing its market capitalization to approximately $367 million. More importantly, this latest move has brought the token close to a critical technical zone, where a potential breakout could unfold.
Descending Broadening Wedge in Play
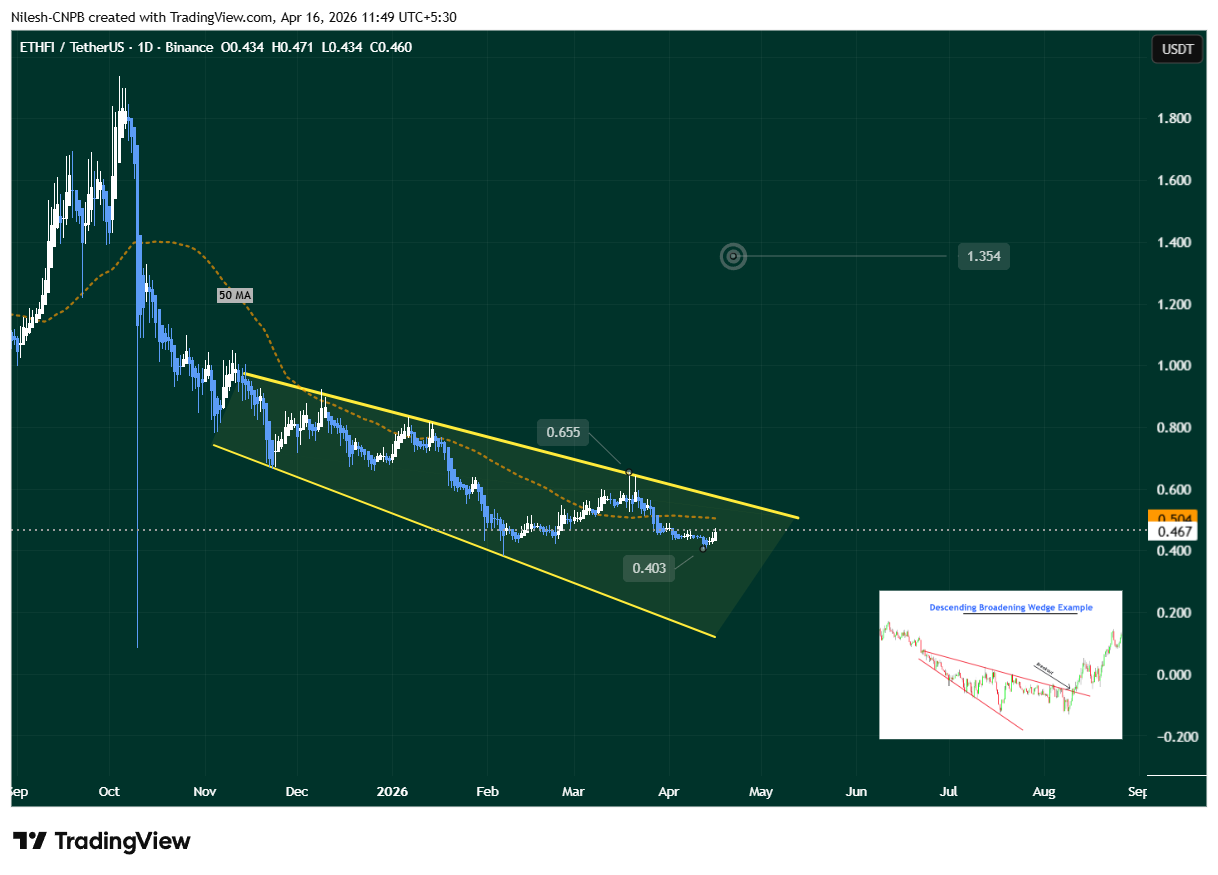
On the daily chart, ETHFI appears to be forming a descending broadening wedge, a bullish reversal pattern typically seen at the end of a downtrend.
- The structure has been developing since November 2025
- Price previously faced rejection near the upper resistance around $0.655
- A strong bounce from $0.403 support has pushed ETHFI to its current level near $0.467
- The price is still trading below the 50-day moving average (~$0.504) and beneath the upper resistance trendline near $0.57
This setup suggests accumulation and increasing volatility—often a precursor to a breakout move.
What’s Next for ETHFI?
Bullish Scenario:
If ETHFI manages to reclaim the 50-day moving average, it could act as a key short-term support level. A confirmed breakout above the resistance trendline near $0.57 could trigger a strong rally toward the next major target around $1.354—representing a potential 189% upside from current levels.
Bearish Scenario:
If ETHFI faces rejection at resistance, a short-term pullback toward $0.403 remains possible. However, as long as the price continues forming higher lows, the broader bullish structure would remain intact.
Bottom Line
With improving market sentiment and a bullish technical structure forming, ether.fi is positioning itself as one to watch in the coming sessions. A breakout confirmation could open the door for significant upside, but key resistance levels must be cleared first.
For now, ETHFI sits at a crucial juncture—where the next move could define its near-term trend.