


Key Insights:
- Chainlink price reclaimed support amid ETF inflows.
- Symmetrical triangle aiming for $20-$25 if price breaks $15 resistance
- MACD recovery and trendline support are downside risks near $12.50.
Chainlink price is stabilizing after reclaiming a critical long term support area. Technical analysts are currently watching a completed breakout and successful retest. Momentum indicators and ETF inflows are adding to a cautiously bullish outlook.
Chainlink Price Reclaims Key Support Zone
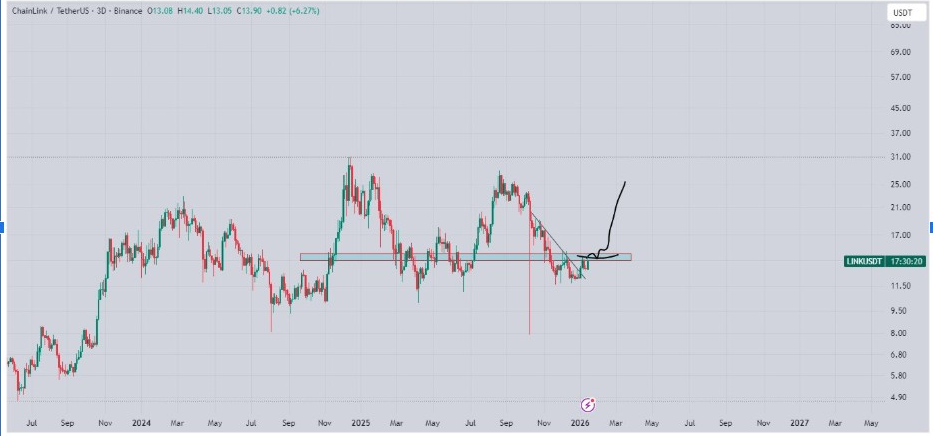
Chainlink price has moved back above the $13.00-$14.00 horizontal range. This zone previously capped upside attempts throughout 2024. Analysts now see it doing structural support.
World of Charts featured a clean trendline breakout with a retest. The analyst said LINK price flipped a previous resistance box into support around the $13.80 level. Price holding above this area adds to the bullish continuation case.
At the time of writing, the Chainlink price is trading close to $14.20-$14.25. A sustained hold above $14.00 continues to keep upside pressure intact, as failure below $13.50 would weaken the setup.
The structure is similar to previous accumulation phases preceding expansion rallies. Sharp directional moves often precede such formations. Therefore, traders stay focused on daily closes above the reclaimed zone.
Triangle Pattern Signals Breakout
On higher time frames, Chainlink price is compressing inside a symmetrical triangle. The butterfly chart identified a bounce from the bottom of the triangle near $12.80. This move implies that buyers are defending higher lows.

The upper resistance for the triangle is close to the $15.00 price level. A breakout above $15 could see rapid momentum expansion. Analysts see this level as the next major technical hurdle.
The trading volume trend has been steady during the consolidation. That pattern often indicates accumulation and not distribution.
Measured move projections from the triangle point to $20-$25. However, confirmation is required with a strong breakout candle. Until then, consolidation between $13.80 and $15 is still likely.
Momentum Indicators Turn Firmly Bullish
Momentum oscillators are aligning with a bullish structure. James Easton stated that LINK’s MACD has bottomed and turned up. Historically, similar setups had preceded multi-week rallies.
The analyst also pointed out a long-term trendline that was increasing towards $12.50. Chainlink price has respected this trendline since mid-2023. Each test has seen a lot of buying interest.
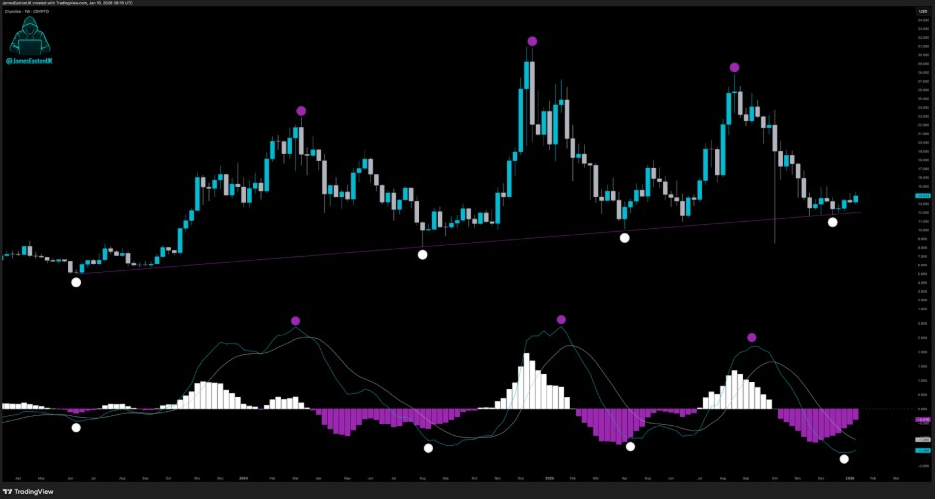
Chainlink price has also made higher lows above $12.80 and $13.20. That structure reflects improving market strength as downside risk is increasingly limited.
Easton called Chainlink “severely undervalued” at under $15. From a historical standpoint, LINK tends to accelerate after the momentum flip.
ETF Inflows Reinforce Upside Chainlink Price Targets
Institutional flows are now supporting the technical picture. ALLINCRYPTO reported on $2.59 million in inflows into Bitwise’s spot LINK ETF. The inflows occurred on the ETF’s first trading day.
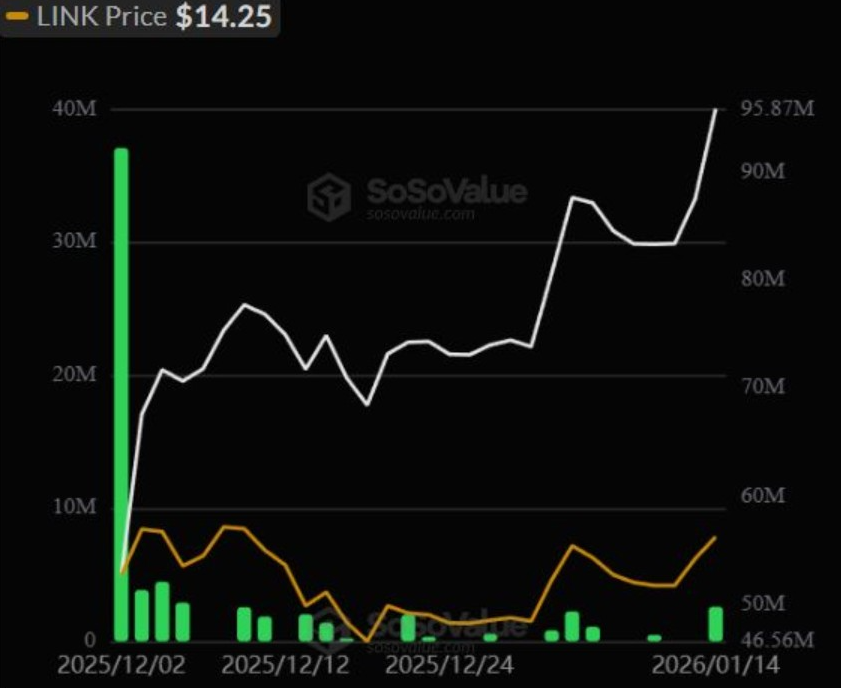
At the same time, the Chainlink price was around $14.25. Demand for ETFs helps to reduce selling pressure in the spot market. This dynamic can exaggerate breakout moves.
Analysts warn that the price still needs volume confirmation. A rejection near $15 could trigger another breakdown towards $13.80. However, bullish momentum remains intact as long as it stays above $14.
One analyst expected $15 to break decisively to start accelerating to $18. Beyond that, $20 becomes the next target. These levels are, however, conditional on sustained strength in the market.
The post Chainlink Price Eyes $20 Rally After Key Level Recovery & ETF Inflows appeared first on The Market Periodical.