


The market never lies; it only remains silent.
When the price hovers around a key level, both bulls and bears are waiting for an answer.
Over the past week, Bitcoin completed the wide-range consolidation we previously anticipated within the core range of $79,500 to $80,600, with market movement validating the effectiveness of the technical logic. However, validation is only the beginning—the real battle starts this week.
The daily chart adjustment structure of BTC stands at a crossroads: is it the beginning of a new upward wave, or a continuation of a larger-scale correction? Wave patterns can provide a framework, but the market ultimately votes with price. On the HYPE side, the seven-segment structure is clearly discernible; whether it breaks through the $45.76 level will be the most critical variable to watch this week.
This week, we’ll continue analyzing from a multi-timeframe perspective, clarifying structure, assessing direction, and preparing scenarios. The strategy is ready—maintain your rhythm.
This week's key trading insights summary:
• BTC multi-timeframe price structure analysis (see Part 1 for details)
• BTC this week's market outlook and short- to medium-term trading strategies. (See Part Two for details.)
• HYPE daily chart trend structure analysis. (See Part 3 for details)
• HYPE this week's market outlook and short-term trading strategy. (See Part 4 for details)
Last week's trading strategy and core viewpoints market validation:
• BTC Price Movement Forecast Verified by Market Action: In last week’s article, we highlighted the importance of observing the battle between bulls and bears around the key range of $79,500 to $80,600, and noted that a wide-ranging consolidation was likely. The current market movement largely confirms our earlier forecast.
I. Multi-Timeframe Price Structure Analysis of Bitcoin
1. Daily Chart Trend Structure Analysis for BTC: (Three Possible Wave Scenarios for BTC's Future Movement)
Bitcoin _ Daily K-line Chart:
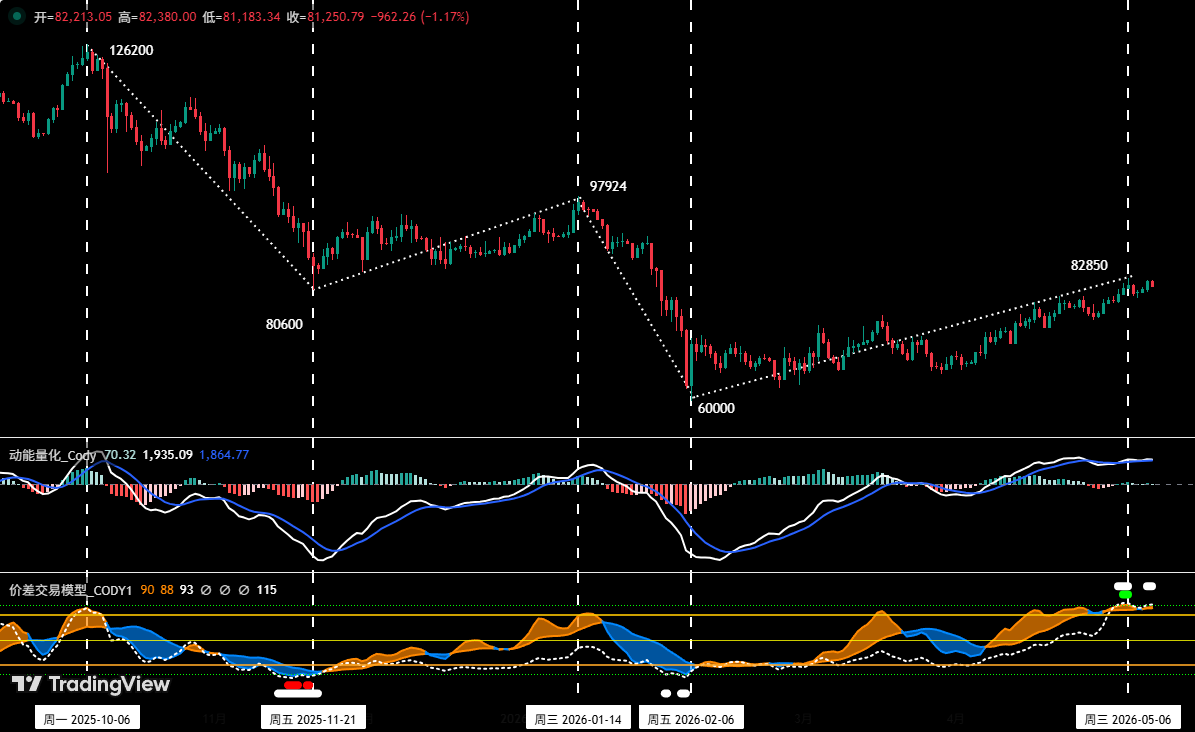
Figure 1
As shown in Figure 1, since reaching a high of $126,200 in October 2025, Bitcoin has entered a correction period of approximately seven months (216 days), with clear divergence in market sentiment regarding future price direction. Bears argue that the downtrend is not yet over and that, following the recent rebound, prices will resume their decline and break below the $60,000 low. Bulls, however, believe the correction that began at $126,200 has ended at $60,000, with a reversal of the corrective trend occurring at this level, and that the rebound since February marks the beginning of a new uptrend. Below, we analyze the daily chart correction structure according to Elliott Wave principles and present three technical scenarios for future price movement for your reference.
① Scenario 1: Adjustment concludes, new upward wave begins (bullish perspective)
This view holds that the daily-level correction starting from the previous high of $126,200 has completed an A-B-C three-wave structure, with wave C concluding at $60,000, and we are currently in the process of wave I (the initial upward impulse wave).
• Wave A (decline): $126,200 (October 6, 2025) to $80,600 (November 21, 2025), lasting 46 days, with a maximum decline of approximately 36%.
• Wave B (rebound wave): $80,600 (November 21, 2025) to $97,924 (January 14, 2026), lasting 54 days, with a maximum gain of approximately 21.5%.
• Wave C (decline): $97,924 (January 14, 2026) to $60,000 (February 6, 2026), lasting 23 days, with a maximum decline of approximately 38.7%.
• Wave I (upward impulse): From $60,000 (2026-02-06) to present, lasting 94 days with a maximum gain of approximately 38.1%, and still ongoing.
• Potential Major Wave II (corrective wave): After the completion of the major Wave I rally, the upcoming corrective wave is expected to find support above $60,000.
② Scenario 2: A five-wave complex correction structure, currently in wave D rebound (one of the bearish viewpoints)
This view suggests that the daily-level correction starting from the previous high of $126,200 may complete in a five-wave A-B-C-D-E structure, and we are currently in the D-wave rebound.
• Wave A (decline): $126,200 (October 6, 2025) to $80,600 (November 21, 2025), lasting 46 days, with a maximum decline of approximately 36%.
• Wave B (rebound wave): $80,600 (November 21, 2025) to $97,924 (January 14, 2026), lasting 54 days, with a maximum gain of approximately 21.5%.
• Wave C (impulse down): $97,924 (January 14, 2026) to $60,000 (February 6, 2026), lasting 23 days, with a maximum decline of approximately 38.7%.
• Wave D (impulse wave): Since June 6, 2026, at $60,000, it has been ongoing for 94 days with a maximum gain of approximately 38.1% and is still in progress.
• Potential Wave E (corrective wave): The upcoming corrective wave following the completion of Wave D's rebound may decline below $60,000.
③ Scenario 3: A larger-scale correction structure (e.g., weekly timeframe), currently in Wave B rebound (Bearish View #2)
This view suggests that the daily-level correction starting from the previous high of $126,200 may form a larger A-B-C three-wave structure, and we are currently in the B-wave rebound.
• Wave A (decline): $126,200 (October 6, 2025) to $60,000 (February 6, 2026), lasting 112 days, with a maximum decline of approximately 52.5%.
• Wave B (rebound wave): From $60,000 (2026-02-06) to present, lasting 94 days, with a maximum gain of approximately 38.1% during this period; currently still in progress.
• Potential Wave C (decline): The upcoming correction wave following the completion of Wave B's rebound may drop below $60,000.
④. Summary:
• From the perspective of Elliott Wave theory’s time rules and structural harmony, in Scenario Two, waves B and D are of the same level as corrective rallies; however, the current D-wave rally period (94 days) has significantly exceeded the B-wave rally period (54 days). Therefore, due to the excessive time extension of the D wave, the structural balance of the wave pattern has been disrupted, substantially reducing the likelihood of this scenario occurring.
• Based on the above analysis, if Scenario Two is excluded, the probabilities of Scenario One (bullish) and Scenario Three (bearish) increase accordingly. Which of the two is more likely depends on a comprehensive assessment across multiple dimensions, which we will analyze in depth in next week’s review.
2. In-depth Analysis of BTC Hourly Price Structure: (Analysis period: 4 hours)
Bitcoin 4-hour K-line chart
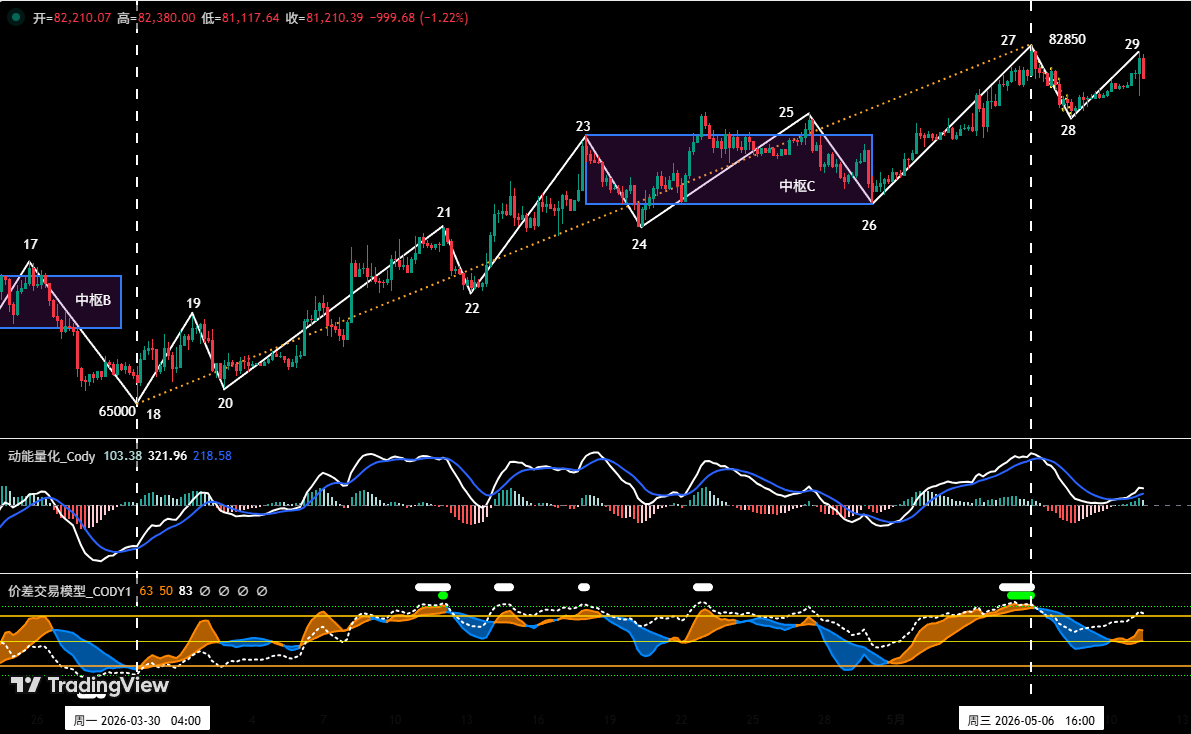
Figure 2
As shown in (Figure 2), the current price is above the central zone C and is in the 28-29 segment.
• If the price effectively holds above the upper boundary of the central range C (approximately $78,500), the high-range wide consolidation pattern will be maintained.
• If the price effectively breaks below the lower boundary of the central range C (approximately $75,000), a daily-level correction may begin.
II. Bitcoin Weekly Market Forecast and Trading Strategy
1. BTC Weekly Price Movement Forecast:
This week's key insight: The critical factor this week is observing the battle between bulls and bears for control of the upper and lower boundaries of the central zone C. Whether this area is held or lost can serve as a key indicator of whether the price will continue its rebound or shift into a downward correction.
2. Key resistance level:
• First resistance zone: $83,500–$84,500 range (previous area of high trading volume between bulls and bears)
• Second resistance zone: $89,000 to $90,500 range (previous consolidation platform)
3. Key Support Level:
• First support level: $78,500–$79,500 range (near the upper boundary of the central zone)
• Second support level: $73,500–$75,000 range (previous key support level)
• Third support level: $69,500–$70,500 range (previous key support level)
4. This Week’s Trading Strategy (Excluding Impact from Sudden News)
①. Medium-term strategy:
Bitcoin _ Daily K-line Chart: (Position Monitoring Model)
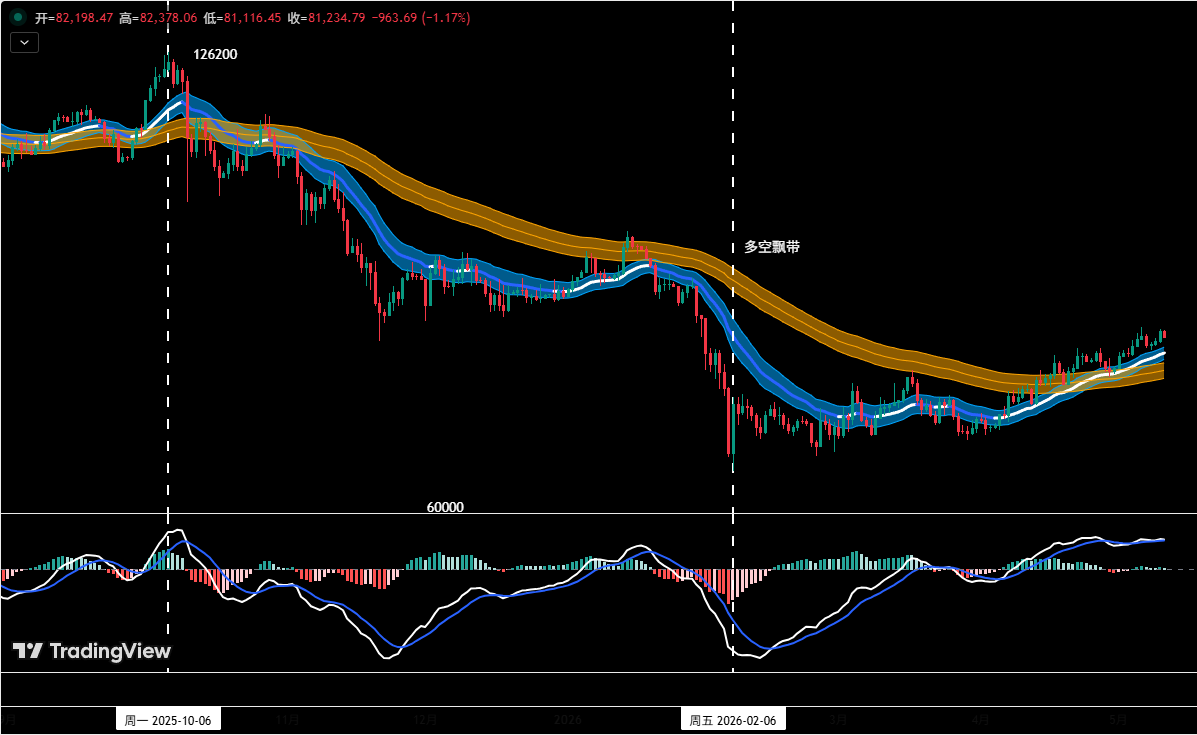
Figure 3
Position Monitoring Model: As shown in (Figure 3), based on the trading rules, the market's intermediate-term trend remains unclear; therefore, the intermediate-term strategy this week is to remain out of the market and wait patiently for a clearer direction before entering positions—avoid chasing price spikes or selling in panic.
② Short-term strategy: Use a 30% position size, set stop-loss levels, and identify spread opportunities based on support and resistance levels. (Use a 30-minute or 60-minute time frame for trading.)
③. For short-term trading, to dynamically respond to the complex evolution of the market, we have pre-established two specific operational plans, A and B.
• Option A: Hold firmly and go long on dips.
• Open position: When the price firmly holds above the $78,500–$79,500 range, combined with a bottom signal from the quantitative model, establish a long position of less than 20%.
• Risk Management: Initial stop-loss set below $78,500.
• Close positions: When the price rebounds near a key resistance level and aligns with model signals, gradually close positions to realize profits.
• Option B: Effective breakdown below support; sell rallies at higher levels.
• Open position: When the price effectively breaks below the $73,500–$75,000 support zone and confirms a top signal from the model, consider establishing a short position of less than 30%.
• Risk Management: Initial stop-loss set above $76,500.
• Close positions: When the price declines to a key support level combined with model signals, gradually close positions to realize profits.
III. HYPE Daily Chart Trend Structure Analysis:
HYPE_ Daily K-line Chart
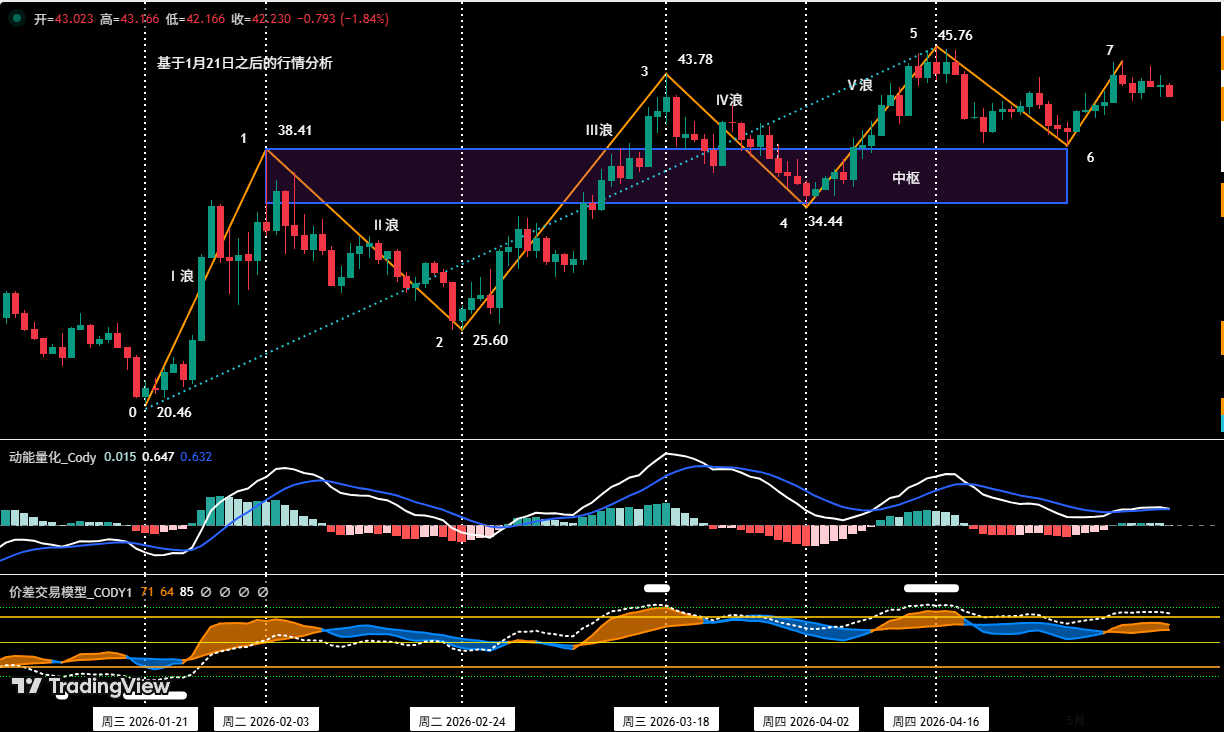
Figure 4
1. As shown in Figure 4, the upward movement of HYPE since its low of $20.46 on January 21 can be divided into a seven-segment structure on the daily chart: 0-1, 1-2, 2-3, 3-4, 4-5, 5-6, and 6-7. In the first five segments, price continuously made higher highs, forming an ascending oscillation structure; in the last two segments, since endpoint 7 ($44.79) is lower than endpoint 5 ($45.76), it is currently regarded as an adjustment structure.
2. As shown in Figure 4, since the three segments—1-2, 2-3, and 3-4—overlap, they collectively form an "upward central range."
Four: HYPE Weekly Market Outlook and Short-Term Trading Strategy
1. HYPE this week's price trend forecast:
This week's HYPE key insights:
• Pay close attention to whether the price can break above the previous high of $45.76 in subsequent movements. If it breaks through, the current trend remains within a daily bullish structure.
• Pay attention to the battle between longs and shorts near the upper and lower bands of the central zone.
2. HYPE This Week's Short-Term Trading Strategy:
• This week’s short-term trading strategy will be based on whether the price holds or breaks through the key levels of the upper boundary of the central range ($38.41) and the lower boundary of the central range ($34.44).
• Long strategy: If the coin price rebounds near $38.41, shows signs of stabilization, and aligns with bottom signals triggered by two models, consider initiating a small long position with a position size under 30%, and strictly adhere to stop-loss discipline.
• Short strategy: If the price effectively breaks below the support near $34.44, combined with top signals triggered by two major models, consider a light short position with a position size under 30%, and strictly adhere to stop-loss discipline.
Five: Special Notice:
1. When opening a position: Set the initial stop-loss immediately.
2. When profit reaches 1%: Move the stop-loss to the entry price (breakeven point) to secure your principal.
3. When profit reaches 2%: Move the stop-loss to the 1% profit level.
4. Continuous tracking: For every additional 1% profit in price, the stop-loss level moves up by 1% simultaneously, dynamically protecting and locking in gains.
Financial markets are constantly changing; all market analyses and trading strategies must be adjusted dynamically. All views, analytical models, and trading strategies mentioned in this article are derived from personal technical analysis and are intended solely for personal trading logs; they do not constitute any investment advice or basis for action. The market carries risks—invest with caution and do not make decisions based on this information.