


Author: CryptoPunk
A five-year backtest tells you: 3x leverage offers almost no cost-effectiveness.
Conclusion first:
In the backtest over the past five years, the final return of BTC with a triple leveraged regular investment was only slightly higher than that with a double leveraged investment. 3.5%, but paid The cost of risk approaching zero.
If we consider the risk, return, and feasibility comprehensively—Spot dollar-cost averaging is actually the optimal long-term solution; 2x is the extreme; 3x is not worth it.
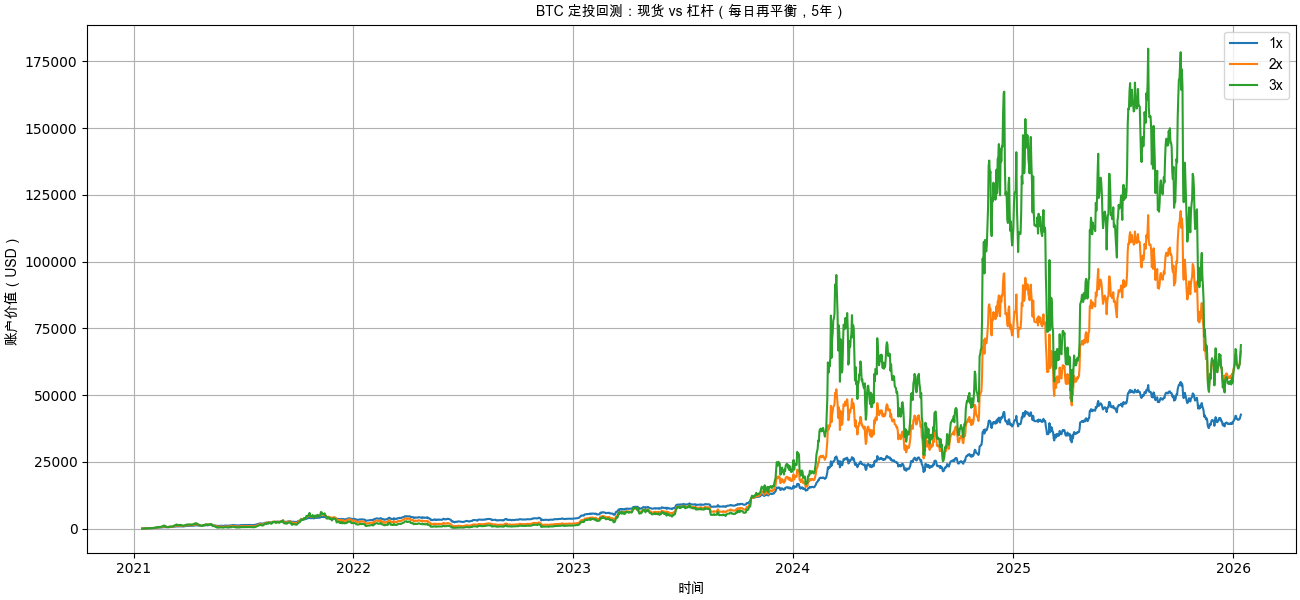
Five-Year Regular Investment Net Value Curve: 3x Has Not "Created a Gap"
| Key Metrics | 1x Spot | 2x Leverage | 3x Leverage |
| Final Account Value (Final Value) | $42,717.35 | $66,474.13 | $68,832.55 |
| Total Invested | $18,250.00 | $18,250.00 | $18,250.00 |
| Total Return | 134.07% | 264.24% | 277.16% |
| Compound Annual Growth Rate (CAGR) | 18.54% | 29.50% | 30.41% |
| Maximum Drawdown (Max Drawdown) | -49.94% | -85.95% | -95.95% |
| Sortino Ratio | 0.47 | 0.37 | 0.26 |
| Calmar Ratio | 0.37 | 0.34 | 0.32 |
| Ulcer Index | 0.15 | 0.37 | 0.51 |
From the net asset value (NAV) trend, we can intuitively see that:
Spot (1x)The curve smoothly rises with controllable drawdowns.
2x Leverage: Significantly increase returns during the bull market phase
3x LeverageMultiple instances of "crawling close to the ground," and long-term consumption by fluctuations.
Although in the rebound of 2025–2026, the 3x ultimately slightly outperformed the 2x,
ButFor years, the net asset value of 3x has consistently lagged behind that of 2x..
Note: In this backtest, the leverage part uses a daily rebalancing approach, which may result in volatility drag.
This means:
The ultimate success of 3x heavily relies on the "final stretch of the market."
II. Final Profit Comparison: The Marginal Returns of Leverage Decline Rapidly
| Strategy | Final asset | Total Investment | CAGR stands for **Compound Annual Growth Rate**, |
|---|---|---|---|
| 1x Spot | $42,717 | $18,250 | 18.54% |
| 2x Leverage | $66,474 | $18,250 | 29.50% |
| 3x Leverage | $68,833 | $18,250 | 30.41% |
The key is not "who benefits the most," but rather...How much extra is there?:
1x → 2x: Earn an additional ≈ $23,700
2x → 3x: Only a little more ≈ $2,300
The returns have almost stopped growing, but the risks are increasing exponentially.
III. Maximum Drawdown: 3X is Approaching "Structural Failure"
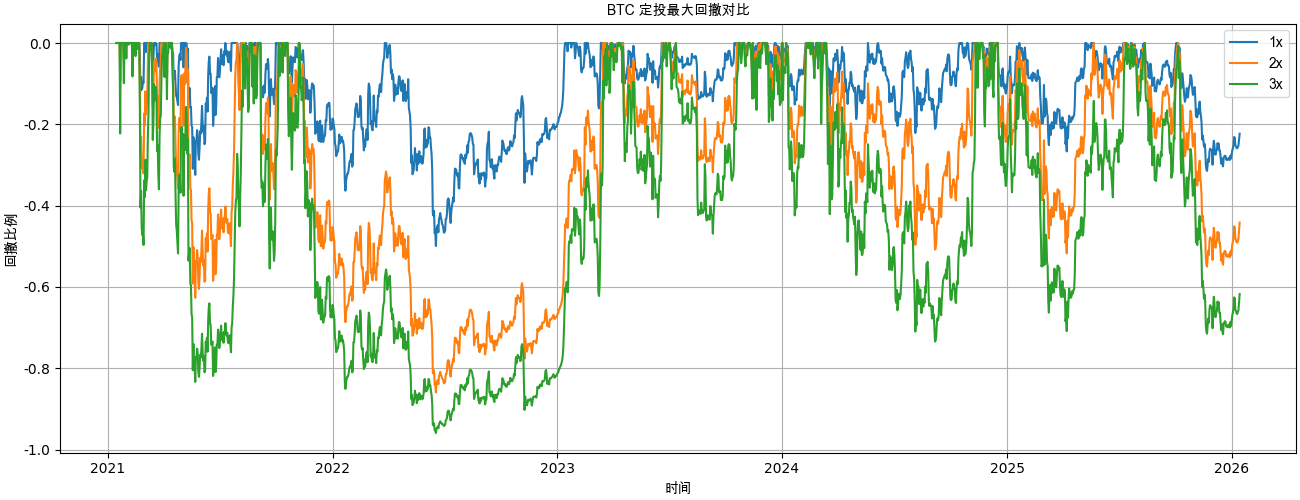
| Strategy | Maximum Drawdown |
|---|---|
| 1x | -49.9% |
| 2x | -85.9% |
| 3x | -95.9% |
There is a very critical practical issue here:
-50%: Psychologically tolerable
-86%: Needs +614% to break even
-96%: Need +2400% to break even
3x leverage during the 2022 bear market,Fundamentally, it has already "mathematically bankrupted.",
Subsequent profits have almost entirely come from new capital invested after the bottom of the bear market.
IV. Risk-Adjusted Returns: Cash Is Actually the Best
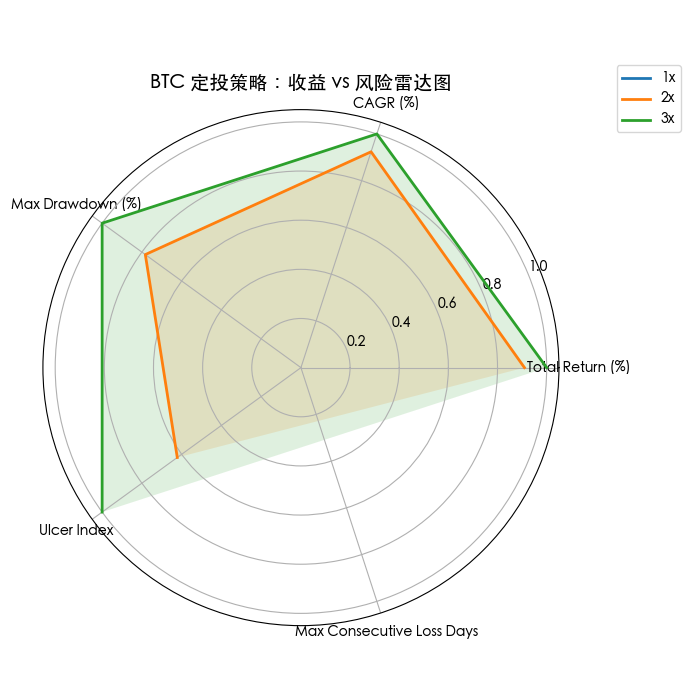
| Strategy | Sortino | Ulcer Index |
|---|---|---|
| 1x | 0.47 | 0.15 |
| 2x | 0.37 | 0.37 |
| 3x | 0.26 | 0.51 |
This set of data indicates three things:
The spot unit risk-return is the highest.
The higher the leverage, the worse the "cost-effectiveness" of the downside risk.
3x has been in a deep drawdown area for a long time, causing immense psychological pressure.
The "Ulcer Index" is a technical indicator used in financial markets to measure the magnitude and duration of drawdowns in an investment or portfolio. It helps assess the emotional stress or "ulcer" that an investor might experience during a period of declining value. An Ulcer Index value of 0.51 indicates a relatively low level of drawdown risk or emotional stress. Here's a
The account has been "underwater" for a long time, giving you almost no positive feedback.
Why does the 3x leveraged product perform so poorly in the long term?
The reason is just one sentence:
Daily Rebalancing + High Volatility = Continuous Loss
In a volatile market:
Rise → Add Position
Fall → Reduce Position
No rise, no fall → the account continues to shrink.
This is a typical example.Volatility Drag.
And its destructive power is related to the leverage multiple.squareProportional.
In high-volatility assets like BTC,
Using 3x leverage incurs a 9x volatility penalty.
Final conclusion: BTC itself is already a "high-risk asset."
The answer from this five-year backtest is very clear:
Spot Fixed InvestmentThe risk-return ratio is optimal, and it can be implemented in the long term.
2x LeverageRadical upper limit, suitable only for a few people
3x Leverage: Very low long-term cost-effectiveness, not suitable as a regular investment tool
If you believe in the long-term value of BTC,
Therefore, the most rational choice is often not "adding another layer of leverage,"
But ratherLet time be on your side, not your enemy..