


This week, the crypto market continues to trade in a high-range consolidation, with growing divergence between bulls and bears, making a directional breakout imminent. After stabilizing and rebounding at the 32 endpoint ($38.88), HYPE’s ability to break above $43.17 and challenge the prior high of $45.76 will be critical to determining whether the daily V-wave structure can continue. Meanwhile, BTC, having completed its D-wave rebound, faces a decisive test at the core pivotal range of $79,500–$80,600: a breakout could trigger a major shift, while failure to hold may lead to a pullback—once direction is confirmed, the market could enter a pronounced single-sided trend.
The current market presents both opportunities and risks—avoid chasing price spikes or panic-selling. Only by relying on clear structural analysis and strict discipline can you identify reliable opportunities and achieve steady, long-term success in a volatile environment.
This week's key trading insights summary:
- HYPE hourly chart structure deep analysis (see Part 1 for details)
- HYPE Weekly Market Outlook and Short-Term Trading Strategy (see Part Two for details)
- BTC multi-timeframe price structure analysis (see Part 3 for details)
- BTC Weekly Market Outlook and Short- to Medium-Term Trading Strategies (see Part 4 for details)
Last week's trading strategy and core viewpoints market validation:
- HYPE short-term trading performance: HYPE executed a short-term long position (1x leverage) last week, achieving a profit of approximately 3.25% (see Table 1 for details).
- BTC medium-term trading performance verification: Last week, the Bitcoin medium-term strategy executed a position closure as planned. After the price stabilized above the bullish-bearish ribbon, we closed all medium-term short positions established at $89,000 (1x leverage) near $75,500, resulting in a final profit of approximately 15.17%.
- BTC price trend forecast validated by market action: In last week’s article, we indicated that the market would remain in a wide range-bound trading pattern between $73,500 and $79,000. The current market movement confirms our earlier forecast.
I. HYPE: In-Depth Analysis of Hourly-Level Price Structure
HYPE_4 hour K-line chart
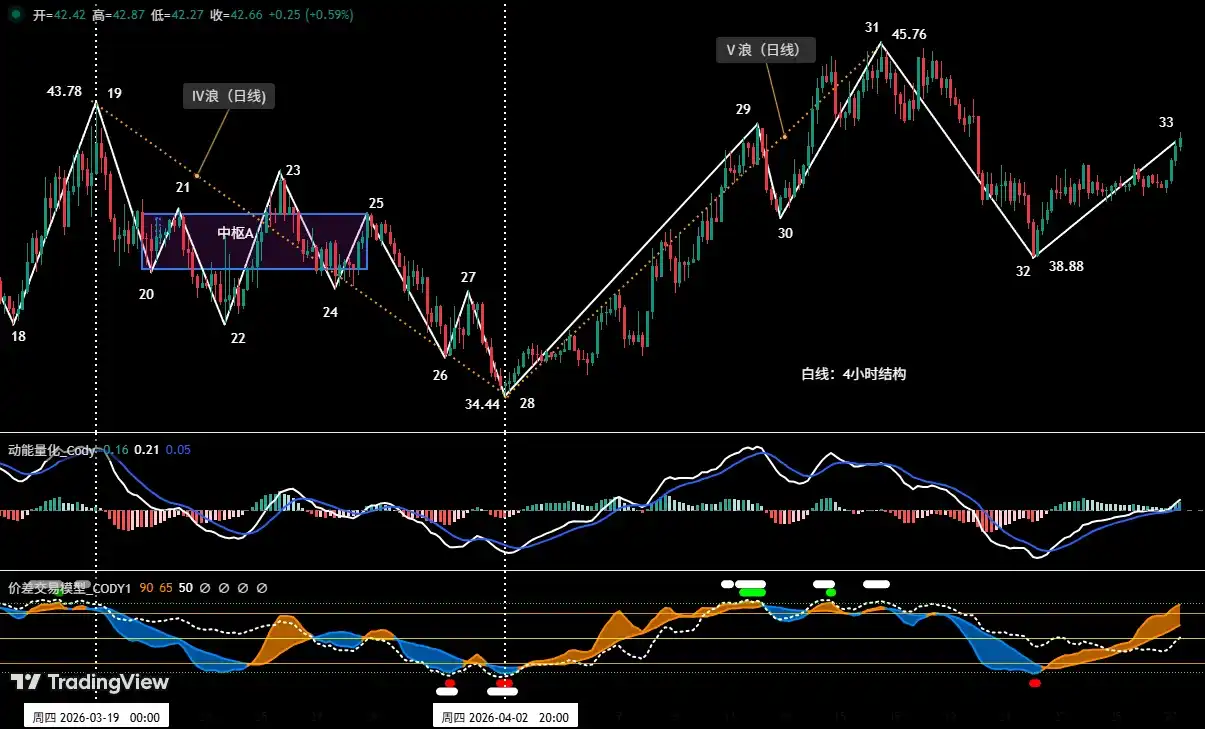
Figure 1
1. As shown in (Figure 1), the daily-level Wave V rally that began at the April 2 low of $34.44 can be further subdivided on the 4-hour chart into a five-phase upward structure: 28-29, 29-30, 30-31, 31-32, and 32-33. The market is currently in the 32-33 upward phase.
2. On the 4-hour chart, a key shift in price action occurred last week: endpoint 32 ($38.88) rapidly broke below endpoint 30 ($40.17). Subsequently, buying pressure emerged at the strong support zone near $38.50, pushing the price back above $40.17. The next focus is on the sustainability of this rebound:
- If the price continues to rise and successively breaks through $43.10 and the previous high of $45.76, the daily-level Wave V uptrend that began at the April 2 low will be sustained.
- If the current rebound lacks strength and fails to effectively break through and make a new high, it may form a classic reversal structure characterized by “a pullback breaking below the previous low with a rebound failing to make a new high.” If this pattern is confirmed, it suggests that the daily uptrend beginning on January 21 is likely to end, and the market may enter a daily-level correction cycle.
II. HYPE: Market Outlook and Short-Term Trading Strategy for This Week
1. HYPE this week's price movement forecast:
This week's HYPE key insight: Focus on the rebound momentum and level starting from endpoint 32 ($38.88).
If the rebound is strong and the price effectively breaks above and holds above the previous high of $45.76 (Point 31), it indicates strong buying pressure, suggesting that the fifth wave of the daily bullish structure is continuing, with potential to open new upside territory, next resistance near $50.
If the rebound lacks strength and price fails to surpass the previous high of $45.76, be alert for the formation of a technical pattern known as "rebound without a new high." This could indicate that the daily-level uptrend, which began at the January 21 low, is losing momentum, with $45.76 potentially marking the peak of this rally, and the market may shift into a daily-level consolidation or sideways trading range.
2. HYPE This Week's Short-Term Trading Strategy:
- Based on the expectation of an overall market uptrend, short-term trading should follow the principle of “going with the trend and buying on dips.”
- Based on signals from our proprietary quantitative model, with a 30-minute/60-minute trading cycle, use a 30% position size to capture long entry opportunities.
- Open position strategy: If HYPE’s price this week effectively breaks above $43.17 and holds steady, combined with buy signals triggered by two models, consider entering a long position with a position size under 30%, and strictly adhere to stop-loss discipline.
Three: Bitcoin: Multi-Timeframe Price Structure Analysis
1. BTC Daily Chart Trend Structure Analysis: (Based on the price action after the low on February 6, 2026)
Bitcoin _ Daily K-line Chart:
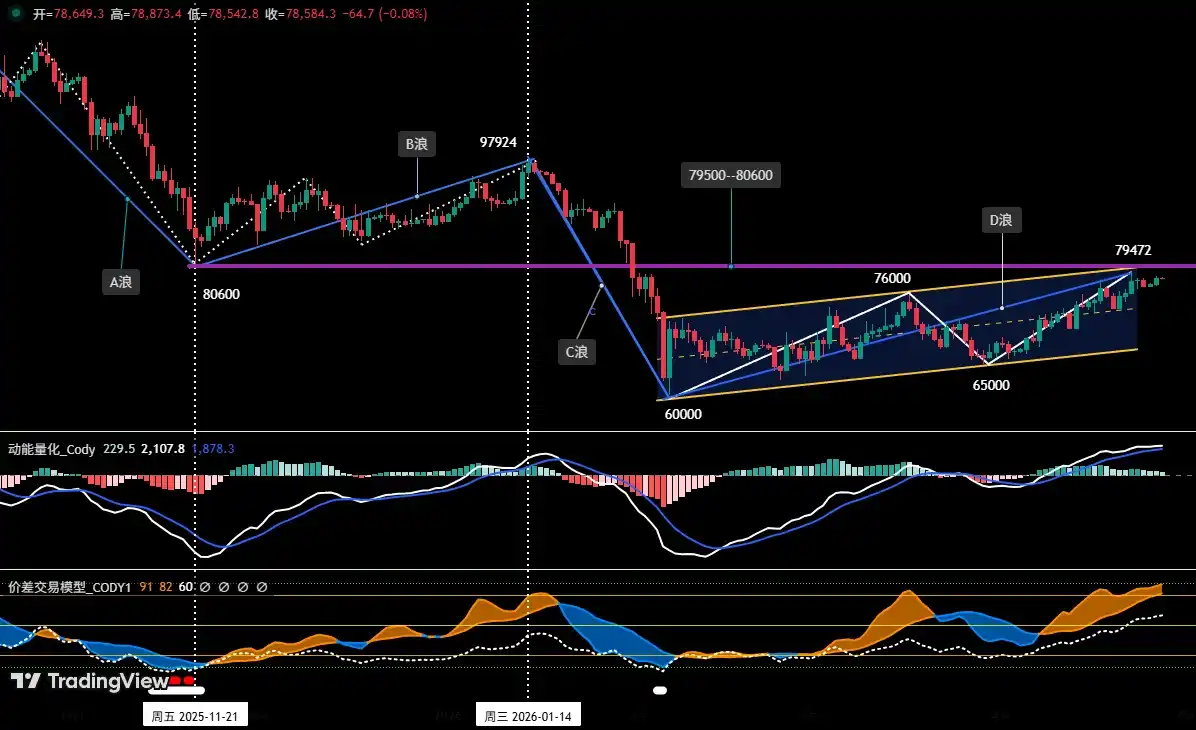
Figure 2
From the daily chart structure, the correction that began at the October 2025 high of $126,200 and reached the low of $60,000 on February 6 has formed a clear A-B-C three-wave structure. The $80,600 level was not only a key low on November 21, 2025, but also the starting point for the subsequent B-wave rally, making it technically significant. Therefore, the current price is facing resistance in the $79,500 to $80,600 range, which has now become the market’s critical “watershed” zone.
Wave D (recovery wave): Based on the daily chart structure, the rally that began from the February 6 low of $60,000 can be temporarily defined as Wave D (recovery wave). This rally has lasted approximately 80 trading days and reached a new high of $79,472 on April 22.
As shown in (Figure 2), this D-wave rally has consistently followed a well-defined upward channel: the lower boundary is formed by connecting the lows of February 6 and March 29, while the upper boundary is a parallel line drawn through the high of March 17. The price is currently approaching the upper boundary of the channel.
Summary: The current price is facing dual resistance from the upper boundary of the channel and the $79,500 to $80,600 resistance zone, making a direct breakout challenging. Particular attention should be paid to whether the $79,500 to $80,600 zone can be effectively broken, as this will determine whether the rebound since the February 6 low is a technical correction or a trend reversal, and ultimately whether $60,000 has been confirmed as the final low of this daily-level adjustment.
2. In-depth Analysis of BTC Hourly Price Structure: (Analysis Period: 4 Hours)
Bitcoin 4-hour K-line chart
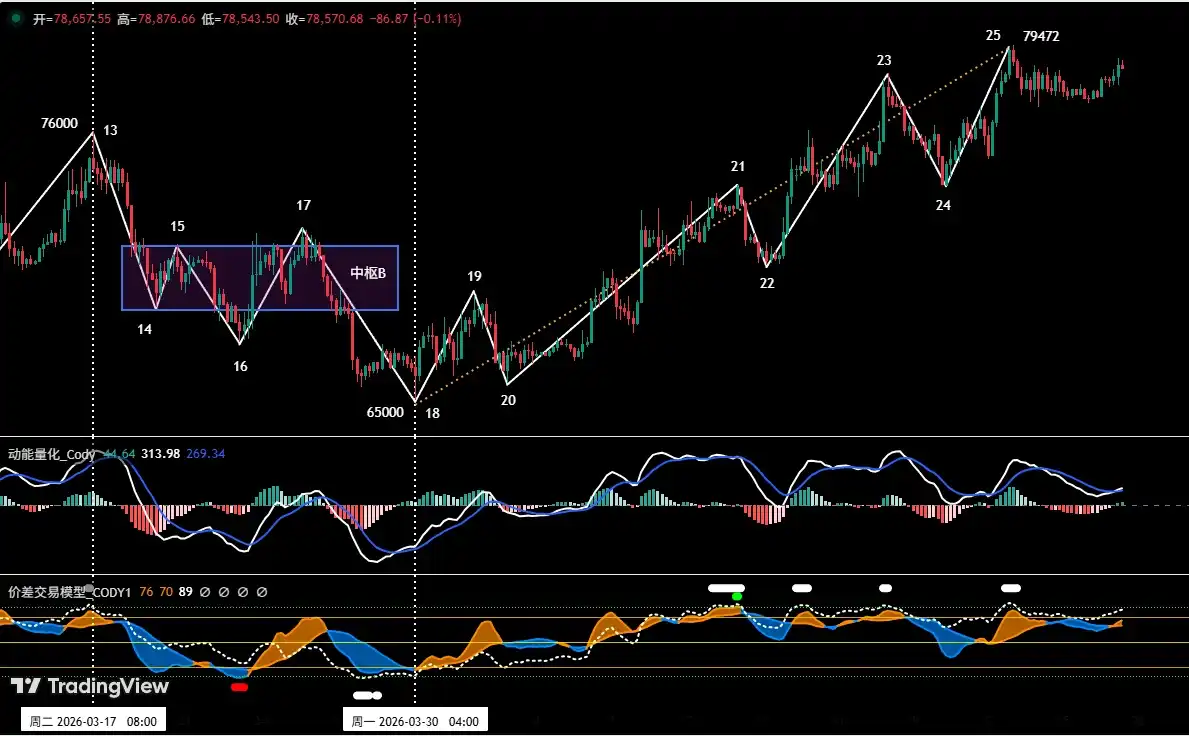
Figure 3
Following the price action after the March 30 low of $65,000. As shown in Figure 3, BTC initiated an upward oscillating trend from the March 30 low of $65,000, forming seven distinct structures from endpoint 18 to endpoint 25: 18-19, 19-20, 20-21, 21-22, 22-23, 23-24, and 24-25.
(Figure 3) shows: First, the price structure from endpoint 18 to endpoint 25 is relatively complete (having completed 7 segments); second, according to our proprietary spread trading model, endpoint 25 has triggered a top warning signal (white dot in the chart); third, based on the momentum quantification model, comparing the upward momentum between the adjacent segments 22-23 and 24-25, the model has issued a momentum bearish divergence signal.
Summary: Based on the hourly chart structure and the three reasons above, BTC is likely to undergo a correction after encountering resistance at this level.
Four: Bitcoin Market Forecast and Trading Strategy for This Week
1. BTC Weekly Price Movement Forecast:
This week's key insight: Focus on the outcome of the test at the key resistance zone of $79,500 to $80,600.
- If the price breaks upward, wait for it to convincingly stabilize before considering entry;
- If it rebounds here under pressure, the primary support is near $76,000; if this level is convincingly broken, the market may enter a daily-level correction.
2. Key resistance level:
• First resistance zone: $79,500–$81,000 area (near the November 2025 low)
• Second resistance zone: $83,500 to $84,500 range (previous area of high trading volume between longs and shorts)
3. Key Support Level:
• First support level: around $76,000 (previous rebound high)
• Second support level: around $73,500 (previous key support level)
• Third support level: $69,500–$70,500 range (previous key support level)
4. This Week’s Trading Strategy (Excluding Impact from Sudden News)
①. Medium-term strategy:
Bitcoin _ Daily K-line Chart: (Position Monitoring Model)
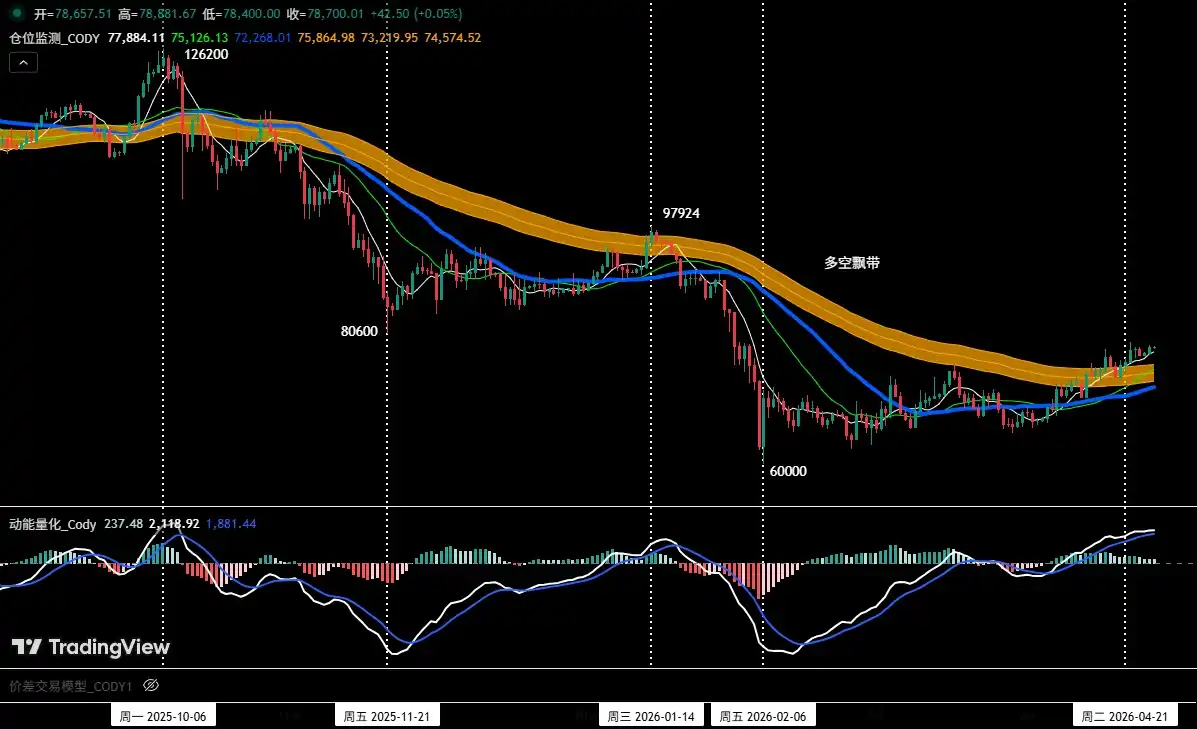
Figure 4
Position Monitoring Model: As shown in (Figure 4), the current asset price has stabilized above the long-short ribbon. Based on our strategy rules, we have paused new medium-term positions this week and are now holding a cash position. We recommend patiently waiting for further clarity on market direction before making any decisions.
② Short-term strategy: Use a 30% position size, set stop-loss levels, and identify spread opportunities based on support and resistance levels. (Use a 30-minute or 60-minute time frame for trading.)
③ Given the assessment that the current market is in a high-range consolidation with weakening upward momentum, short-term trading will continue to follow the principle of "trading with the trend by going short." To dynamically respond to the market’s complex evolution, we will strictly adhere to signals from our proprietary trading model and pre-prepare two specific action plans, A and B.
• Option A: Rebound meets resistance; sell on rallies.
• Open Position: When the price rebounds to the $79,500–$80,600 range and triggers a resistance signal combined with a model top signal, establish a 30% short position.
• Risk Management: Initial stop-loss set above $81,000.
• Close positions: When the coin price approaches a key support level in conjunction with model signals, gradually close positions to realize profits.
• Option B: Trend-following short position on breakout.
• Open Position: As the price continues to adjust, if it effectively breaks below the support near $76,000 and is confirmed by model top signals, consider establishing a 30% short position.
• Risk Management: Initial stop-loss set above $77,500.
• Close positions: When the price declines to the support level and aligns with model signals, gradually close positions to realize profits.
Five: HYPE: Post-Trade Review
1. Short-term Trading Review: (See Table 1)
We strictly followed our operational protocol and executed a short-term (long) trade last week based on trading signals generated by our proprietary spread trading model and momentum quantification model, achieving a profit of 3.25%.
2. HYPE Short-Term Trading Activity Summary: (Leverage *1x)
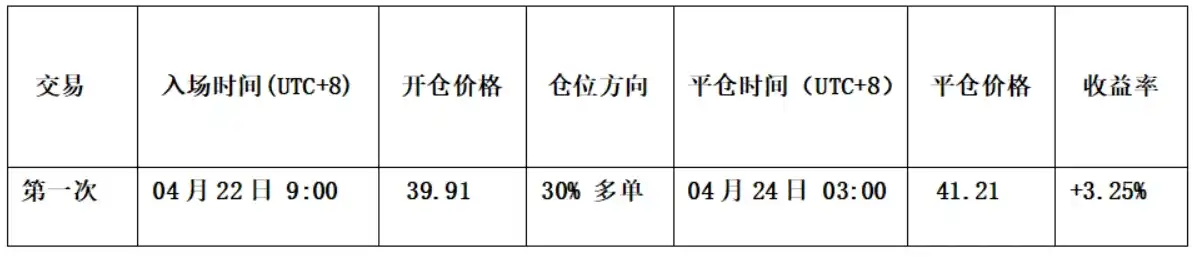
Table 1
3. Short-term Trading Review: (See Figure 5)
Open position strategy: First, the prior price movement has completed a full five-segment corrective structure; second, the spread trading model has issued a strong bottom warning signal in advance (red and white dots in the chart); third, the momentum quantification model has triggered a bullish divergence signal. Therefore, we established a 30% long position at $39.91.
Close position strategy: When the price approached $42 and encountered resistance, while the momentum quantification model triggered a bearish divergence signal, we closed our entire position near $41.21.
Summary: This transaction resulted in a profit of approximately 3.25%.
HYPE 60-minute K-line chart: (Momentum Quantitative Model + Spread Trading Model)
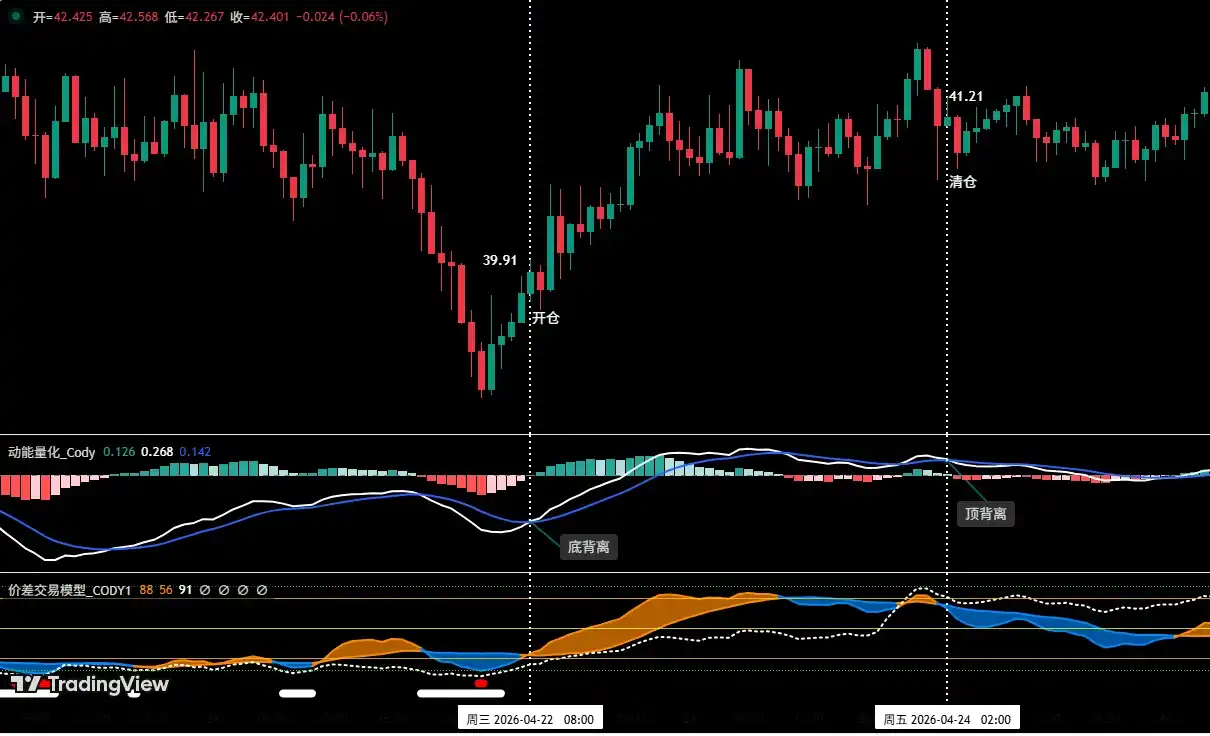
Figure 5 (Short-term trading diagram)
Six, Special Notice
- When opening a position: Set the initial stop-loss immediately.
- When profit reaches 1%: Move the stop-loss to the entry price (breakeven point) to secure your principal.
- When profit reaches 2%: move the stop-loss to the 1% profit level.
- Track continuously: For every additional 1% profit in price, move the stop-loss level by 1% to dynamically protect and lock in gains.
Financial markets are constantly changing; all market analysis and trading strategies must be adjusted dynamically. All views, analytical models, and trading strategies mentioned in this article are based on personal technical analysis and are intended solely for personal trading logs; they do not constitute any investment advice or basis for action. The market carries risks—invest with caution and do not make decisions based on this information.