


At the close of trading on Monday, April 6, 2026, the stock price of Blue Owl Capital (OWL), a leading U.S. private credit asset manager, fell to $8.45, marking a new all-time low for the weekly chart, with intraday lows dipping to $7.80. This selling pressure was triggered by Blue Owl’s disclosure the previous Thursday of redemption data for its semi-liquid funds. For the quarter, the company’s two primary non-traded BDCs (Business Development Companies)—OTIC (Blue Owl Technology Income) and OCIC (Blue Owl Credit Income)—received aggregate redemption requests totaling approximately $5.4 billion. OTIC experienced a redemption rate of 40.7% of its outstanding shares, while OCIC saw a rate of 21.9%. Both funds simultaneously triggered the industry’s mandatory 5% redemption cap, allowing only slightly less than $1.2 billion in redemptions to be processed on a pro-rata basis.
Mainstream financial media immediately framed the event as the “retail private credit narrative collapsing” and “AI disrupting software companies spilling over to creditors.” But these two labels obscure something far more critical. In the same week, Goldman Sachs Private Credit Corp, a subsidiary of Goldman Sachs Asset Management, reported redemption requests accounting for just 4.999% of its first-quarter assets—0.001 percentage point below the 5% redemption gate, making it one of the few, possibly the only, large semi-liquid perpetual BDCs to avoid triggering its gate and fully honor redemptions. This redemption wave was not a “private credit collapse,” but a clear K-shaped divergence.
According to Bloomberg on April 6, Goldman Sachs’ $15.7 billion fund was an outlier this quarter for having “Dodged the Exodus.” Meanwhile, Blue Owl’s OTIC redemption rate was 8.1 times that of Goldman Sachs, and its OCIC rate was 4.4 times higher. While market attention has focused entirely on Blue Owl’s steep decline, the more pertinent question is why two institutions with identical structures, the same week, and the same 5% gate have ended up with completely different outcomes.
The stock price has lost two-thirds over fifteen months.
First, examine the market's valuation of Blue Owl. According to Yahoo Finance's historical weekly data, Blue Owl Capital (OWL) closed at $25.02 for the week of January 20, 2025, reaching a historical peak. By the week of April 6, 2026, it closed at $8.45, a 66.2% decline over fifteen months, erasing nearly two-thirds of its market value.
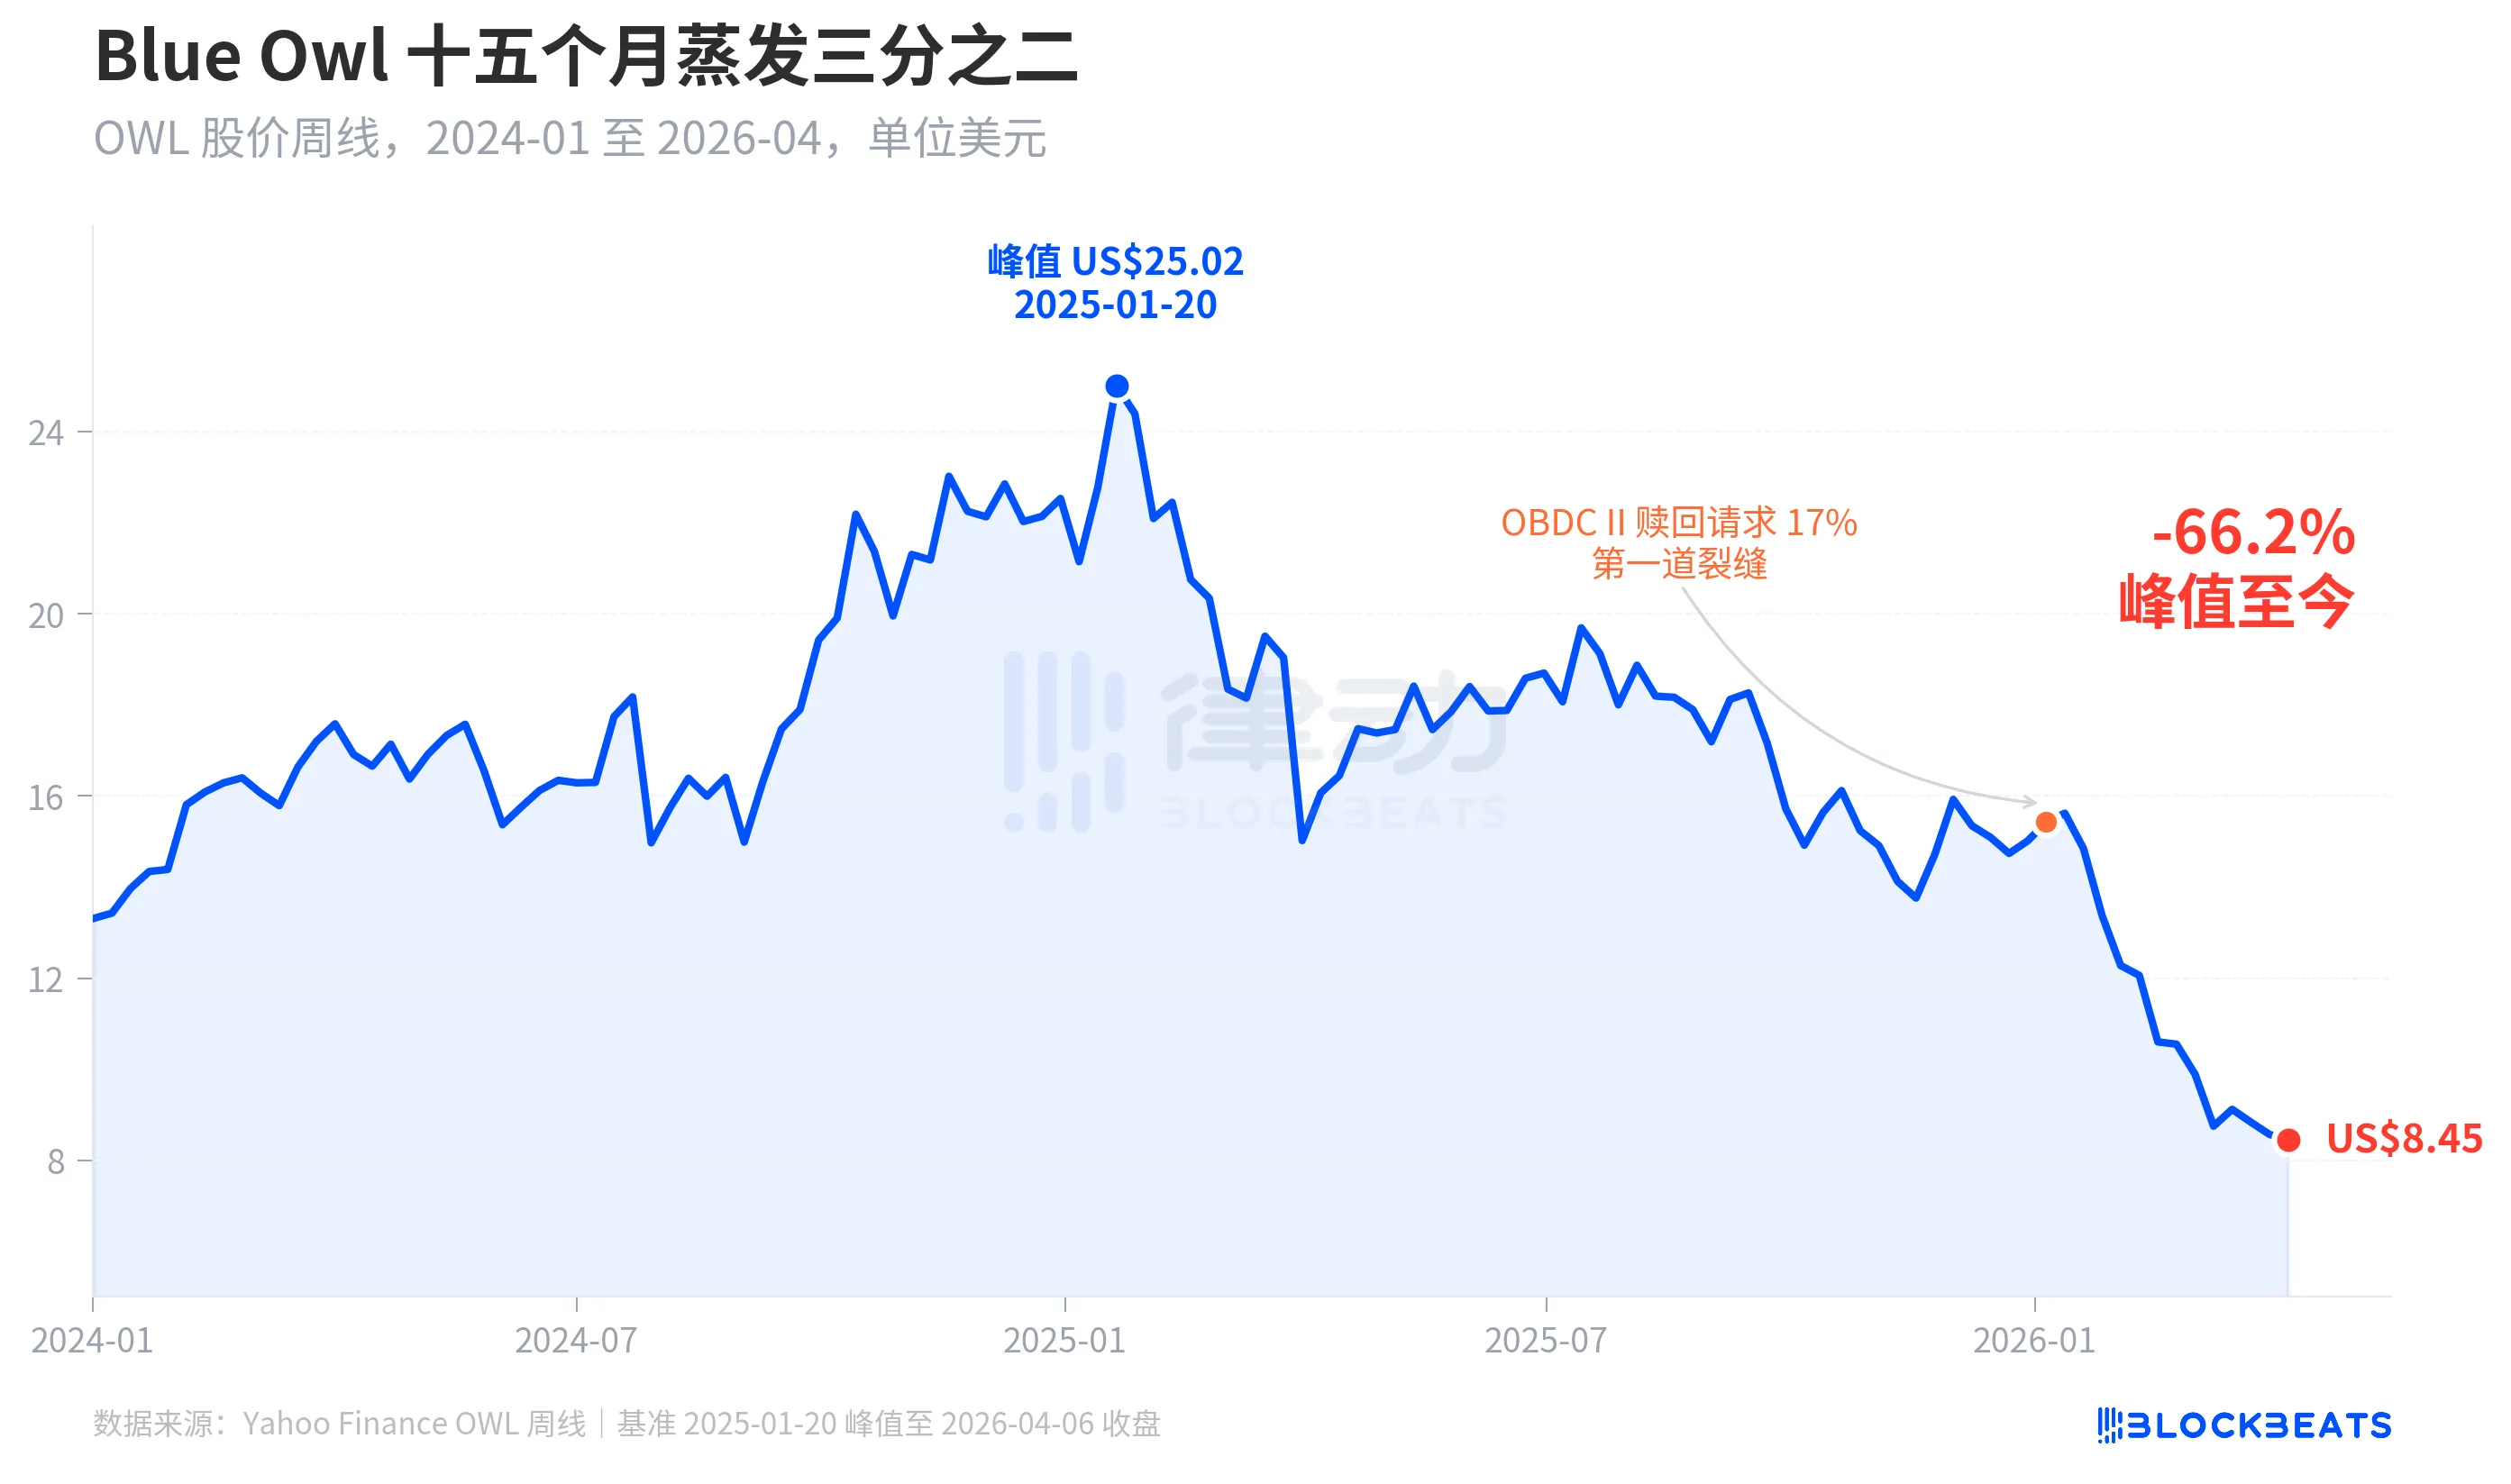
The first significant crack in the stock price emerged in early January 2026, when Blue Owl’s other fund, OBDC II (a smaller, non-public BDC), disclosed redemption requests equivalent to 17% of its outstanding shares—a move seen as the “first crack.” The stock then declined steadily through the end of the first quarter, until both flagship funds, OTIC and OCIC, simultaneously triggered gates, with the price hitting an all-time low of $7.80 during intraday trading on Monday.
Interestingly, Blue Owl’s stock price decline (-66.2%) has far outpaced the deterioration in its fundamentals. OCIC still manages $36 billion in AUM, with net asset value falling approximately 6.5% in Q1 2026, while the firm’s total assets under management remain above $290 billion. The market is clearly revaluing the company based on two factors—future redemption uncertainty and collapsed valuation confidence—rather than solely on current performance.
The same turnstile, two different fates
What clearly illustrates the "K-shaped divergence" is a cross-section. Placing together the five large semi-liquid perpetual BDCs that disclosed redemption data in the first quarter of 2026 reveals the structure at a glance.
According to Bloomberg, CNBC, and company announcements from the funds, the redemption rates for the five funds are as follows: Blue Owl OTIC at 40.7%, Blue Owl OCIC at 21.9%, Apollo Debt Solutions at 11.2%, Morgan Stanley North Haven Private Income Fund at 10.9%, and Goldman Sachs Private Credit Corp at 4.999%. These five funds can generally be categorized into three tiers.
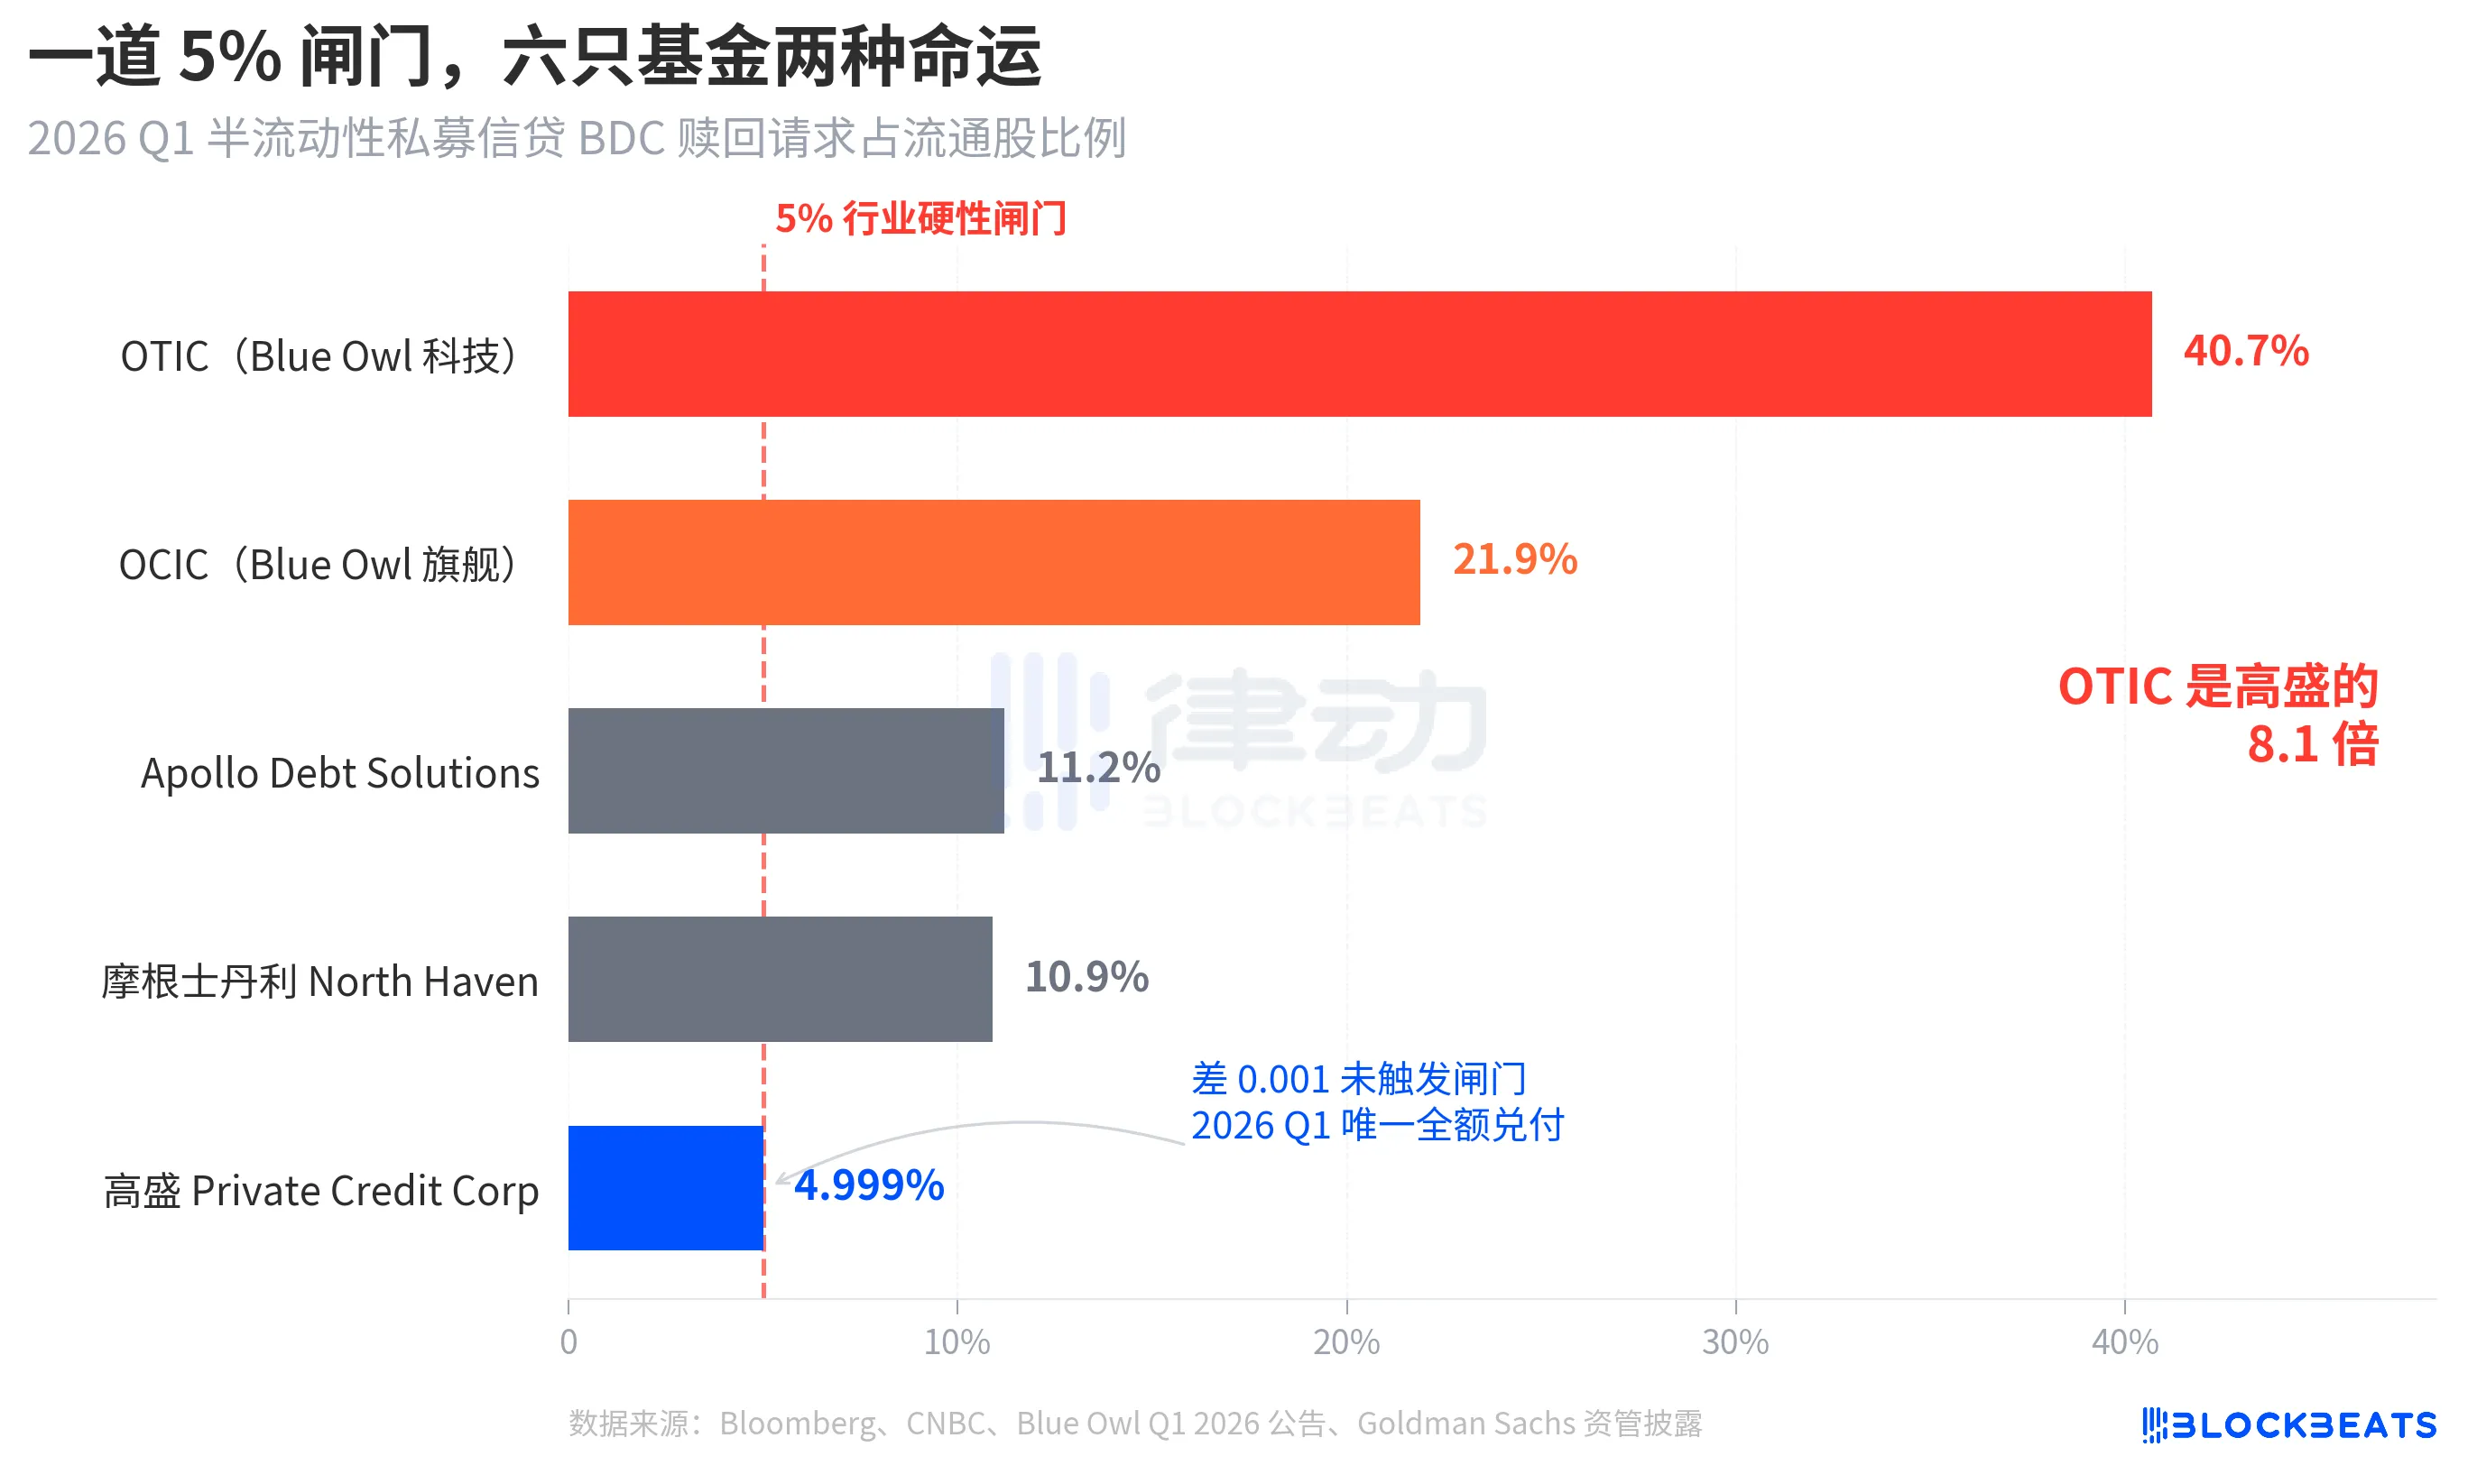
On the upside, both Blue Owl funds far exceeded the gate; nearly half of OTIC’s holders sought to withdraw, while OCIC approached four times the gate limit. According to the rules, only up to 5% of outstanding shares may be redeemed. OTIC actually paid out approximately $1.79 billion, and OCIC paid out approximately $9.88 billion, leaving over $4.2 billion in redemption requests locked behind the gate.
Mid-tier funds, Apollo and Morgan Stanley, both had redemption rates between 10% and 11%. According to Bloomberg reports on March 11 and March 23, Apollo Debt Solutions honored approximately 45% of redemption requests, while North Haven honored about 46%. According to industry reports from PitchBook and iCapital, these funds also triggered gates but faced significantly less pressure than Blue Owl.
On the downside, only Goldman Sachs remains. At 4.999%, it was the only major fund during the period that did not trigger the 5% gate, and all redemption requests were paid out at 100%.
Bloomberg used "Dodges Exodus" in the article title; the fact that OTIC is 8.1 times higher than Goldman Sachs already illustrates the severity of the divergence. In the same week, with the same structure and the same rules, the two institutions experienced entirely different fates.
The bubble pushed it up 4.4 times by retail investors.
To understand why this wave of redemptions has been so intense, first consider how much capital has flowed in. According to industry data from Robert A. Stanger & Co., the annual fundraising volume of U.S. non-traded BDCs over the past five years has followed a clear parabolic trend.
From $14.3 billion in full-year 2021 to a record $63 billion in full-year 2025, a 4.4-fold increase over five years. The same report shows that the top five institutions—Blackstone, Blue Owl, Apollo, Ares, and HPS—captured approximately 83%, or $52.3 billion, of this total. Over the past five years, retail capital inflows have not only been massive in volume but also extremely concentrated.
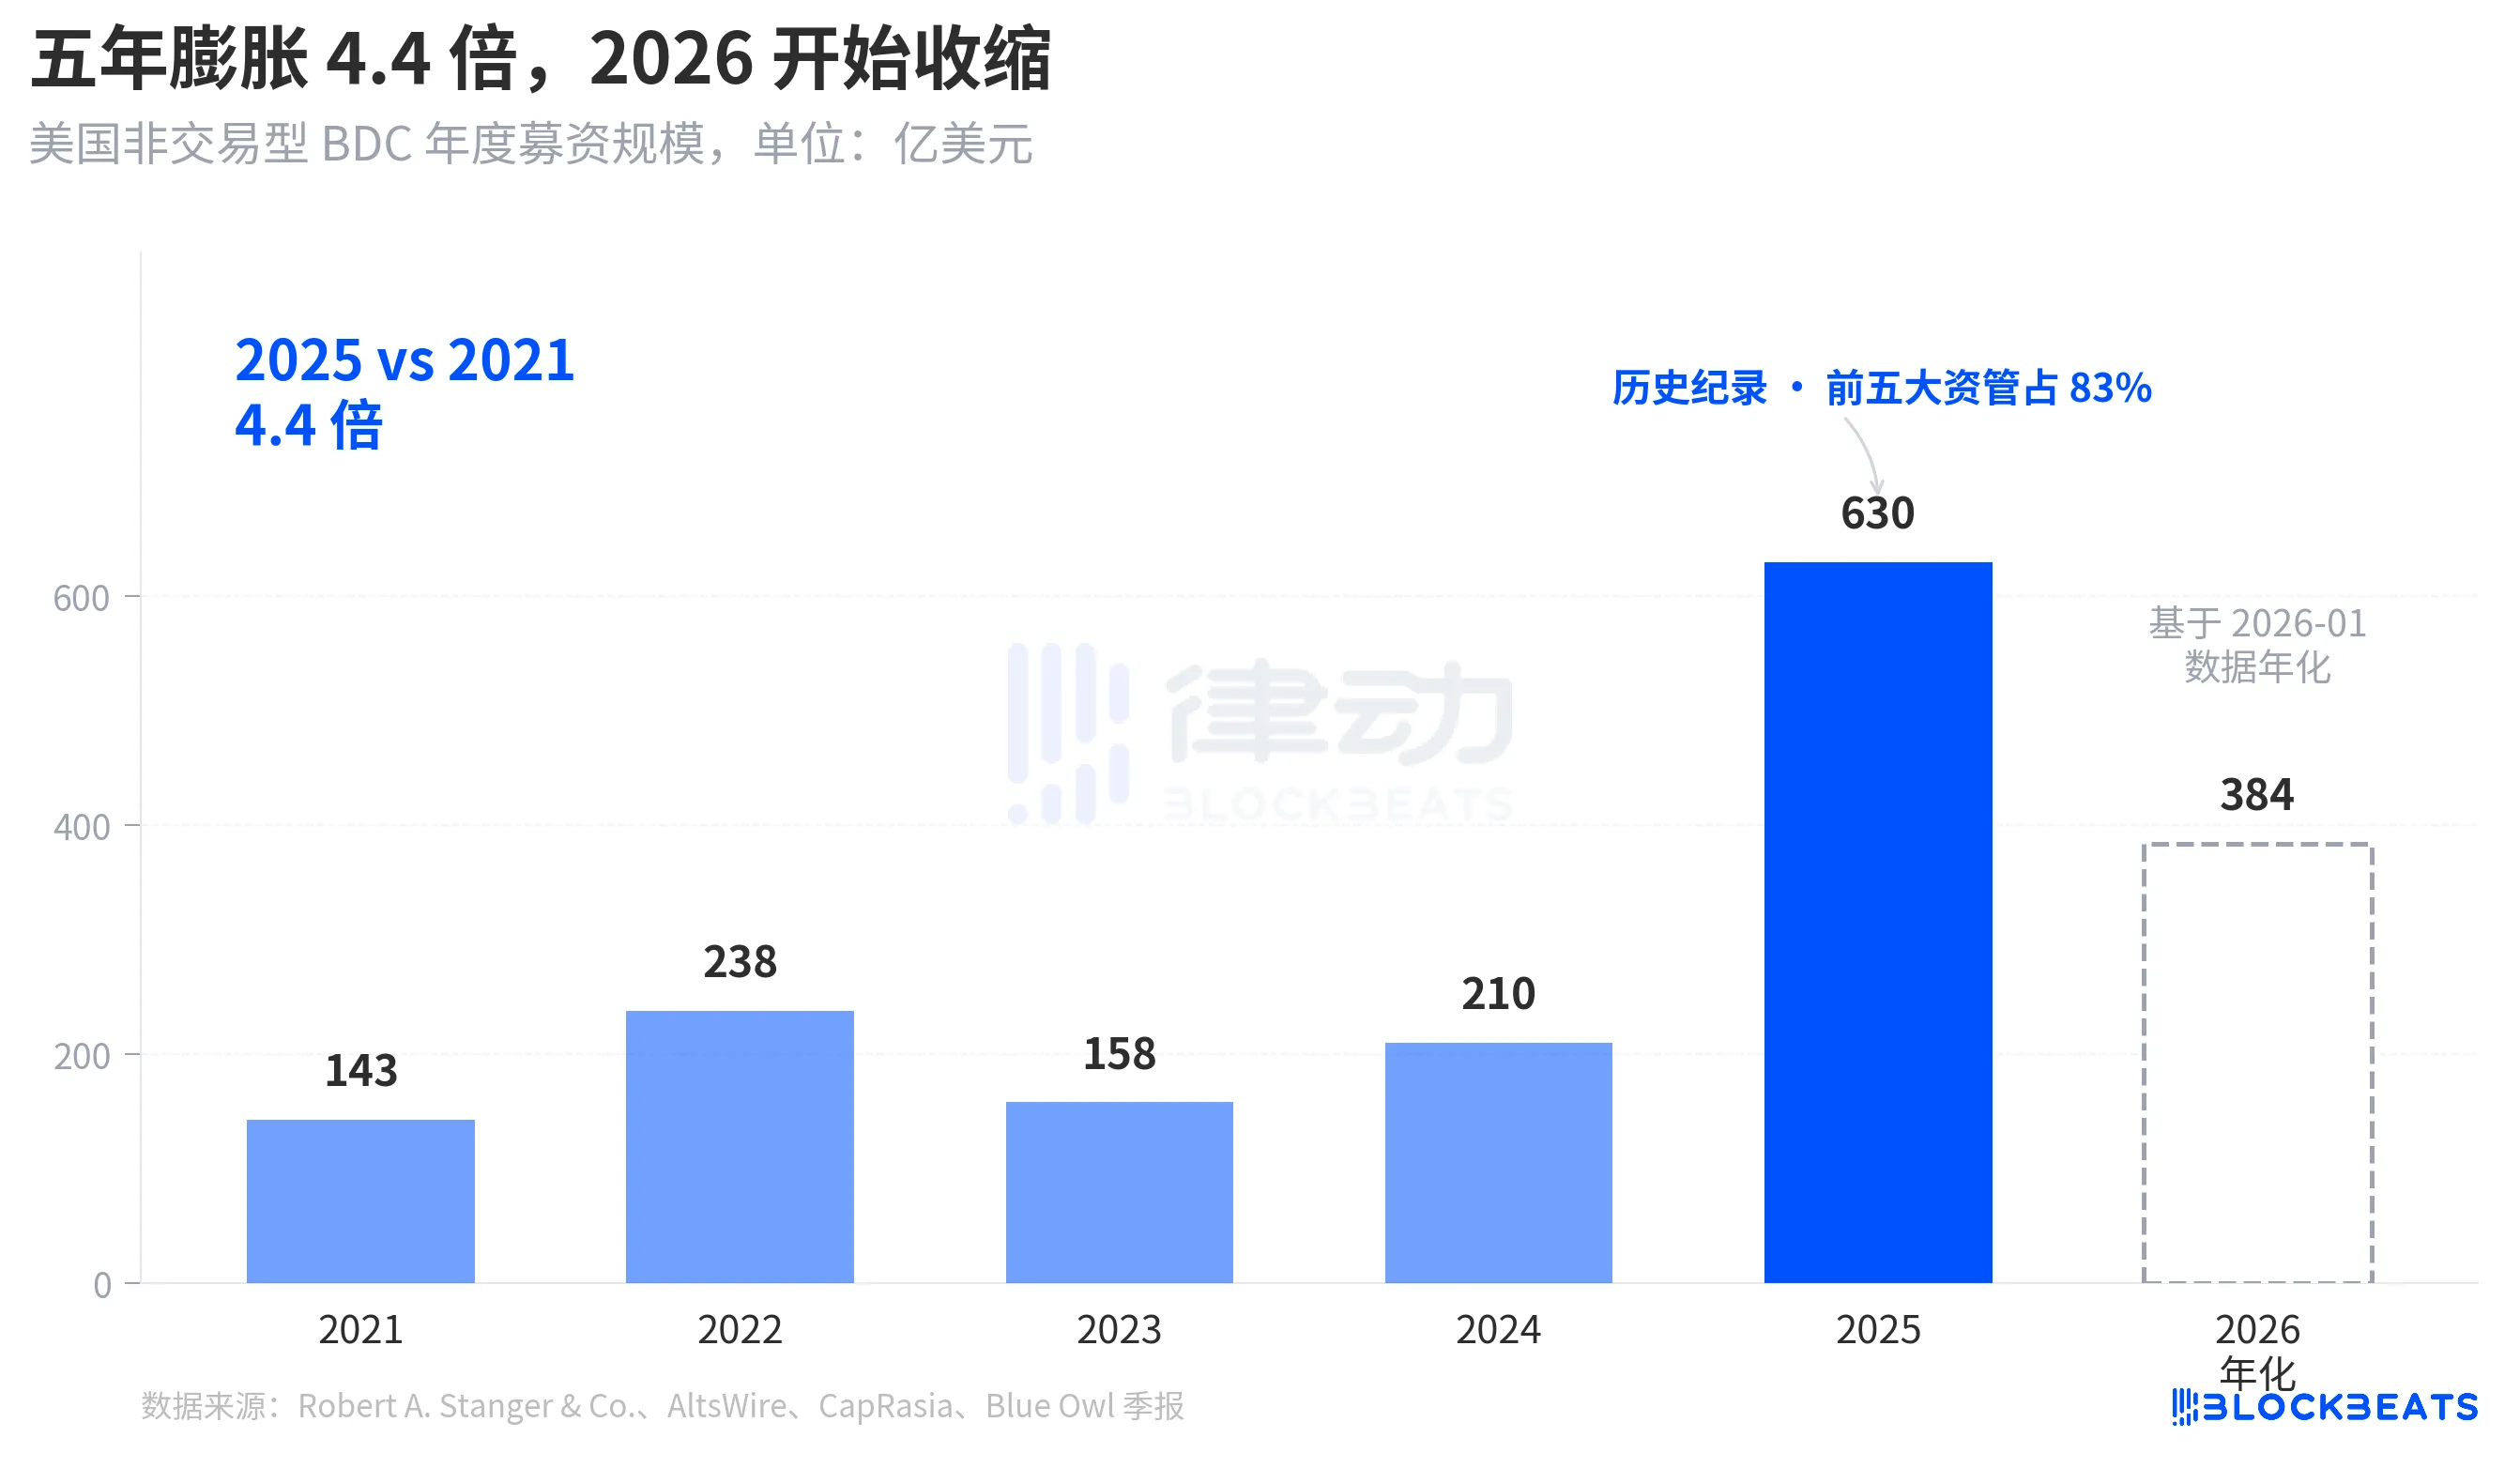
But by January 2026, Stanger’s monthly data showed non-traded BDC fundraising had dropped to just $3.2 billion, nearly halving from the peak of $6.2 billion in March 2025. According to reports from Connect Money and FinancialContent, BDC sales overall in the first quarter of 2026 declined by approximately 40% year-over-year. In the same quarter that investors began aggressively demanding redemptions, new capital inflows had already slowed noticeably—simultaneous pressure from rising redemptions and falling subscriptions crushed the gates far harder than anyone anticipated.
This is not a cyclical drawdown, but rather the first time the narrative surrounding semi-liquid perpetual BDCs being sold to retail investors as a “savings-like product” is being reevaluated at the funding level.
From BREIT to Blue Owl, vulnerabilities became increasingly apparent over four years.
Placing this redemption wave on a longer timeline reveals that it did not emerge suddenly.
The "semi-liquid perpetual" structure consists of two commitments. It allows funds to remain private and avoid public valuations, while promising investors the ability to redeem a portion of their shares at NAV each quarter. Essentially, this packages illiquid assets (such as private credit and private real estate) into a product that appears to be redeemable at any time. To prevent runs, the industry has uniformly implemented a 5% quarterly redemption cap: if redemption requests in a quarter exceed 5% of the outstanding shares, the fund pays out proportionally, and any remaining requests are rolled over to the next quarter.
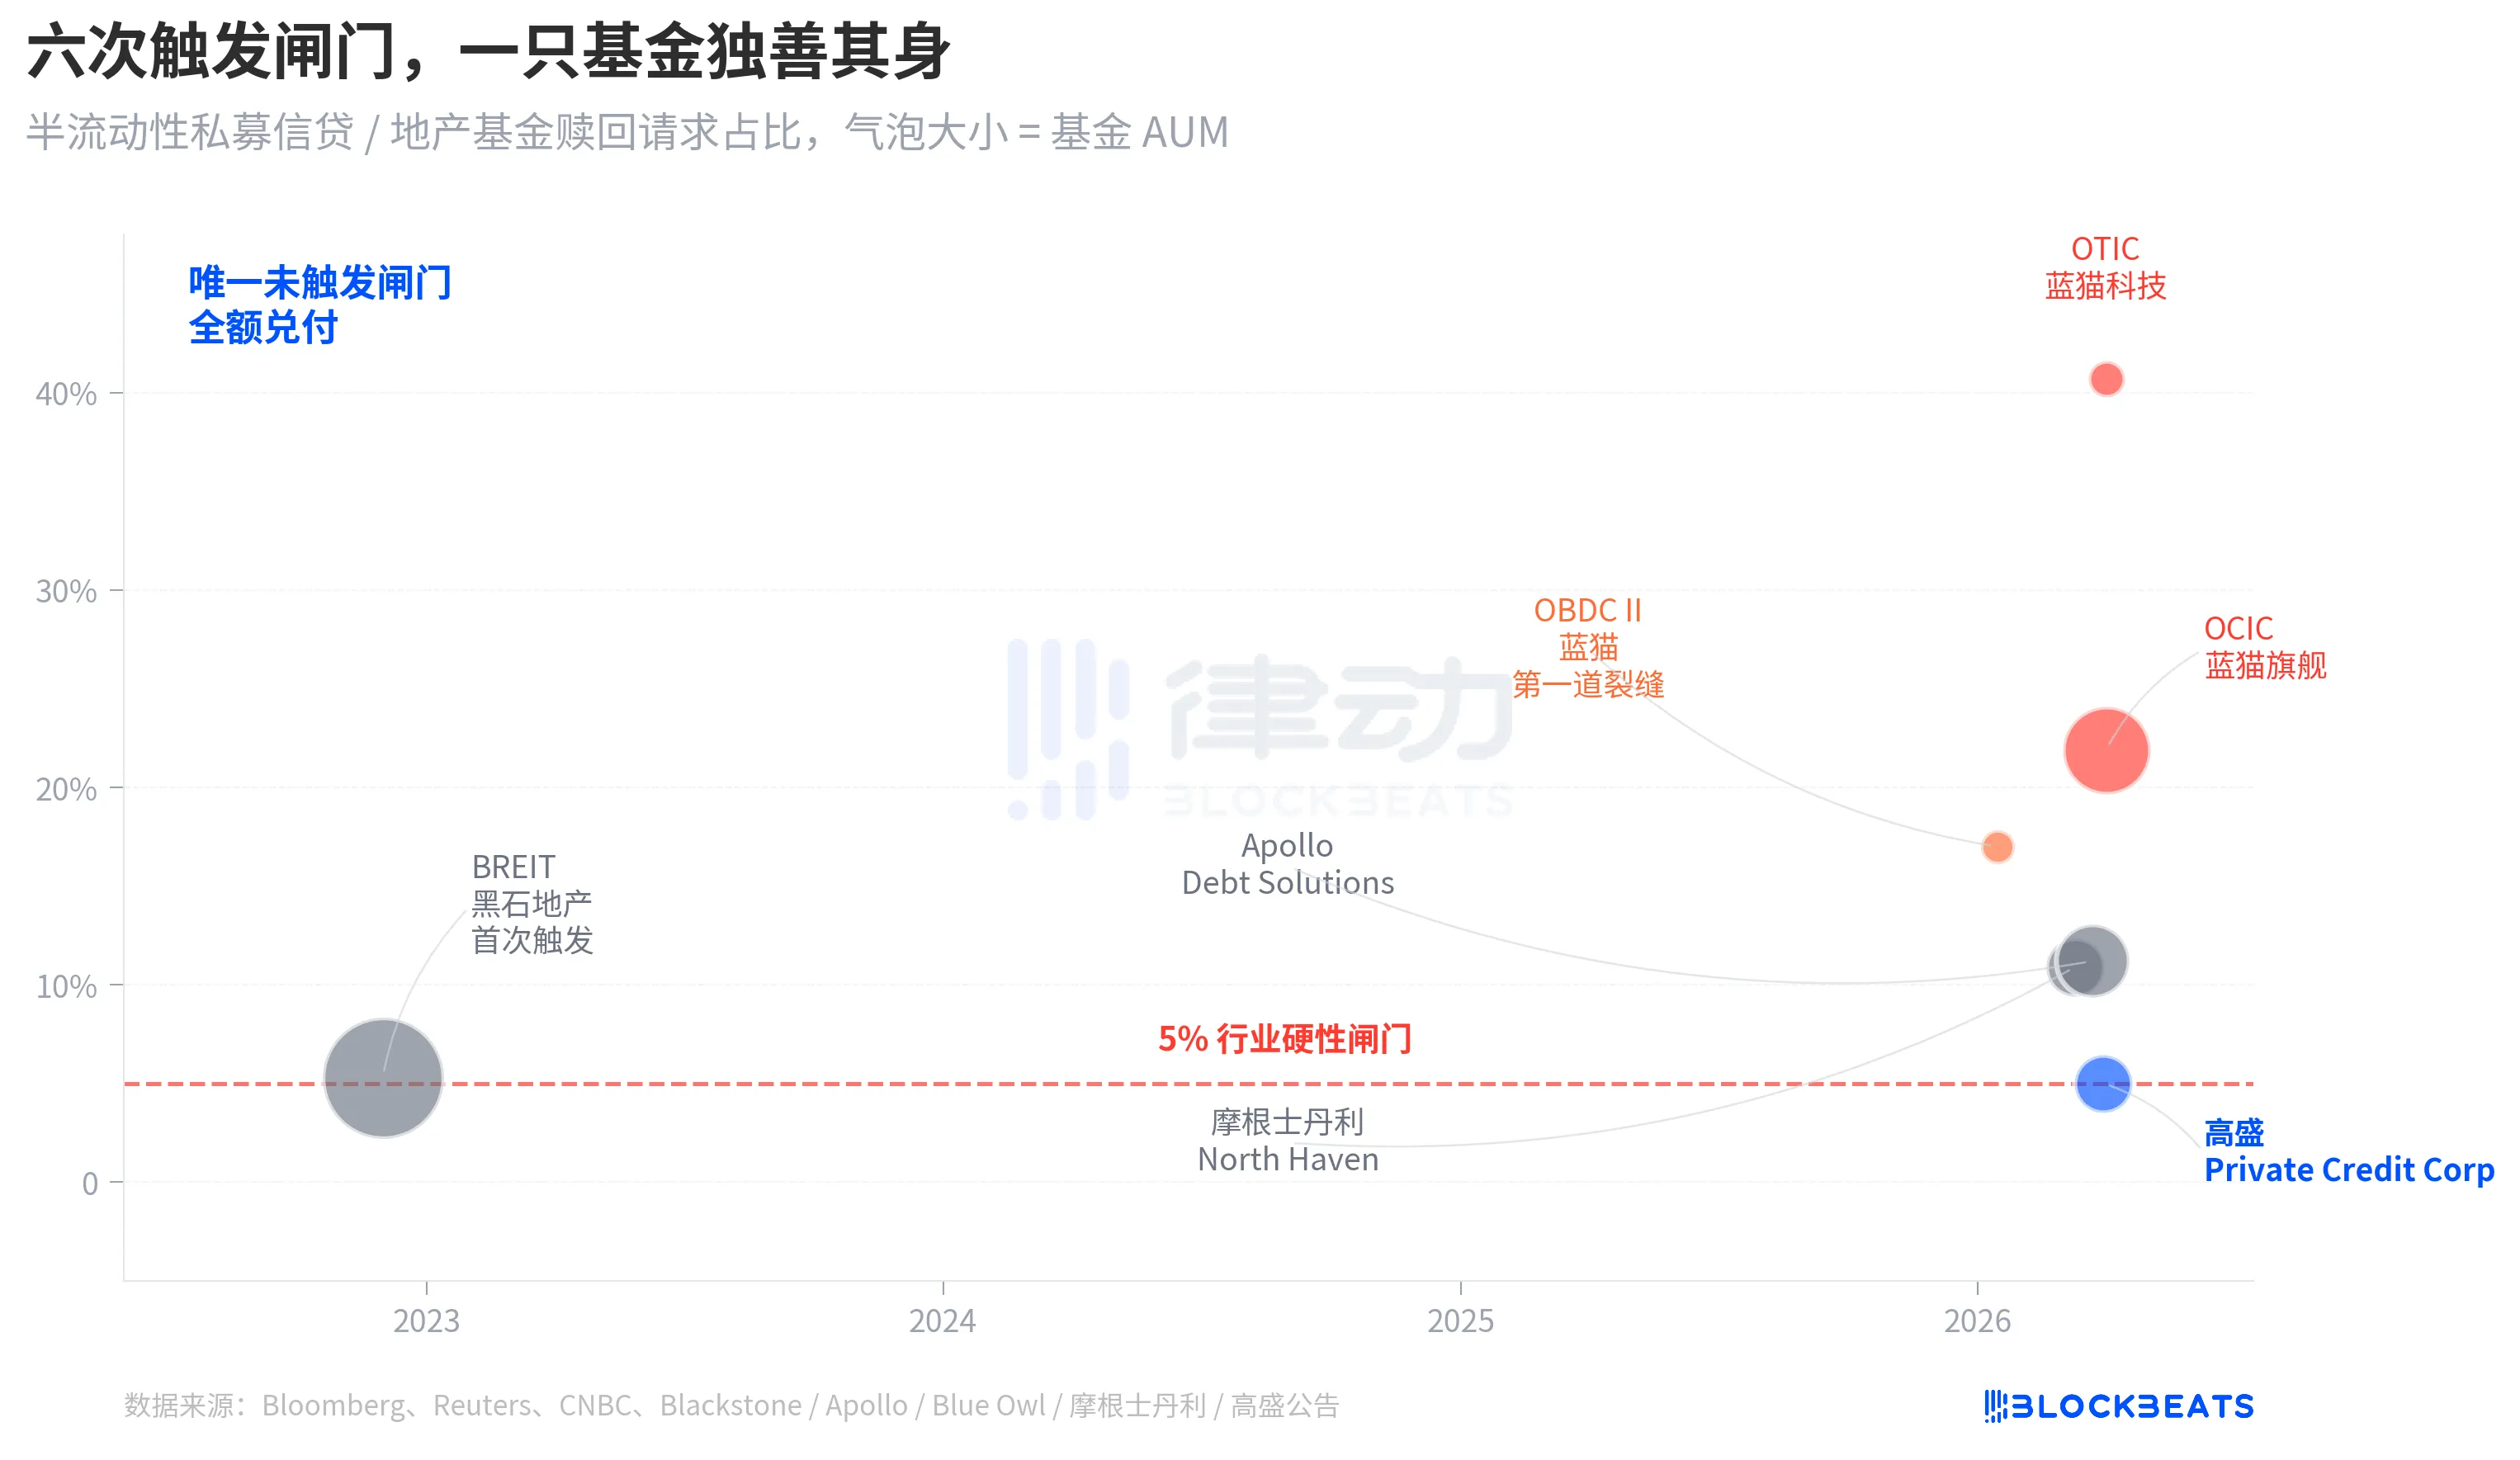
In November 2022, BREIT, a non-traded real estate trust under Blackstone, triggered this gate for the first time, marking the first systemic liquidity event in a perpetual semi-liquid structure. According to Caproasia data, in January 2023, BREIT honored only 25% of all redemption requests for that month; by November 2023, BREIT had collectively paid out $14.3 billion in redemption requests. At the time, this was viewed as an isolated event specific to the real estate asset class, and the private credit market was not dragged down.
Four years later, the same crack spread from real estate to credit. In January 2026, Blue Owl OBDC II disclosed a 17% redemption request, becoming the first signal. On March 11, Morgan Stanley’s North Haven triggered a gate. On March 23, Apollo Debt Solutions triggered a gate. On April 2, Blue Owl OCIC and OTIC simultaneously triggered gates. Within seven days, four major asset managers’ large BDCs were sequentially locked behind the same threshold, while Goldman Sachs narrowly remained outside the gate by a margin of 4.999% in the same quarter.
The structural fragility of semi-liquid perpetual BDCs was not exposed by Blue Owl’s recent redemption wave—it has been on the table since BREIT’s 2022 episode, but no one truly took it seriously over the past four years.
Root cause: 80% of OTIC is concentrated in technology and healthcare.
Now let’s return to the key question: why, with the same structure and the same week, did Goldman Sachs and Blue Owl end up with results differing by eightfold? Breaking down OTIC’s portfolio reveals the answer clearly.
According to the KBRA rating report and Blue Owl OTIC’s Q4 2024 earnings release, as of the end of 2025, OTIC’s portfolio totaled $6.2 billion, investing in 190 companies across 39 end markets, with 92% backed by private equity funds and 93% consisting of first-lien senior secured loans. From a structural standpoint, this is a high-quality fund; however, its industry concentration is notably unique. System software accounts for 16.1%, healthcare technology for 13.0%, and application software for 12.4%, with these three segments alone making up 41.5%.
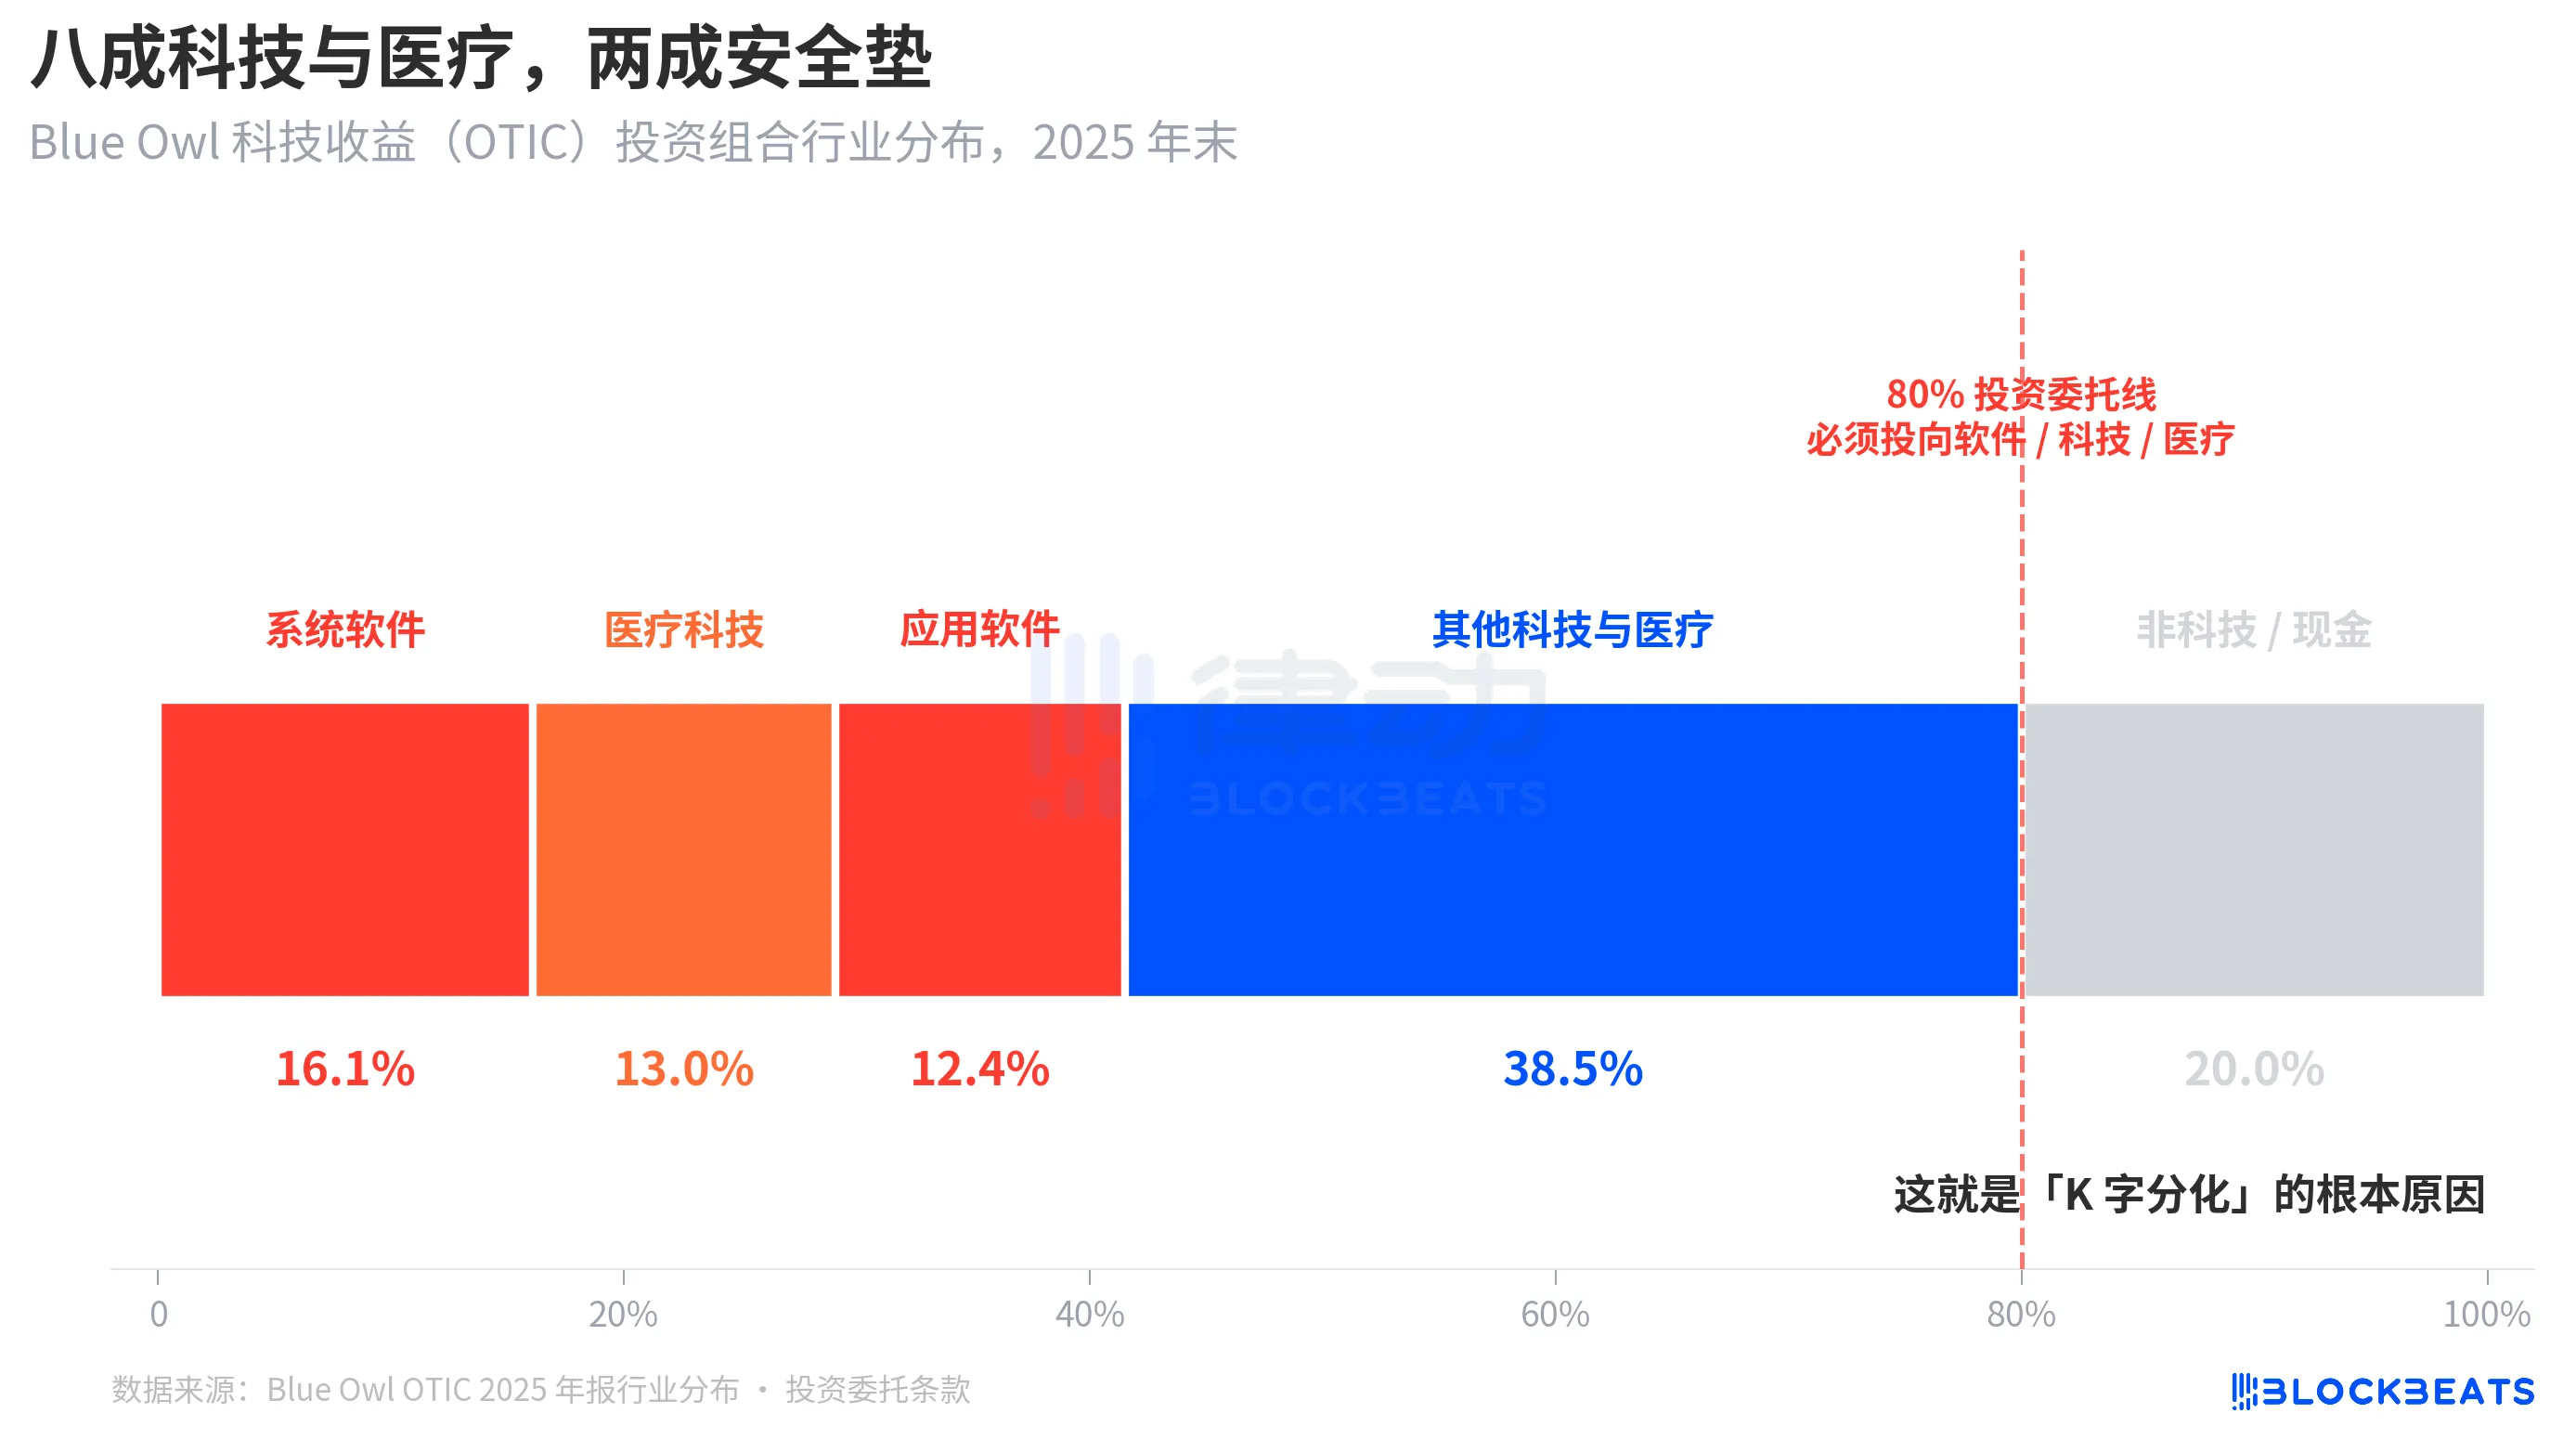
The key point is that this is not a temporary industry preference by the manager, but a mandatory rule written into OTIC’s investment charter: at least 80% of total assets must be invested in companies related to software and technology. Blue Owl describes OTIC in its public materials as “primarily investing in large, market-leading software companies that provide mission-critical, recurring-revenue solutions.” OTIC was designed from the outset as a SaaS technology credit fund.
Over the past six months, SaaS has been one of the asset classes most drastically repriced by AI. As investors began to worry that “AI could disrupt software companies’ long-term subscription revenues,” a private credit fund with 80% exposure to software and technology was hit first. According to reports from Bloomberg and Reuters, Blue Owl’s management itself acknowledged in communications with investors that redemption pressures in the first quarter were partly driven by “concerns about AI disrupting software companies.”
In contrast, Goldman Sachs Private Credit Corp’s portfolio ($15.7 billion AUM) was described by Bloomberg as “significantly more diversified than its peers,” with no single industry accounting for a level of exposure to technology comparable to OTIC’s. With identical private credit strategies, the same semi-liquid structure, and the same 5% gate, the underlying assets’ exposure to current market themes differs drastically—80% versus under 15%—resulting in redemption rates of 40.7% and 4.999%, respectively.
This is the fundamental reason behind the "K-shaped divergence." It wasn't that private credit as an asset class collapsed, but rather that funds concentrated on the same market theme experienced problems, while diversified funds were barely affected. The divergence occurred at the level of risk exposure, not structural composition.
Finalize
In his 2026 shareholder letter released on April 6, JPMorgan Chase CEO Dimon coincided with Blue Owl hitting a new low. He wrote: "Private credit as a whole lacks transparency and rigorous loan valuation markings, making it more likely for investors to sell if they believe conditions will deteriorate, even when actual losses have barely changed."
JPMorgan’s statement points to a structural issue: private credit is difficult to mark-to-market, and holders are more sensitive to perceived risk than to actual losses. Read on April 7, 2026, this carries two implications. First, Goldman Sachs’ 0.001 difference is more a result of its diversified structure than luck. Second, the entire $1.8 trillion private credit market has yet to resolve the fundamental contradiction between liquidity and opaque portfolios.
A 5% threshold failed to separate Blue Owl and Goldman Sachs into "good funds" and "bad funds"; it merely settled on a single candlestick chart the differing investment approaches of concentrating bets on current themes versus diversification.