

Key Insights
- BitMine stock could be about to drop sharply in the near term.
- Ethereum price has formed a bearish flag pattern on the daily chart.
- It has also formed an inverse head-and-shoulders pattern on the weekly chart.
BitMine stock price has sold off in the past few months, a drop that has erased billions of dollars in value. It crashed from a record high of $160 to the current $29.35.
Technical analysis signals weakness in BMNR stock. It may face a strong bearish breakdown soon.
BitMine Stock Price Technical Analysis Points to a Crash
The daily timeframe chart shows that the BitMine stock price has crashed in the past few months. It moved from a record high of $160 to the current $29. This drop has pushed its market capitalization from over $17 billion to the current $13 billion.
The chart shows the stock nearing a bearish breakout. The symmetrical triangle is tightening. Its two lines are about to converge. This setup signals potential downside momentum.
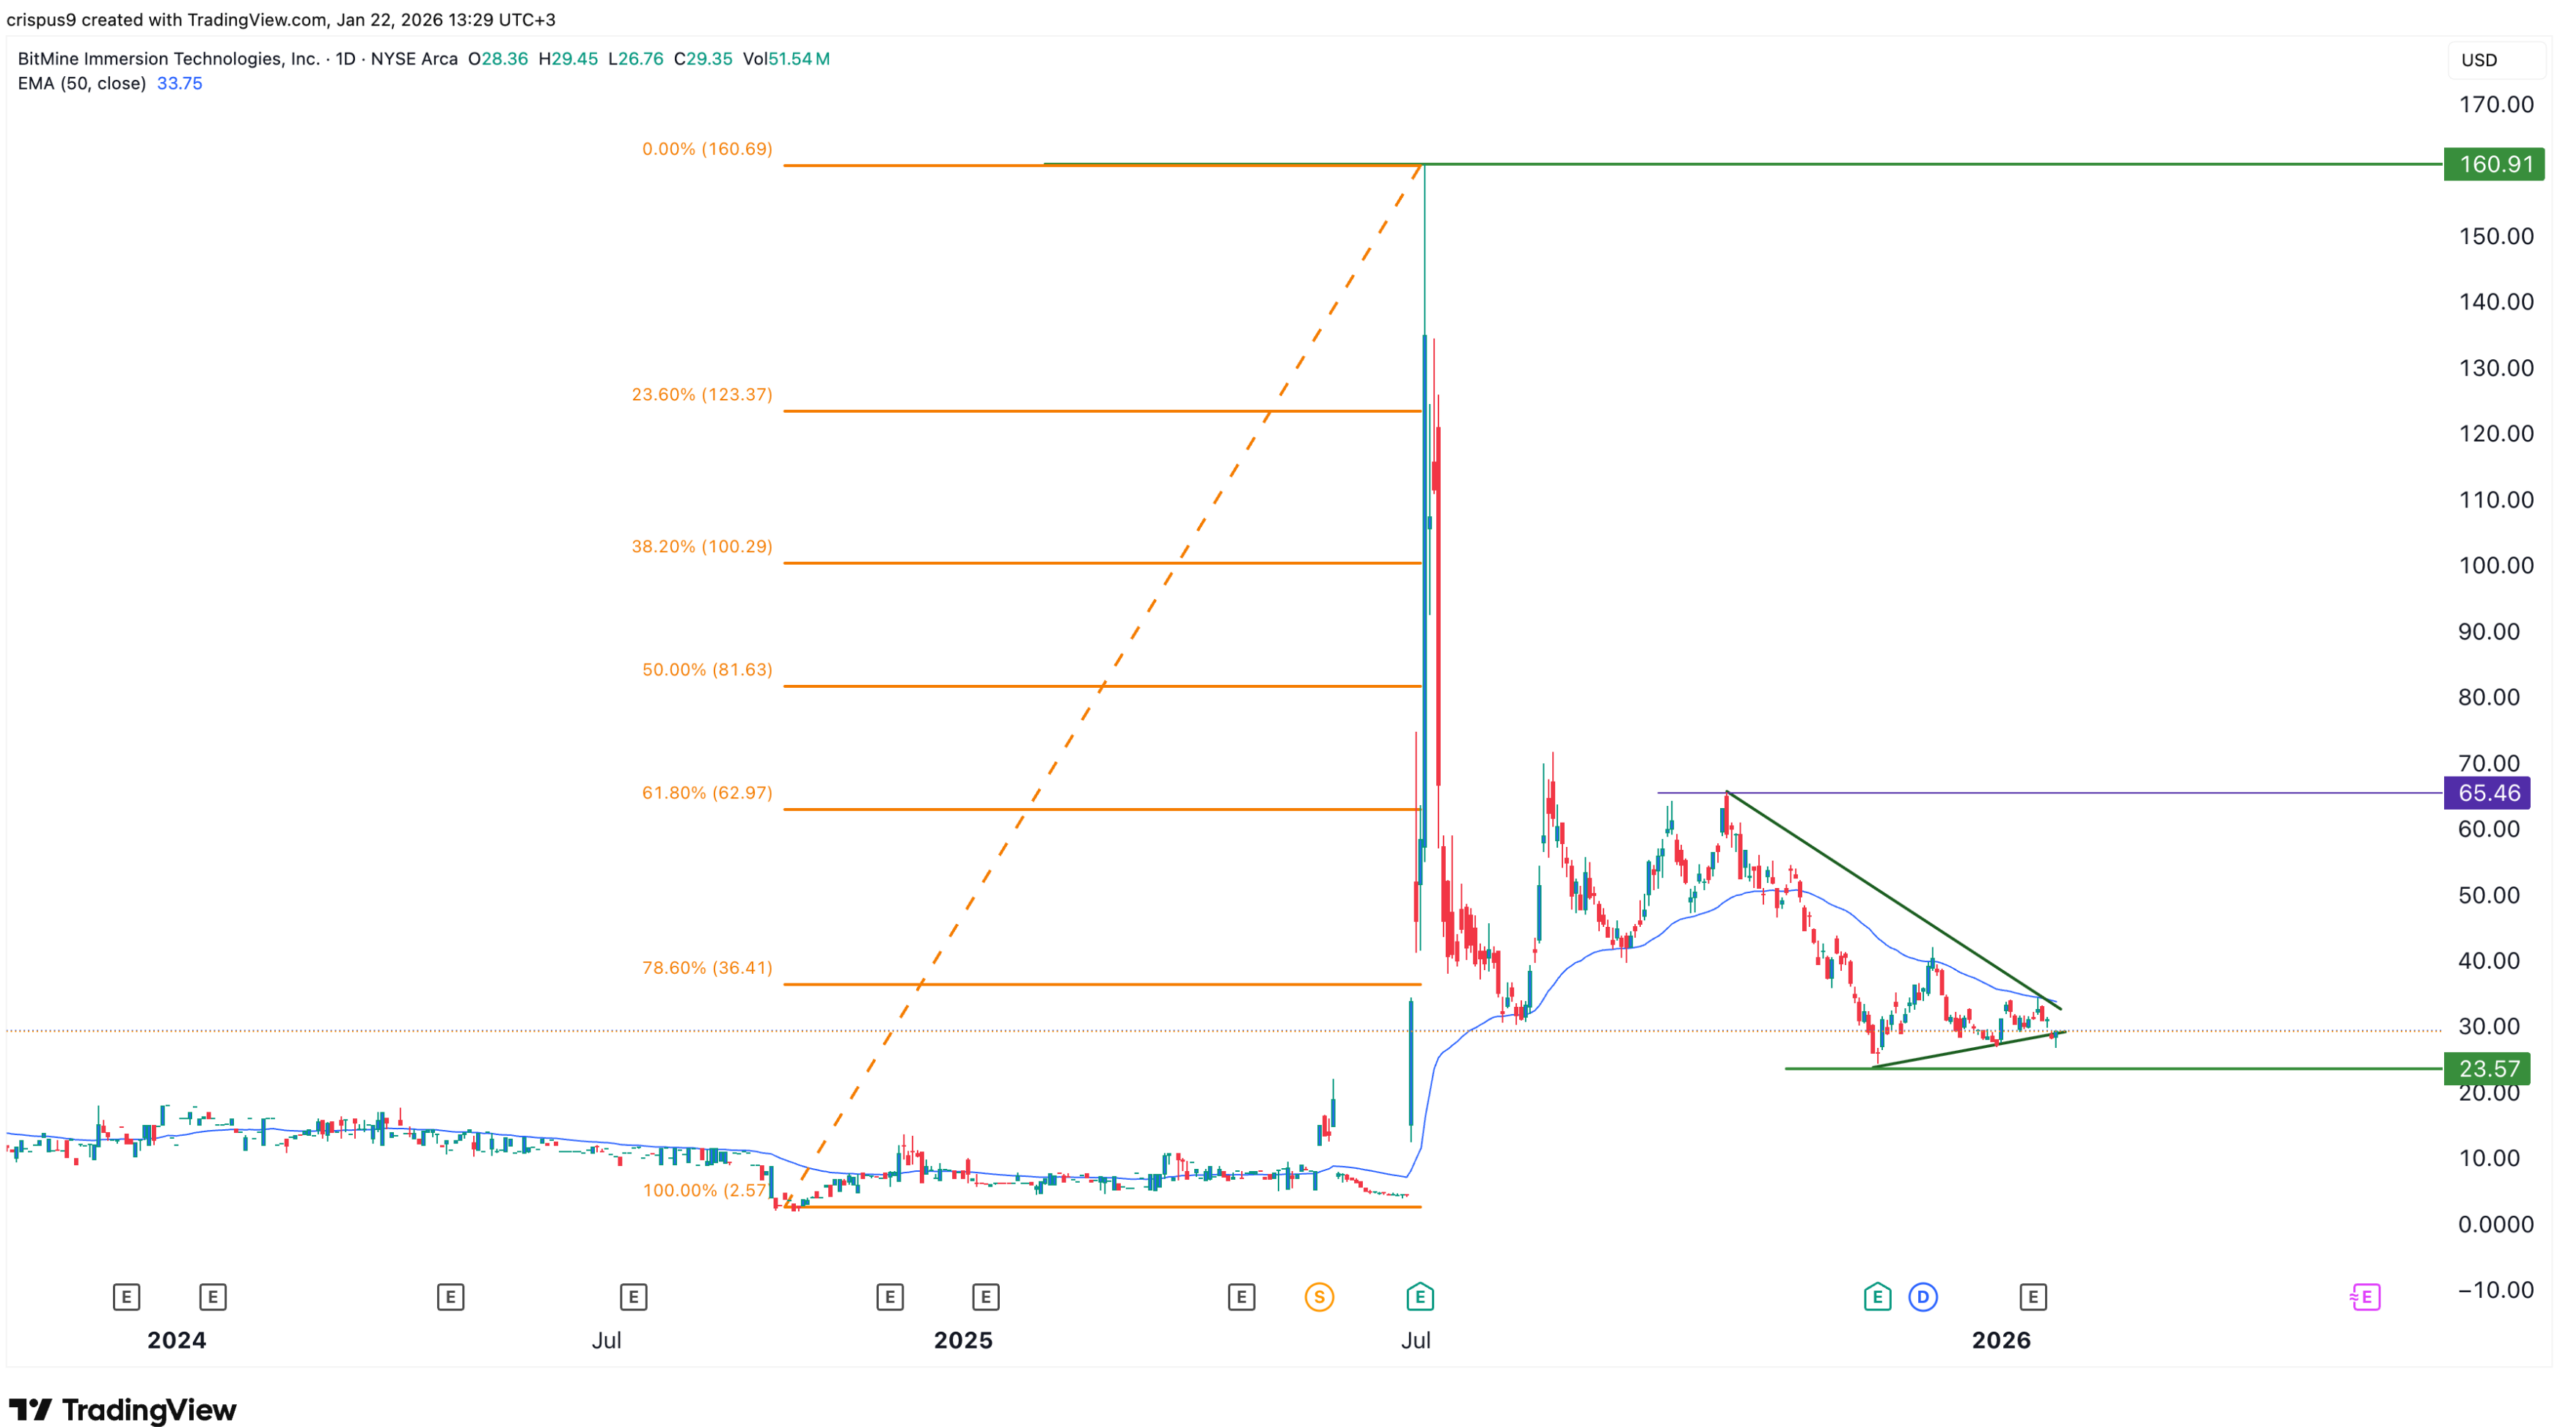
At the same time, the stock has remained below the 50-day and 200-day EMAs. It’s a sign that bears remain in control. It has also moved below the 78.6% Fibonacci Retracement level at $36.
The most likely scenario points to a stock decline. The initial target sits at $23.57, its November low. A drop below that level will point to more downside, potentially to the psychological level at $20.
Ethereum Price Has Formed a Bearish Chart Pattern
BitMine has risen to the second largest DAT company globally. It holds over 4.2 million ETH tokens. The stash is worth more than $12.65 billion.
The company had a big advantage compared to Michael Saylor’s Strategy. For one, the company is currently staking its huge Ethereum collection. It’s a move that will bring in over $400 million in annual revenue in the long term.
Additionally, the company has a better balance sheet than Strategy, with no debt. Most importantly, it has a target of the Ethereum coins it plans to accumulate. In this, it hopes to eventually buy 6 million ETH coins.
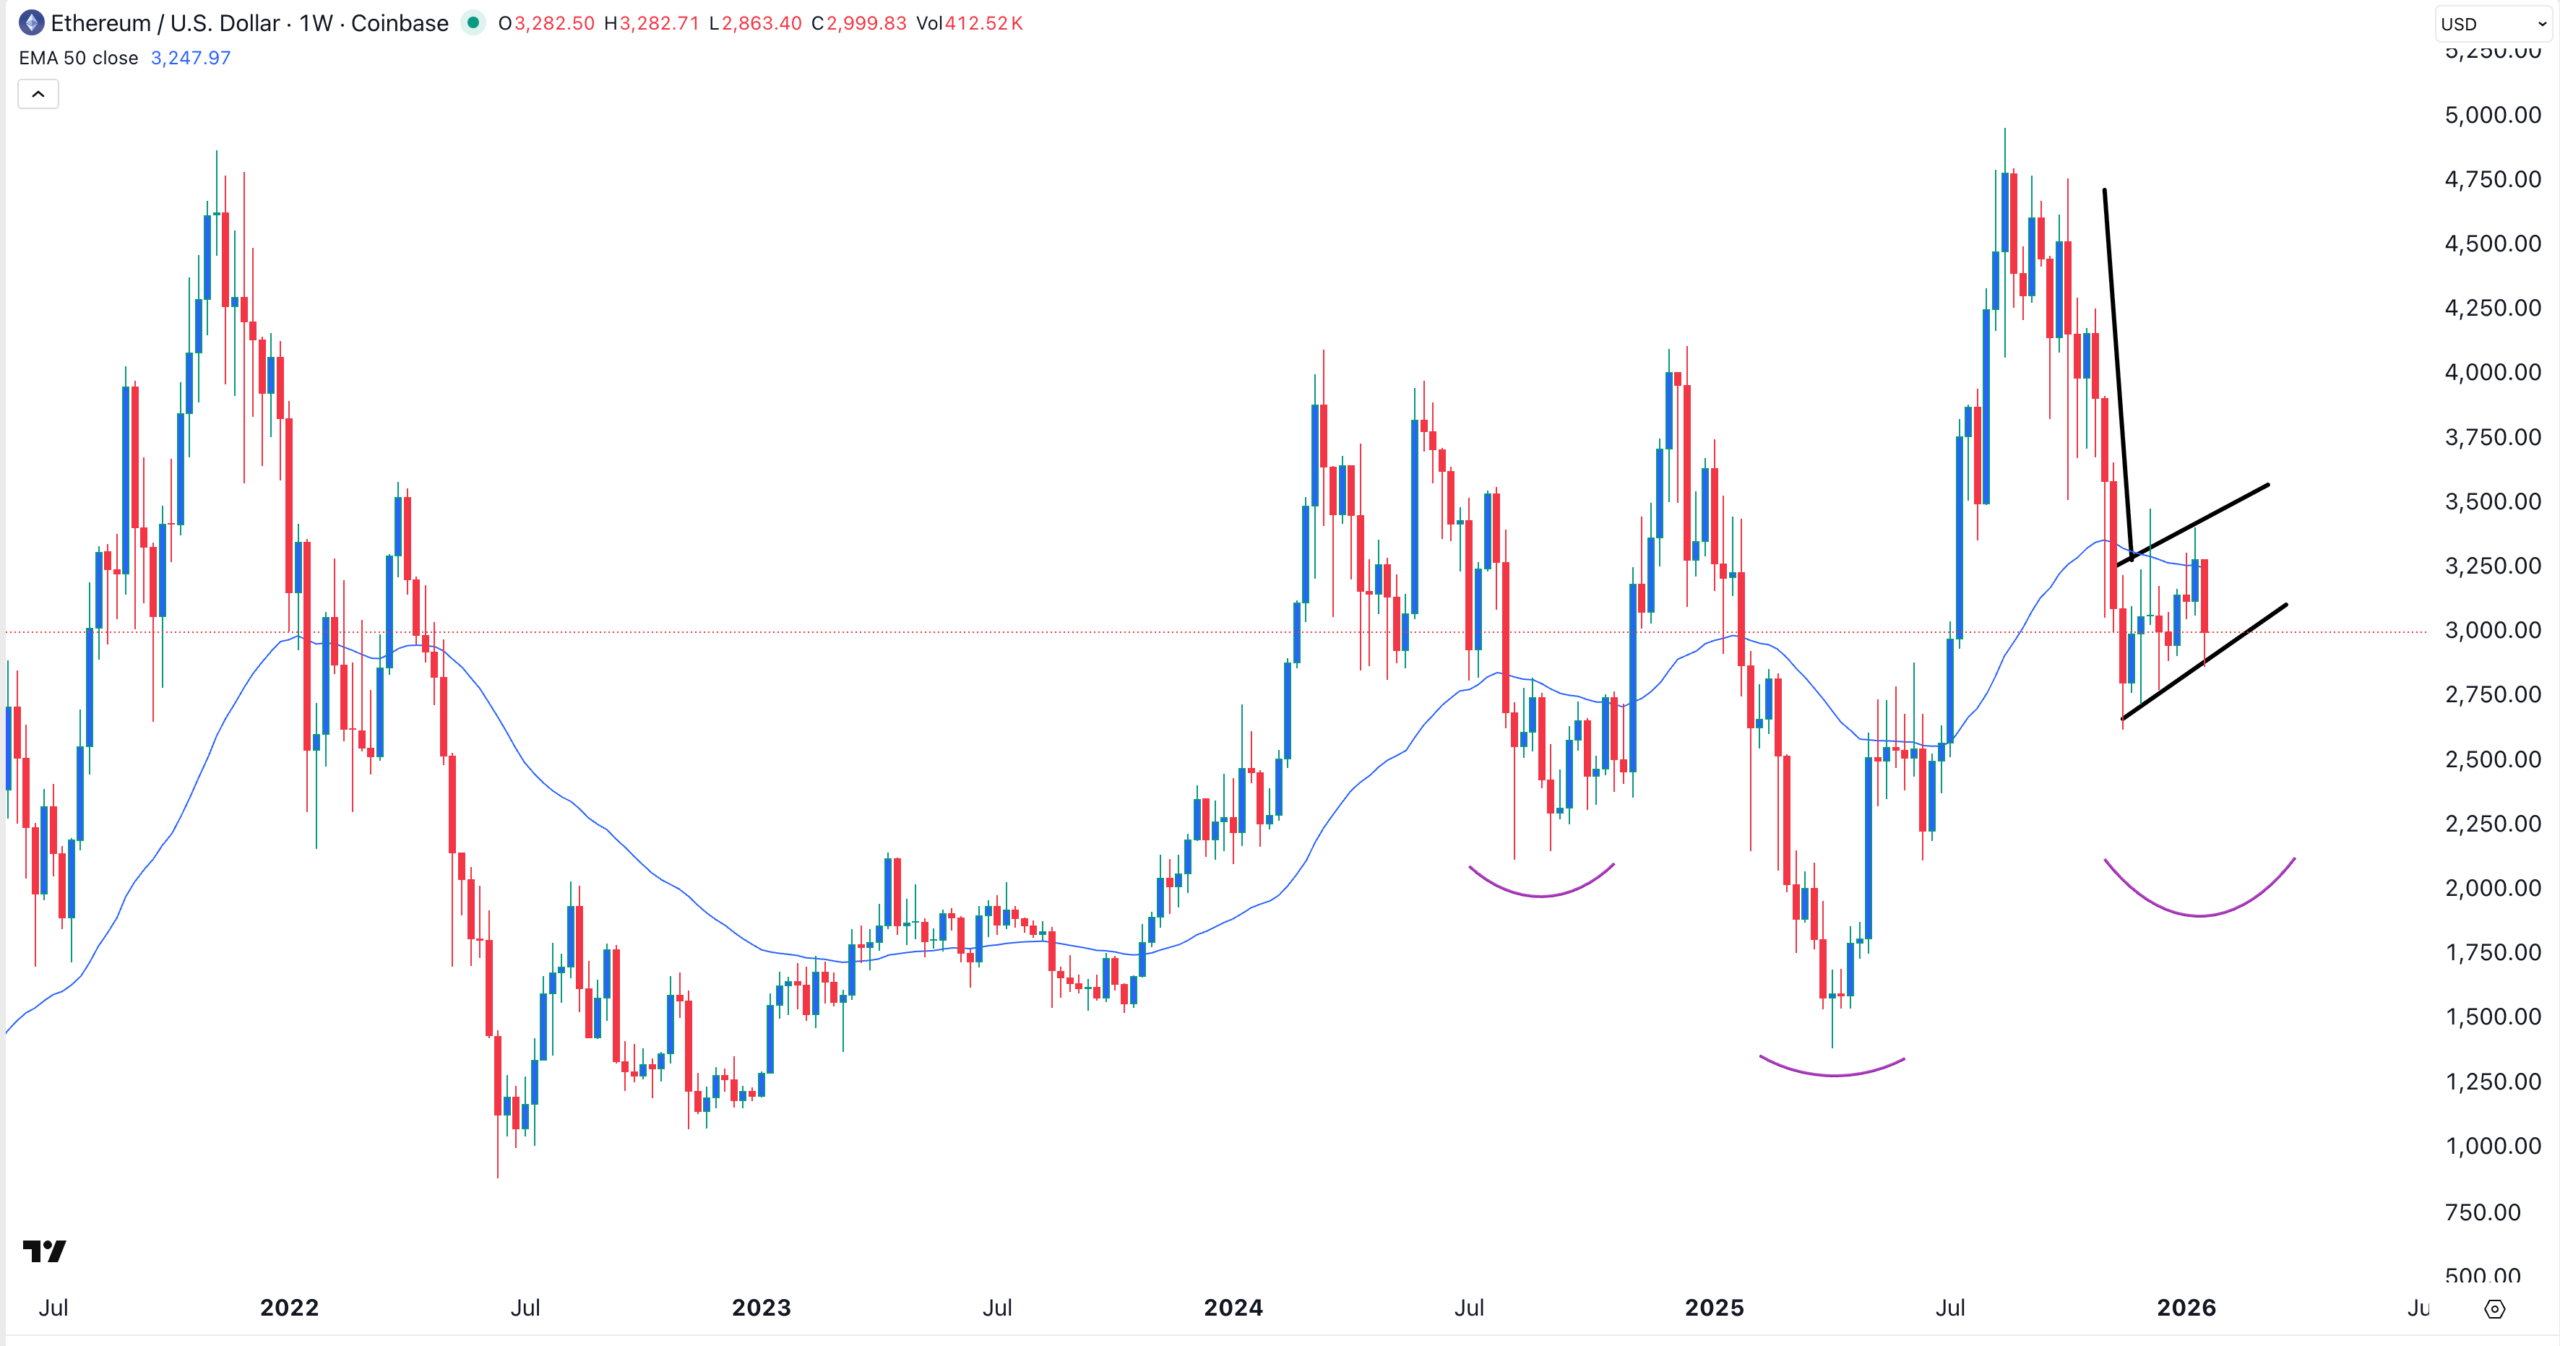
The risk, however, is that Ethereum has formed two major chart patterns. On the positive side, the coin is in the process of forming an inverted head-and-shoulders pattern on the weekly chart.
It has completed forming the head and the left shoulder section. Its head is at $1,398, while the left shoulder is at $2,130, its lowest level in August 2024.
The right shoulder is in the process of forming, and chances are high that it has more downside to go. This will negatively impact BitMine and other Ethereum treasury companies.
On the other hand, the coin is in the process of forming a bearish flag pattern. That’s made up of a vertical line and an ascending channel. It has already formed the flag section from $4,930 to a low of $2,615.
The coin is now in the process of forming the flag section. As such, there is a possibility that it will have a bearish breakout, potentially to $2,147. This target, which is 30% below the current level, aligns with the left shoulder section of the inverted head-and-shoulders pattern.
Such a move would create a major risk for BMNR stock. Its Ethereum holdings could fall from $12.6 billion to just over $9 billion.
Such a drop would lower Ethereum’s cost. BitMine could keep accumulating coins more cheaply. The company sees Ethereum’s long-term outlook as bullish. The coin has numerous catalysts, including the inverted head-and-shoulders pattern and its strong fundamentals.
For example, Ethereum is preparing major upgrades this year, known as Glamsterdam and Hegota. Its transaction count keeps rising. Active addresses also continue to grow.
The network strengthens its dominance in decentralized finance. It expands in real-world asset tokenization despite more layer-1 and layer-2 rivals.
The post BitMine Stock Price at Risk as Ethereum Forms an Alarming Pattern appeared first on The Market Periodical.