


In last week’s report, we clearly warned that the market was in a bull trap zone, advising investors not to blindly chase price increases or add positions, and maintaining our bearish trend outlook. This week’s market movement has provided clear validation—Bitcoin failed to effectively break through the resistance zone, followed by a significant pullback, confirming the continued validity of the bearish thesis.
The following content presents this week’s market outlook, trading strategy recommendations, and a review of last week’s trade execution, helping readers navigate the complex market and make precise decisions.
Weekly Trading Report Key Summary:
• HYPE Short-Term Trading Performance: Last week, a short-term long position (1x leverage) was executed, successfully generating a profit of approximately 4.41%. (See Part Two for details.)
• BTC Short-Term Trading Performance: Last week, a short position (1x leverage) was successfully executed, yielding approximately 5.37%. (See Section 4 for details.)
• HYPE Weekly Forecast and Trading Strategy: See Sections One and Two.
• BTC price trend forecast and medium- to short-term trading strategies: See Sections Three and Four.
• Core hypothesis validation: Last week, Bitcoin remained in a bearish trend pattern, fully aligning with our prediction, and the bullish trap warning was effectively confirmed.
I. HYPE Forecast and Trading Strategy
1. This week's key insights:
Based on the current structure, we believe the hourly-level downward correction that began near the March 19 high (point 27) is likely to conclude in the near term. The subsequent price movement should be monitored to determine whether price can effectively break free from the range of center C, confirming whether the correction has truly ended. If a decisive breakout occurs, the signal for trend continuation will become clearer. We expect the price to likely range-bound with wide volatility this week; therefore, a flexible trading approach is recommended.
2. Risk Warning for HYPE Price Increase:
It is important to note that while HYPE’s price movement has its own independence, it cannot fully脱离 the broader Bitcoin environment. If Bitcoin subsequently experiences a significant correction, it could hinder HYPE’s rebound momentum; investors should remain vigilant and prepare appropriate risk management strategies.
3. This Week's Trading Strategy:
Use a 30% position size, set stop-loss levels based on support and resistance areas, and look for spread trading opportunities (using 30-minute or 60-minute timeframes). Maintain light, flexible positions and strictly adhere to stop-loss discipline.
II. Last Week's Price Structure Analysis and Short-Term Trading Review for HYPE
1. Ongoing tracking of HYPE market dynamics and investment opportunities
Since late February, we have continuously monitored and analyzed HYPE, and all our previous assessments have been effectively validated by market movements, as summarized below:
• Weekly Review for February 23: First highlighted that HYPE may be entering an investment window, noting that the market was in a Wave II correction phase and forecasting an upcoming Wave III primary upward movement.
• Weekly Review, March 3: The low of $25.60 on February 24 is identified as a potential starting point for Wave III, confirming a possible reversal point in the trend.
• Weekly Review, March 9: Price has effectively broken through multiple moving average resistances on the daily chart, followed by a pullback and consolidation phase, with a rapid upward move expected to follow.
• Weekly Review, March 16: Noted that the market was in Wave III, forming an upward central range (i.e., Central Range B). Predicted that after completion, the likelihood of a wide-ranging oscillation was high.
2. Overview of the HYPE Daily Chart Price Structure: (Based on price action evolution after January 21)
The current daily chart of HYPE has clearly formed a three-wave advance pattern, with the following characteristics of each sub-wave:
• Wave I (impulse wave): From the low of $20.46 on January 21 to the high of $38.41 on February 3, lasting 14 days, with a maximum gain of 87.73% and strong upward momentum.
• Wave II (corrective wave): From the high of $38.41 on February 3 to the low of $25.60 on February 24, lasting 20 days, with a maximum decline of 33.35%, representing a typical retracement level.
• Wave III (main upward wave): Since the low of $25.60 on February 24, the market has been trending upward for 27 days, with a maximum gain of 71.02%. The primary uptrend continues, and the structure remains intact.
3. HYPE Hourly-Level Substructure: (Based on price action after March 16)
HYPE 60-minute K-line chart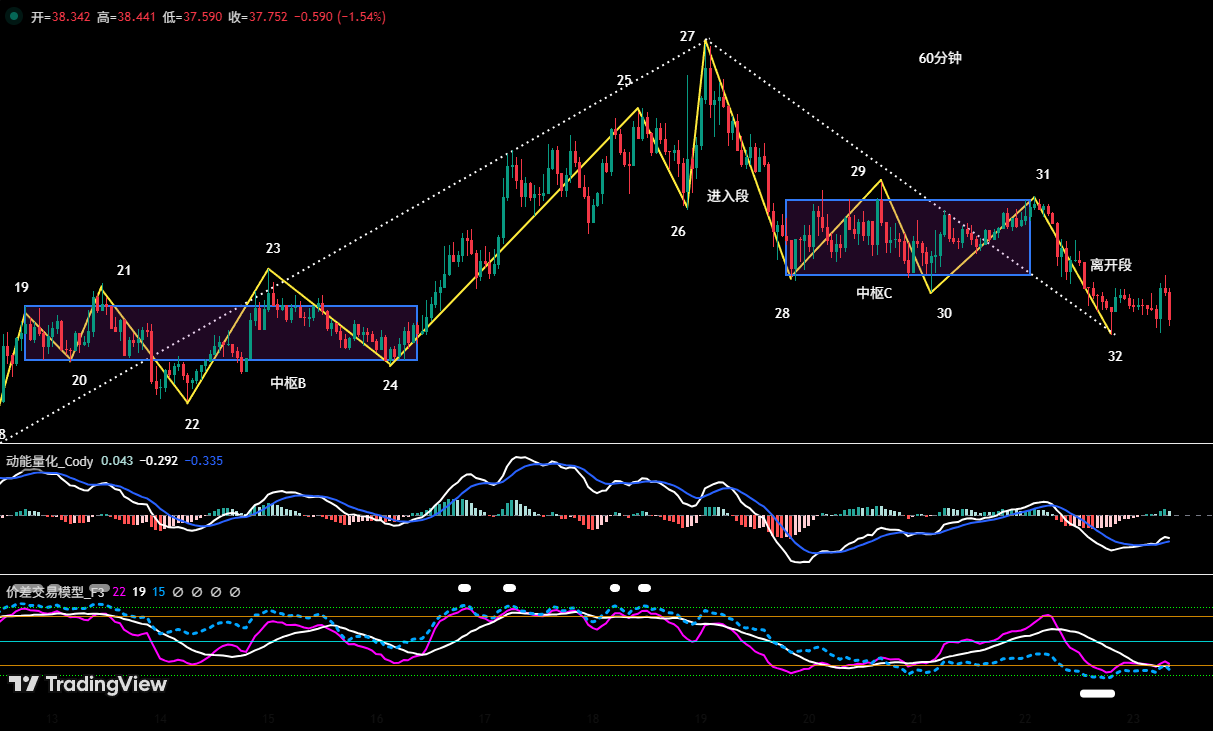
Figure 1
• HYPE Hourly Chart Structure Review: As shown, the price has been forming an upward central zone (Central Zone B) from the latter part of the 9th to the 15th and is nearing completion, consistent with our earlier forecast.
• HYPE intraday structure breakdown: (03.16~03.22)
a. As shown in Figure 1, starting from point 24, the previously formed upward central region (i.e., Central B) has been confirmed as completed. Subsequently, the market developed a complex structure consisting of eight segments: 24-25, 25-26, 26-27, 27-28, 28-29, 29-30, 30-31, and 31-32. At the time of analysis, the 31-32 segment is still in progress, and the structural hierarchy remains clearly defined.
b. The upward structure consists of three segments: 24-25, 25-26, and 26-27, indicating a clear directional trend.
c. The adjustment structure consists of five segments: 27-28, 28-29, 29-30, 30-31, and 31-32, exhibiting a clear pattern of oscillatory convergence.
d. The three segments—28-29, 29-30, and 30-31—overlap and together form a downward central area (Central Area C), which is the core range of this correction.
4. HYPE Short-Term Trading Review (1x Leverage): (03.16~03.22)
Last week, based on trading signals generated by our proprietary spread trading model and momentum quantitative model, combined with our forecast of an upward structure, we executed a short-term long position, achieving a successful profit of 4.41%, with all procedures strictly following the predefined plan.
• HYPE Short-Term Trading Summary: (1x Leverage)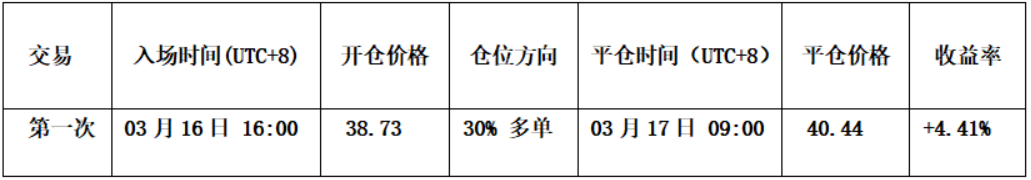
• Position Opening Decision: This position opening decision was based on the expectation of trend continuation following the completion of the upward channel B. The specific trigger signal was a valid breakout above the upper boundary resistance of the channel (approximately $38.54), accompanied by bullish confirmation signals from two quantitative models analyzing spread and momentum. The convergence of multiple indicators significantly enhanced the reliability of the entry timing. Accordingly, we opened a 30% long position at $38.73.
• Position closure decision: Based on a spread quantification model issuing a bearish top signal, combined with a technical confirmation from the candlestick pattern "strong top divergence," the top characteristics are clear. We therefore executed a position closure near $40.44 to secure the profits from this trade.
• Trade Summary: This trade resulted in a successful profit of approximately 4.41%, with both entry and exit points effectively supported by model signals, demonstrating high-quality strategy execution.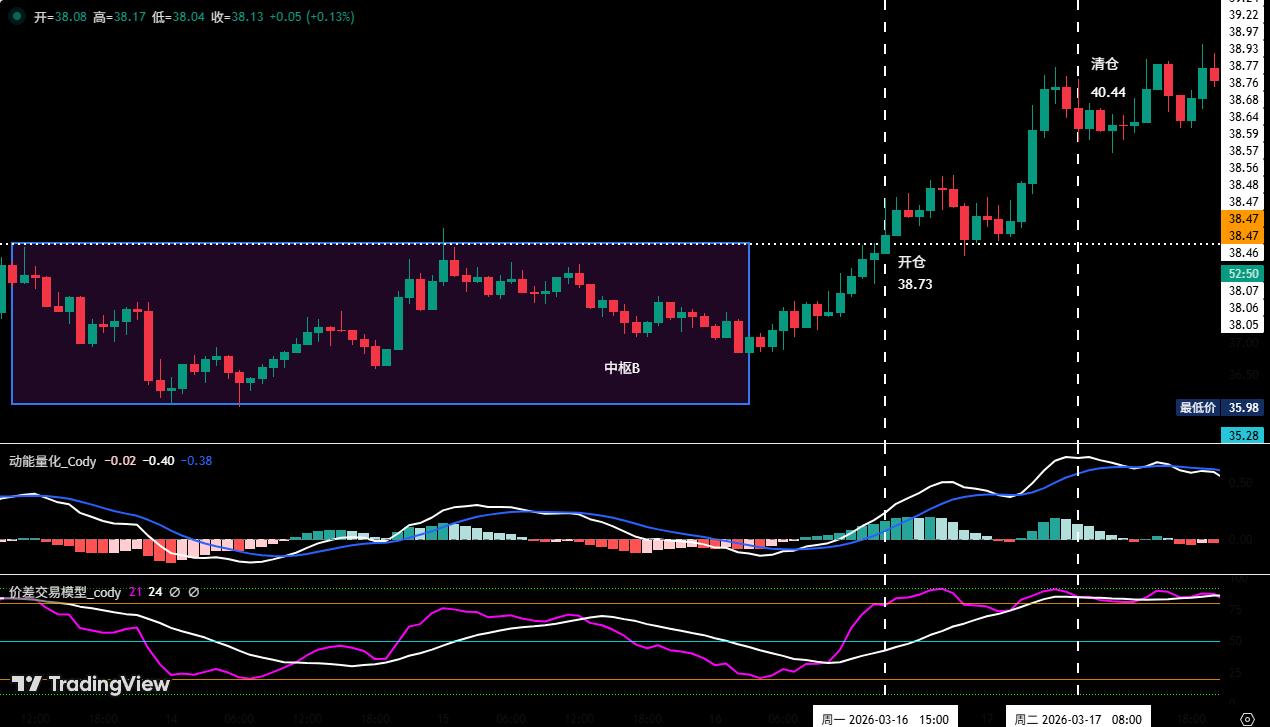
Figure 2
III. BTC Forecast and Trading Strategy for This Week (03/23–03/29)
1. Bitcoin Price Movement Structure Analysis (Based on the Low After February 6)
Using a 4-hour time frame for Bitcoin analysis:
• Maintain the previous core analytical framework: The rally that began from the February 6 low (approximately $60,000) is an oversold rebound within the larger C-wave correction, specifically the C-2 wave. The nature of this rebound limits its upside potential, followed by an upcoming C-3 corrective wave.
• Current Trend Structure Analysis: On the 4-hour chart, the short-term bullish structure formed from the February 24 low has been broken, with bulls showing significantly weakened defensive capability at key levels. If support is not reclaimed, price may further test the lower boundary of the uptrend channel established since the February 6 low. A breach of this level would substantially increase the likelihood that our previously analyzed C-2 wave rally ended near the recent high of $76,000, potentially leading to a retest of the $60,000 support level, thereby intensifying market pressure. Overall, the market remains under the dominance of a bearish trend.
• Conditions for the C-3 wave: If the price of Bitcoin falls below the low of February 6 (approximately $60,000), the C-3 corrective wave is confirmed, at which point the downside targets will be reopened, and traders should prepare contingency plans in advance.
Figure 3
2. This Week's Forecast Outlook:
The market remains in a consolidation phase; pay close attention to the battle between bulls and bears near the lower boundary of the channel (from the February 6 low). Changes in trading volume and price reaction at this level will be key indicators for determining the next directional move.
3. Key Resistance Level:
• First resistance zone: $69,500–$71,500 (previous consolidation range, primary resistance band for short-term rebounds)
• Second resistance zone: $74,500–$76,000 (near the November 2025 low, a key reference level for medium-term bearish strategies)
4. Key Support Level:
• First support level: $65,000–$66,000 range (previous key support area)
• Second support level: $60,000–$62,500 range (near the February 6 low; a break below would further strengthen the bearish structure)
• Third support level: around $57,400 (a key technical reference level below)
5. This Week’s Trading Strategy (excluding the impact of sudden news):
① Medium-term strategy:
Bitcoin daily K-line chart: (Position Monitoring Model)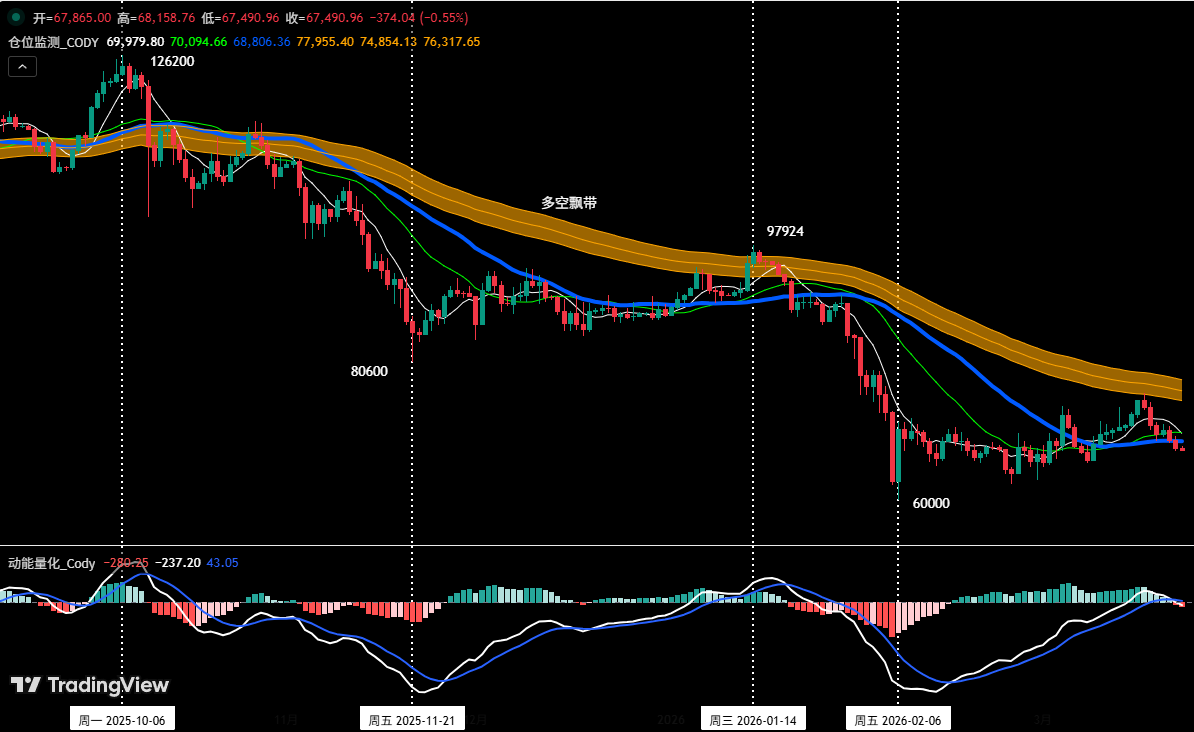
Figure 4
The position monitoring model indicates: the current price is below the bullish-bearish ribbon (yellow), and the bearish structure remains intact. According to strategy rules, we continue to hold our 60% short position established at $89,000 (January 28), with the medium-term direction unchanged.
• If the price rebounds and effectively breaks above $74,500, reduce the medium-term position to 40% to lower risk exposure.
• If the price rebounds and effectively breaks above the Bull-Bear Ribbon and holds above it, close all medium-term positions and adjust the strategy accordingly.
② Short-term strategy:
Use a 30% position size, set stop-loss levels based on support and resistance areas, and look for spread trading opportunities. (Use a 30-minute or 60-minute time frame for trading.) Strictly adhere to stop-loss discipline in short-term trading to avoid letting small losses turn into large ones.
③ Short-term Plan A/B:
Given that the medium-term market trend is bearish, the operational principle of "trading in the direction of the trend" should be followed. To dynamically respond to the market’s complex evolution and in conjunction with signals from our proprietary trading model, we have prepared two short-term trading strategies, A and B, for practical reference:
• Option A: Sell on rallies when resistance is encountered.
In the scenario where the rebound strength is limited and resistance levels are clearly encountered, execute the following:
• Open Position: When the price rebounds to the $69,500–$71,500 range and triggers a resistance signal, combined with a model top signal, establish a 15% short position.
• Add to position: If the price rebounds again and encounters resistance in the $74,500–$76,000 range, consider adding an additional 15% to your short position, spreading entries to manage average cost.
• Risk Management: Both initial stop-loss levels for the short positions were set above $77,000 and strictly enforced with no flexibility.
• Close Positions: When the asset price approaches a key support level in conjunction with model signals, gradually close positions to lock in profits and avoid the risk of missing further downside by liquidating all at once.
• Option B: Trend-following short position on breakout.
In the event of sustained price declines and structural breakdowns, implement the following:
• Open Position: When the asset price continues to adjust and breaks below the lower boundary of the channel, then retraces to that level but fails to hold above it—combined with a model-generated top signal—you may consider opening a 30% short position to capitalize on the momentum and increase profits.
• Risk Management: Set the initial stop-loss for short positions approximately 2% above the entry price (i.e., entry price × 1.02) to strictly control maximum loss.
• Close Position: When the price declines to the support level and aligns with model signals, gradually close your position to realize profits.
Four: Bitcoin Short-Term Trading Review (March 16–March 23)
1. Review of Short-Term Trading:
Last week, we executed a short-term (short) trade based on trading signals generated by our proprietary spread trading model and momentum quantification model, combined with our market trend forecast, achieving a profit of 5.37% with full discipline.
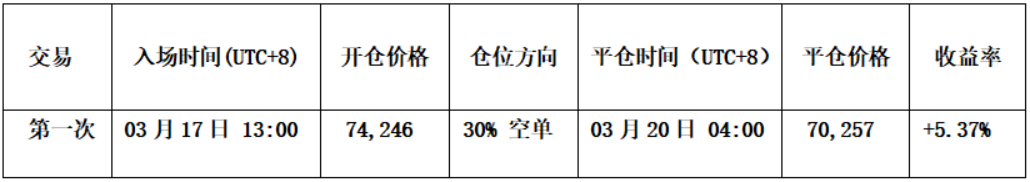
① Bitcoin Short-Term Trading Activity Summary: (Leverage ×1)
 ② Short-term Trading Review:
• Opening a position: As the coin price rebounded to around $76,000 and encountered resistance, the spread trading model simultaneously triggered a strong top warning signal (green dot in the chart), aligning with the momentum quantification model to generate a bearish consensus. The signals from both models showed high consistency, clearly indicating top-side pressure. Based on this combined signal, we established a 30% short position at $74,246, with solid justification for entry.
• Close Position: As the coin price stabilized near $69,000 and the spread trading model triggered a bottom alert signal, with initial signs of support emerging, we fully closed our position near $70,257 to lock in profits in a timely manner.
• Summary: This trade resulted in a successful profit of approximately 5.37%. The short position was accurately judged, with both entry and exit supported by model signals, demonstrating overall strong execution quality.
2. Mid-term Trading Review:
The medium-term strategy continues to progress steadily. We continue to hold the 60% short position established near $89,000 (on January 28). As of the close of last week (price approximately $67,865), the position has generated a profit of approximately 23.75%, with a peak profit of 32.58% during the period. The medium-term position is performing well overall.
Five, Special Notice
Risk management is the foundation of consistent trading profitability; please strictly adhere to the following execution guidelines:
1. When opening a position: Set the initial stop-loss immediately.
2. When profit reaches 1%: Move the stop-loss to the entry price (break-even point) to secure your principal.
3. When profit reaches 2%: Move the stop-loss to the breakeven point at 1% profit.
4. Continuous Tracking: For every additional 1% profit in the coin price, the stop-loss level will move up by 1% accordingly, dynamically protecting and locking in gains.
Financial markets are constantly changing; all market analyses and trading strategies must be adjusted dynamically. All viewpoints, analytical models, and trading strategies mentioned in this article are based solely on personal technical analysis and are intended only for personal trading logs. They do not constitute any investment advice or basis for action. Markets carry risks; invest with caution. Do not make decisions based on this information.