

The Clarity Act passed the Senate Banking Committee on Thursday leading to a rapid and strong rally for the Bitcoin price. Can this rally save the day for Bitcoin, or was the resulting lower high an omen of a possible crash to come?
$2,000 surge, but not enough
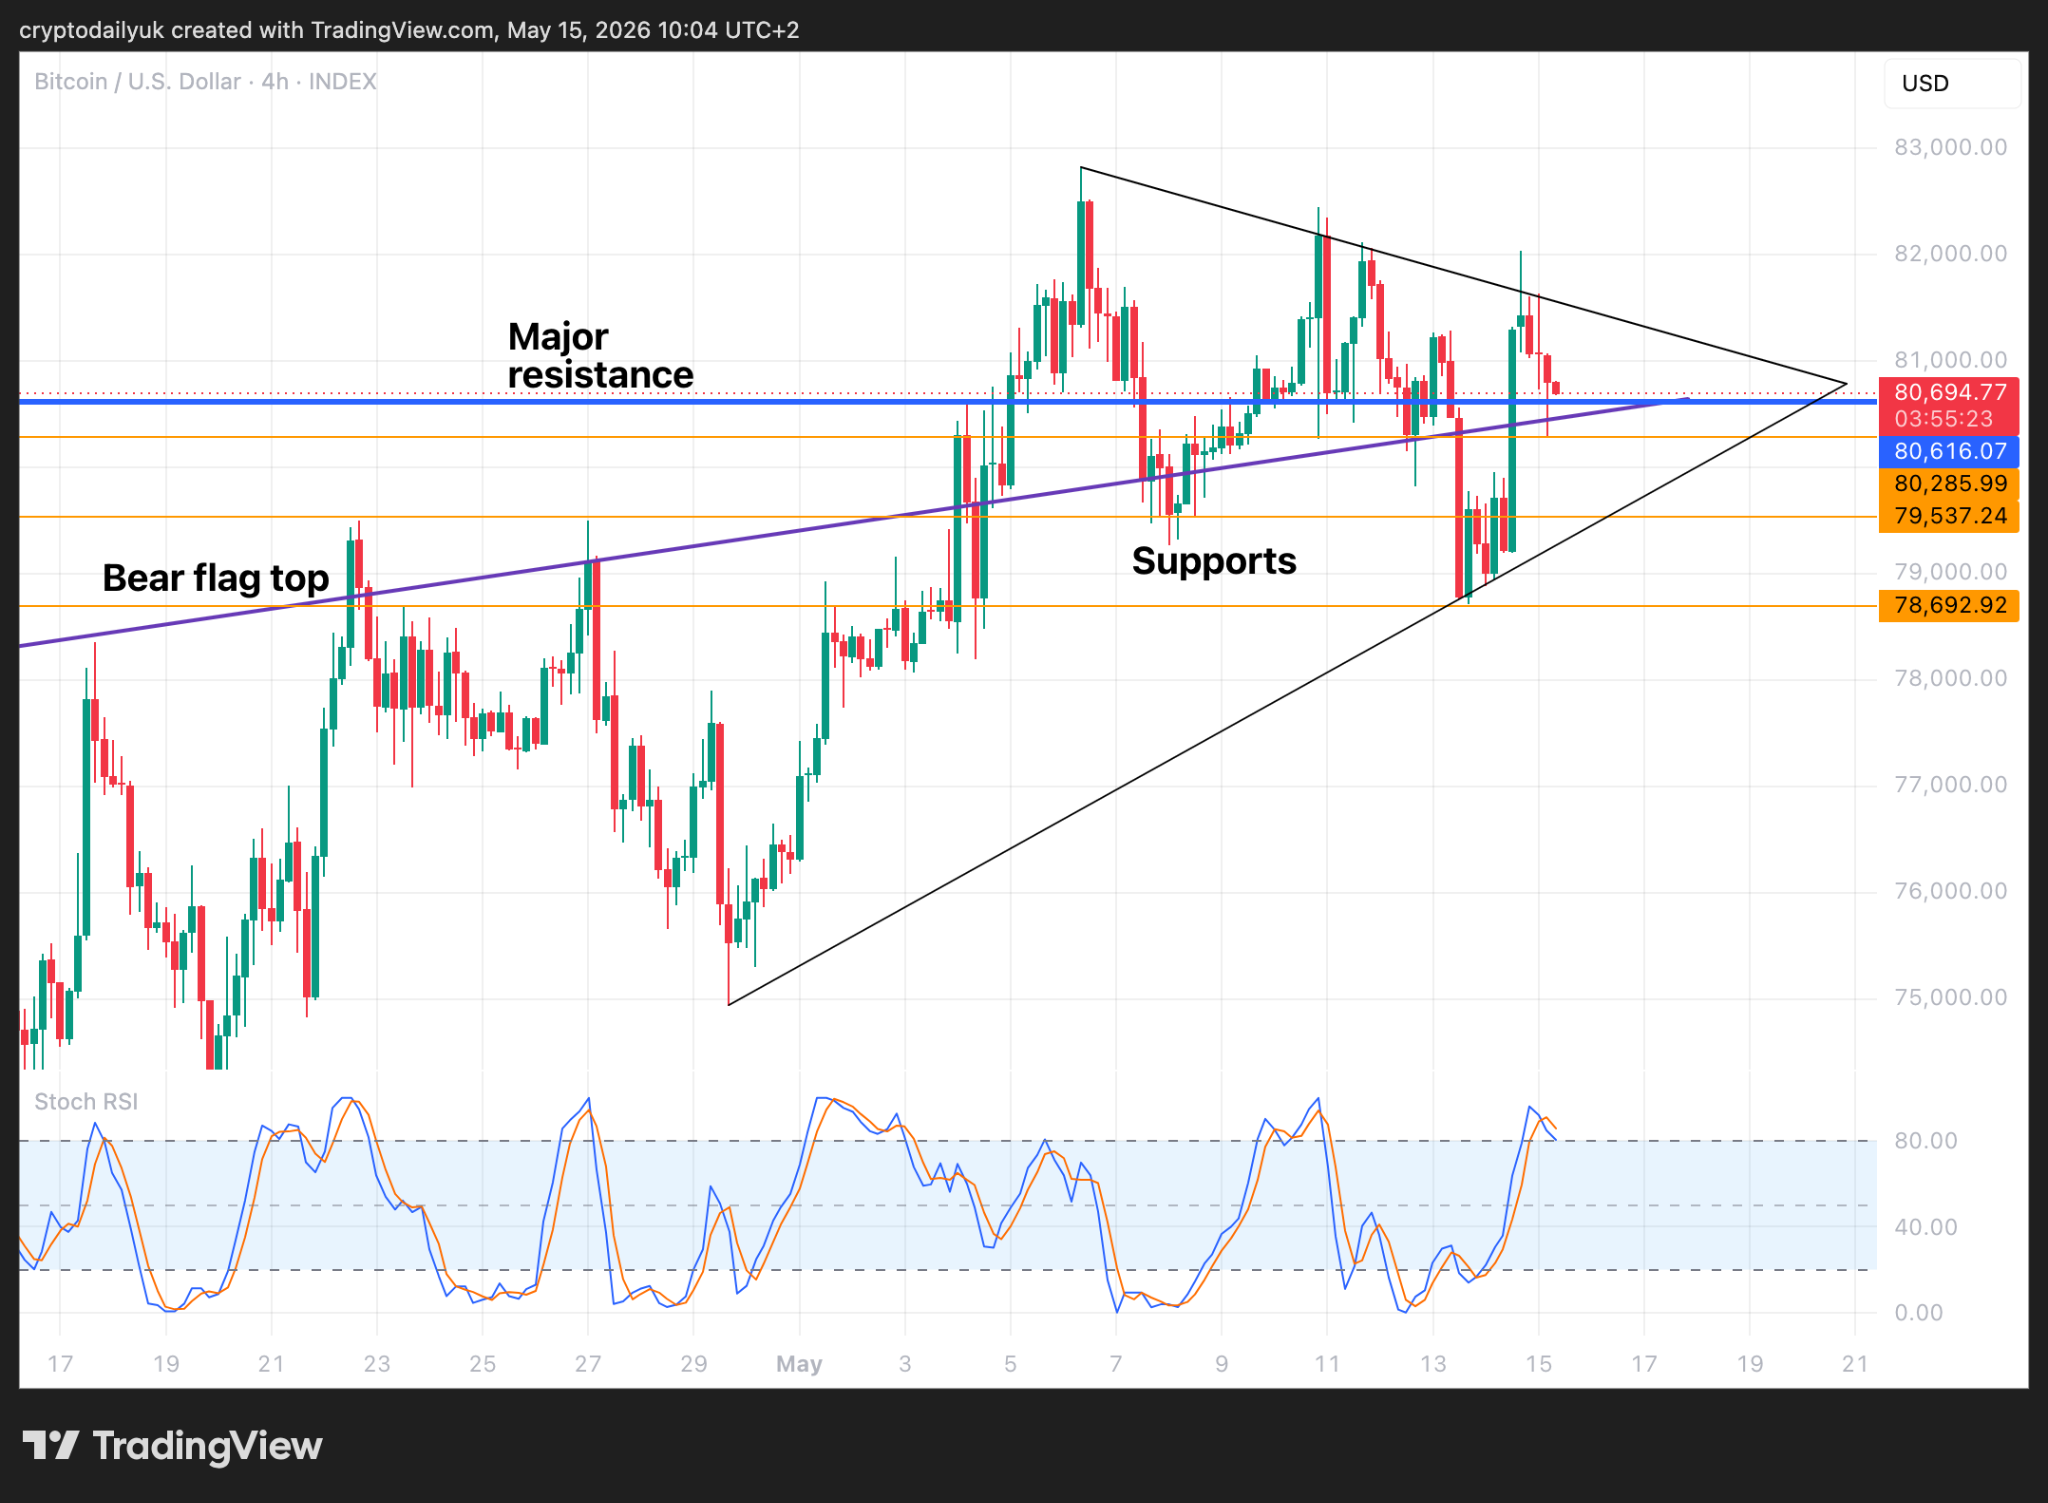
Source: TradingView
In Thursday's article on the $BTC price it was posited that: If the bulls ever needed a quick surge to the upside of around $2,000, it is now. This statement was made amidst the general negative tone of the article, and it was answered to perfection as the $BTC price surged around $2,000 briefly testing $82,000 on the Clarity Act news.
Be that as it may, the surge to $82,000 was sold down fairly quickly once it got there, leaving a candle wick to the upside. It can also be observed that the top of the wick failed to make a higher high, and the price fell down below the trendline.
As can be noted in the 4-hour chart above, the price is still above the major horizontal level and the top of the bear flag. However, with the Stochastic RSI indicators rolling over, leading to waning momentum, it may well be that the major level flips back to resistance as the price potentially falls back below.
200-day SMA holds price down
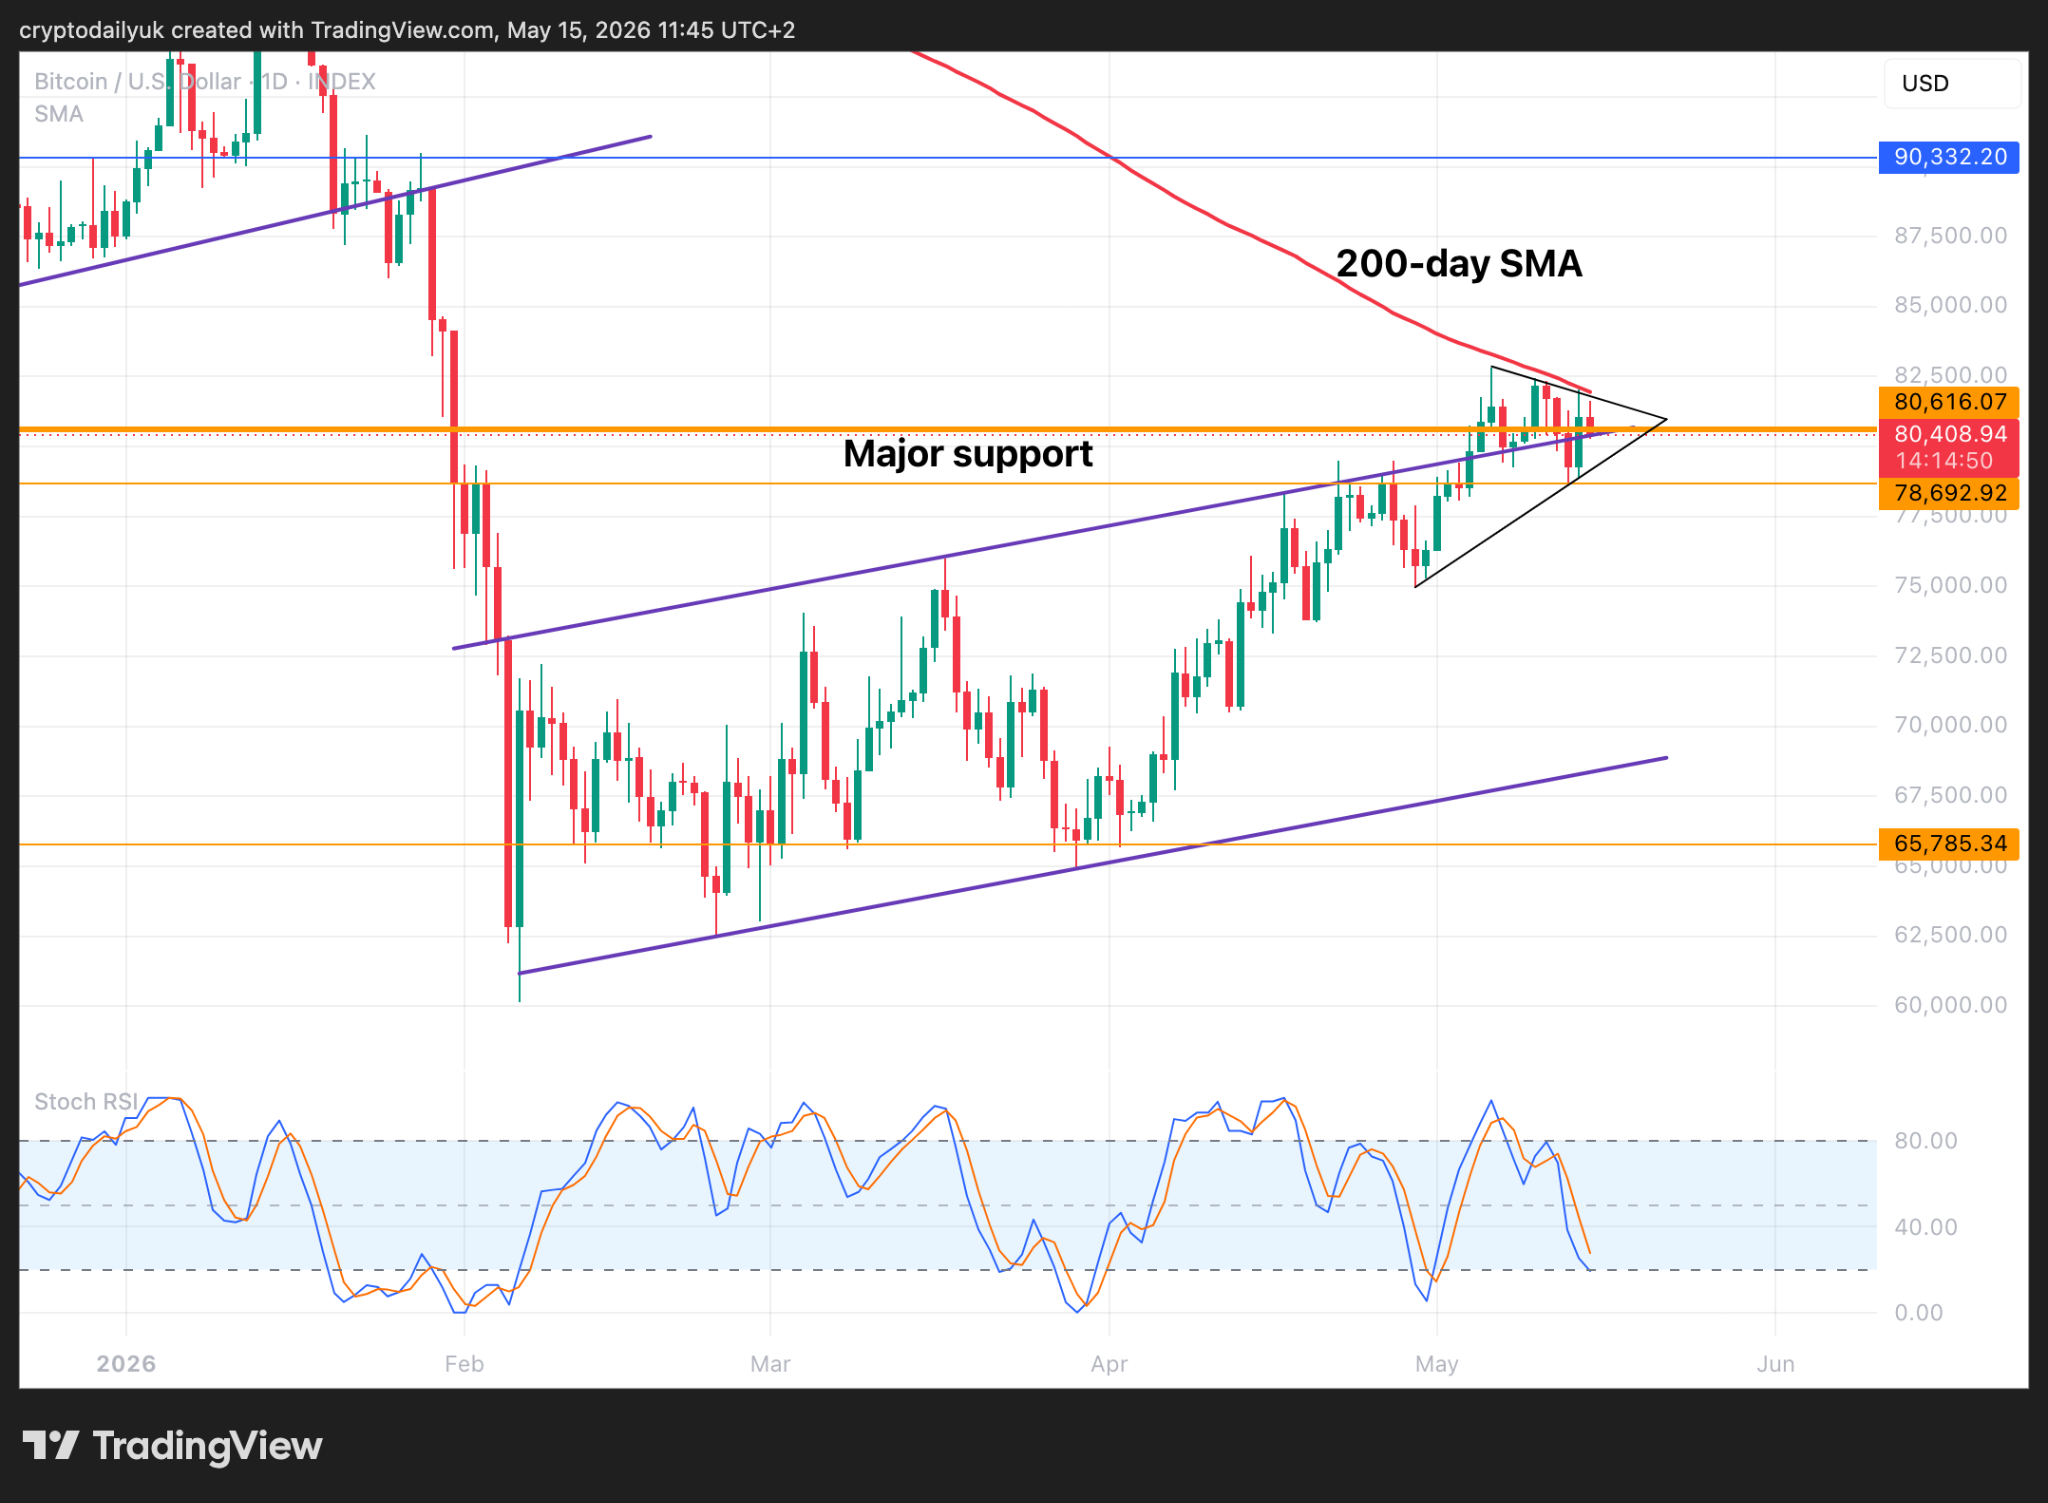
Source: TradingView
The daily time frame reveals that the $BTC price is sitting on the major support level. Today’s candle close will decide whether this support holds.
Just look at the 200-day simple moving average (SMA). This average is coming down perfectly, pressing the price down as it descends. A breakout to the upside would have to break up through the top of the triangle and also the 200-day SMA, while a break to the downside could see the $BTC price fall back into the bear flag and through the bottom of the triangle. Which will it be?
A close above or below crucial level on Sunday?
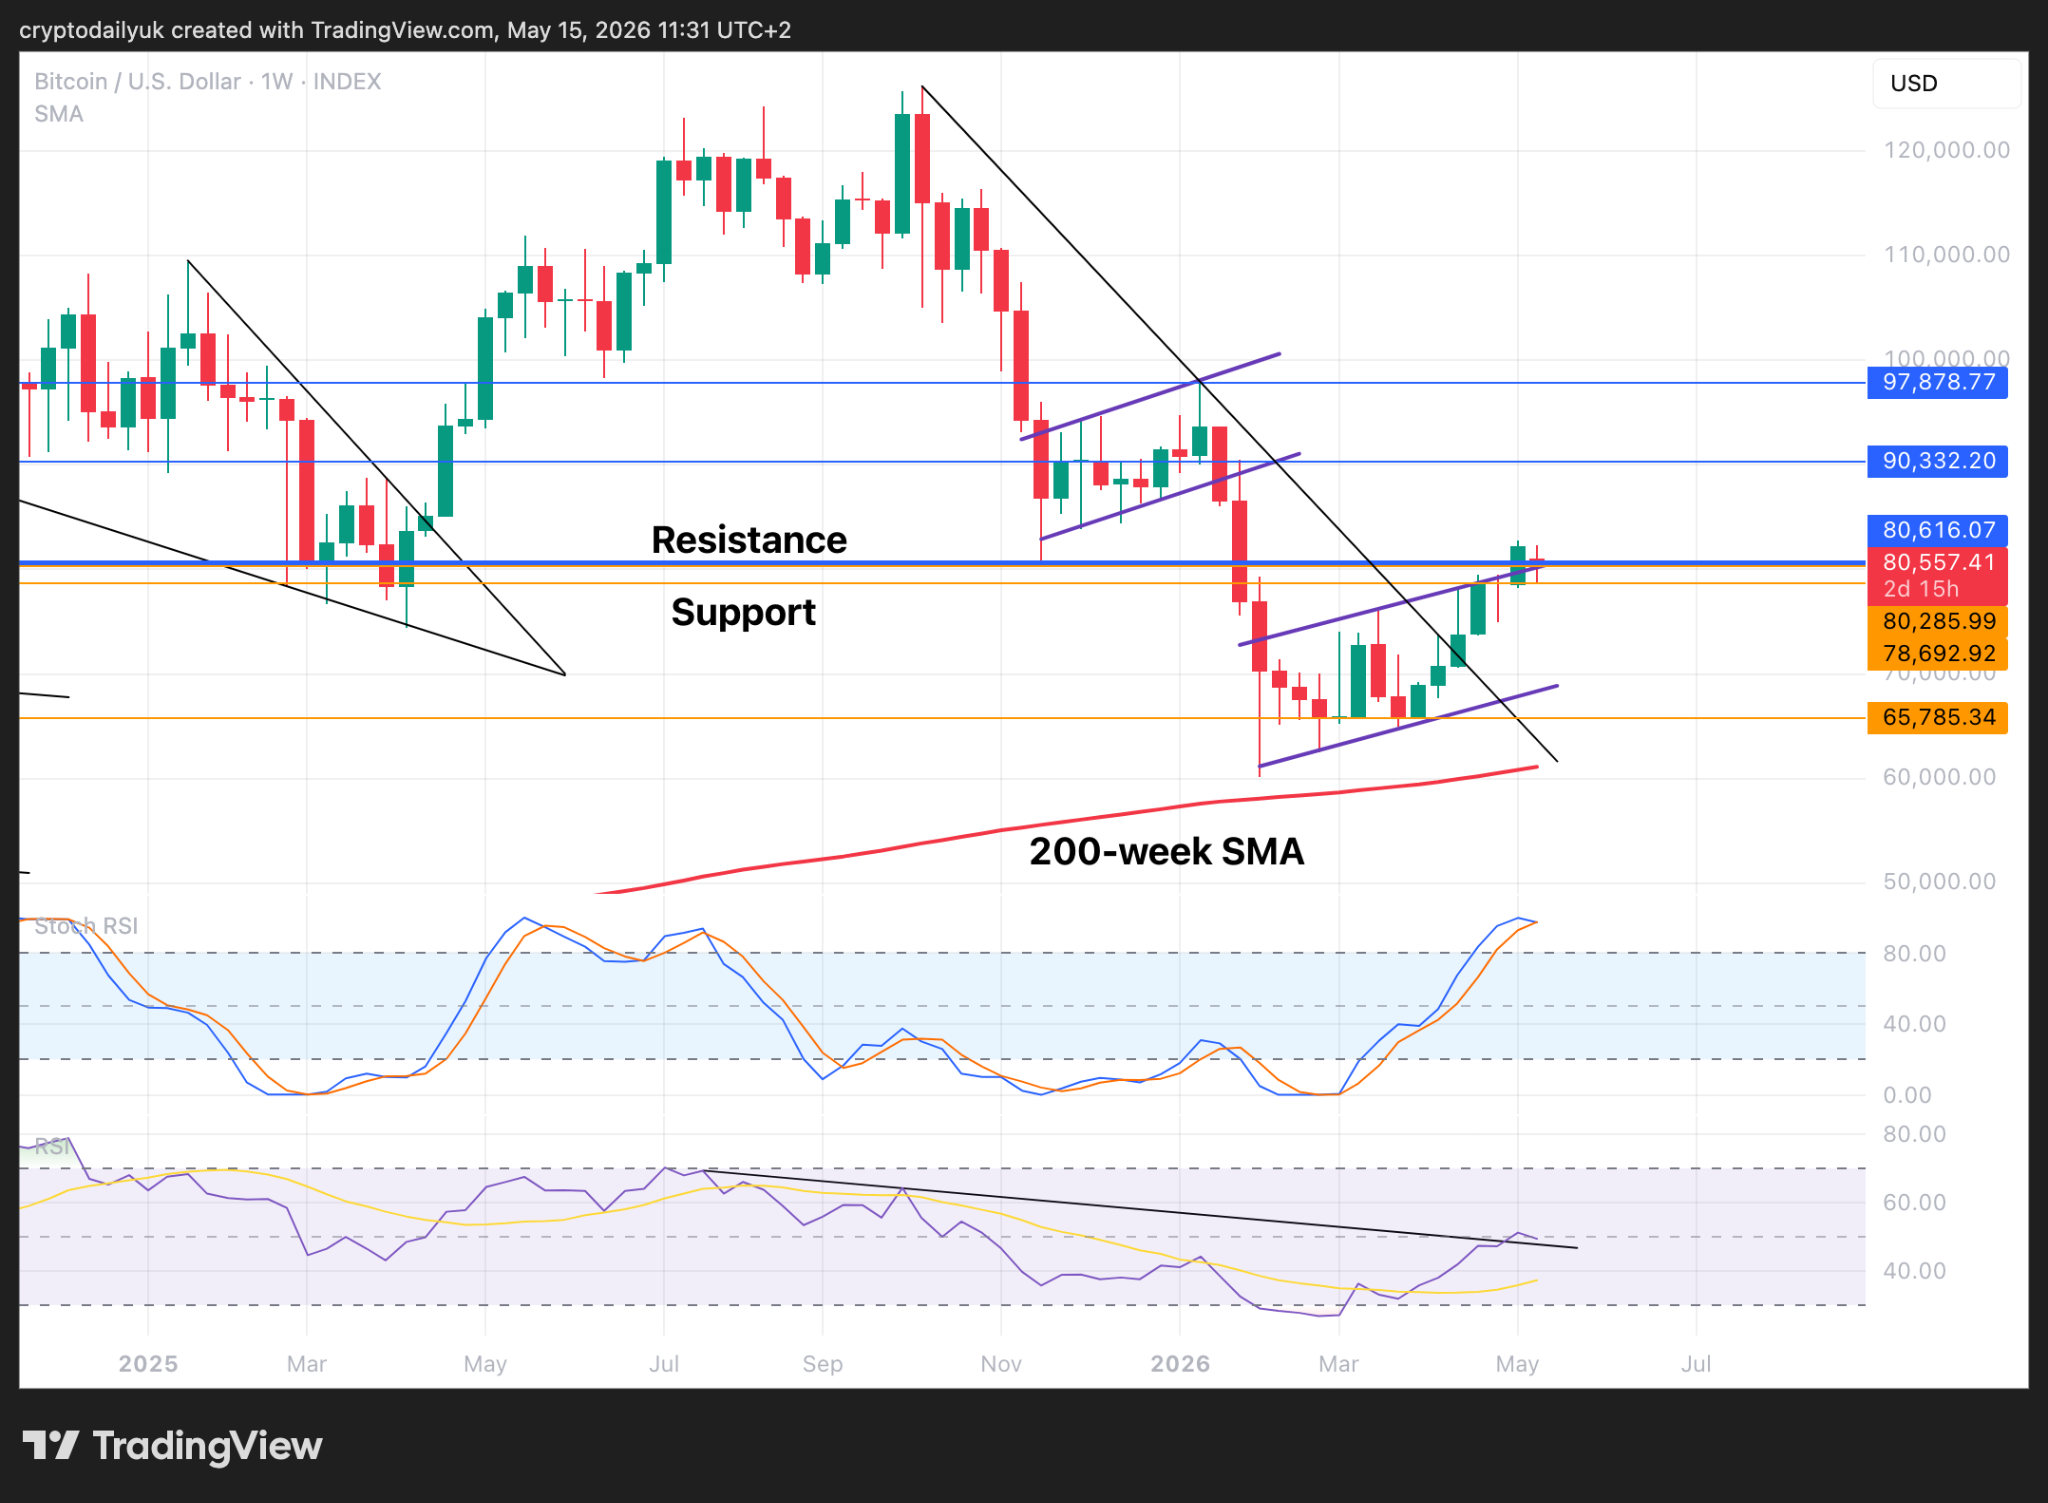
Source: TradingView
The weekly chart illustrates that the $BTC price is at a crossroads. The way forward (up and to the right) is to confirm the $80,600 horizontal level as support at the close on Sunday. This would result in a decent probability that the price carries on up to the next big $90,000 horizontal level.
There is also the chance that if the price does close below $80,600, there could still be the possibility that the price confirms $78,700 instead, a decent support level not far below. This would arguably still keep the bulls in the fight.
However, if the close is below both of these levels at the end of the day on Sunday, the likelihood would be that the price falls all the way down to the bottom of the bear flag, and the $66,000 horizontal support.
It needs to be noted, especially if the following weeks contain mostly negative price action, that a retest of the bear market trendline could still take place. This would bring the price all the way back down to the 200-week SMA, also with the possibility of a double bottom. This weekend will be crucial.
Disclaimer: This article is provided for informational purposes only. It is not offered or intended to be used as legal, tax, investment, financial, or other advice.