


I. Market Overview
Today's market logic overview:
On March 5, 2026, the global cryptocurrency market demonstrated strong resilience and structural rebound characteristics after a period of deep correction and volatility. Driven by shifting U.S. policy expectations, reduced geopolitical risks, and sustained institutional capital inflows, Bitcoin (BTC) successfully reclaimed the $70,000 psychological threshold within the past 24 hours, briefly reaching a high of $74,000, signaling the market’s official entry into a second phase of upward momentum led by policy-driven tailwinds.
Today’s market dynamics can be summarized as a “policy-driven short squeeze.” U.S. President Donald Trump publicly endorsed the Digital Asset Market Clarity Act, significantly alleviating the risk premium that had been driven by regulatory uncertainty. In the derivatives market, this shift in sentiment directly triggered over $500 million in short positions being liquidated, providing strong momentum for a sharp price surge. However, the macroeconomic environment of high interest rates persists, with the U.S. 10-year Treasury yield holding steady at 4.11% and the U.S. Dollar Index (DXY) at 98.813, reflecting that global liquidity conditions remain in a “tight” equilibrium.
Risk and Opportunity Assessment: Transitioning from Defense to Actively Seeking Alpha
Based on a deep analysis of liquidation data and macro liquidity, the current primary downside risk has shifted from "trend-driven decline" to "high-volatility retracement." Although long positions across the network have been extensively liquidated, the liquidation heatmap reveals a cluster of approximately $218 million in long liquidations near $65,000, suggesting that if spot buying pressure fails to achieve a decisive breakout near $75,000, the market may experience a secondary bottom to clear short-term floating supply.
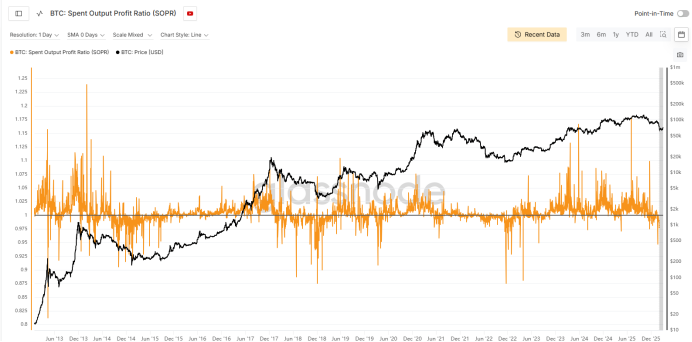
Potential opportunities lie in the "bottom confirmation" signaled by on-chain metrics. The Bitcoin SOPR indicator is currently in the oversold zone below 1.0 (approximately 0.95–0.99) and has begun to show signs of turning upward—a historical signal that long-term holders (LTHs) are ceasing panic selling and entering a new accumulation phase. Additionally, the MVRV Z-Score stands at 0.46–0.627, reflecting a relatively low valuation level historically, indicating that the asset’s fair value remains underestimated by market sentiment, offering institutional investors an attractive dollar-cost averaging range.
Macroeconomics and Policy: The Convergence of U.S. Treasury Yield Curve, Federal Reserve Intentions, and Geopolitical Factors
Minneapolis Fed President Kashkari’s recent remarks were typical, emphasizing that if inflation data continues to cool, there could be one to two rate cuts later this year. However, current supply-side concerns triggered by the “shadow war” are limiting the Fed’s incentive to act prematurely. This “hold steady and wait for a turning point” tone has kept the 10-year U.S. Treasury yield at 4.11%, exerting some downward pressure on cryptocurrencies as risk assets due to interest rate discounting. Yet, as markets price in inflation expectations stemming from tariff policies—such as Trump’s announced 15% import tariffs—the hedge attribute of Bitcoin as an “inflation-resistant hard asset” has once again come to the fore.
Geopolitically, tensions in the Middle East, particularly around the Strait of Hormuz, have briefly elevated oil prices and suppressed risk appetite, but their impact on the crypto market is gradually diminishing. This “war fatigue,” combined with major policy tailwinds—Trump’s strong support for the Digital Asset Market Clarity Act—forms the macroeconomic backdrop for today’s rebound. The policy transmission pathway is clear: increased regulatory clarity → lower compliance costs → stronger institutional allocation意愿 → spot premium driving price increases.
Market Analysis of BTC and ETH: Technical Recovery and the Battle for Dominance
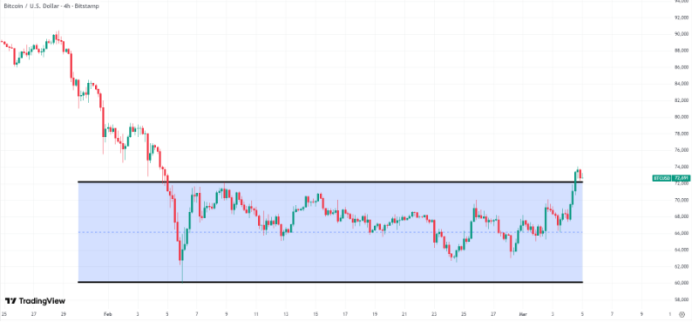
BTC Technical Analysis: Bitcoin’s performance today has been a textbook “V-shaped reversal.” After dropping to the so-called “war low” of $63,000, the price rapidly rebounded above $72,000, fueled by the liquidation of short positions. Currently, the price is on the verge of breaking out of its descending channel; the 4-hour RSI has entered the strong zone (approximately 53.18) but has not yet reached overbought levels. Short-term resistance has shifted upward to the $74,400–$75,000 range, a prior area of high concentration of orders and a key Fibonacci 0.382 resistance level.
ETH Technical Analysis: Ethereum rebounded approximately 8% today, successfully reclaiming the $2,000 psychological level, and is currently trading at $2,129. Despite the price recovery, the ETH/BTC exchange rate remains at a historical low, reflecting continued investor preference for BTC amid market uncertainty. Ethereum’s key support level is near $1,980, backed by a buy wall of $129 million. On-chain, with 3.4 million ETH still queued to enter the validator set and an average wait time of 60 days, institutional demand for long-term ETH staking continues to far outweigh short-term selling pressure.
Note: This section provides market information and methodological discussions and does not constitute investment advice or an offer. Cryptocurrency assets are highly volatile; please make independent decisions based on your own risk tolerance.