


Bitcoin recently pushed into a key liquidity pocket near the $73,000 level, briefly tapping overhead liquidity before encountering a sharp reaction to the downside. With structure still holding and buyers stepping in on dips, attention is now shifting to whether this positioning phase could set the stage for a stronger push toward the $80,000 region.
Upper Liquidity Sweep Before Sharp Rejection Near $74,000
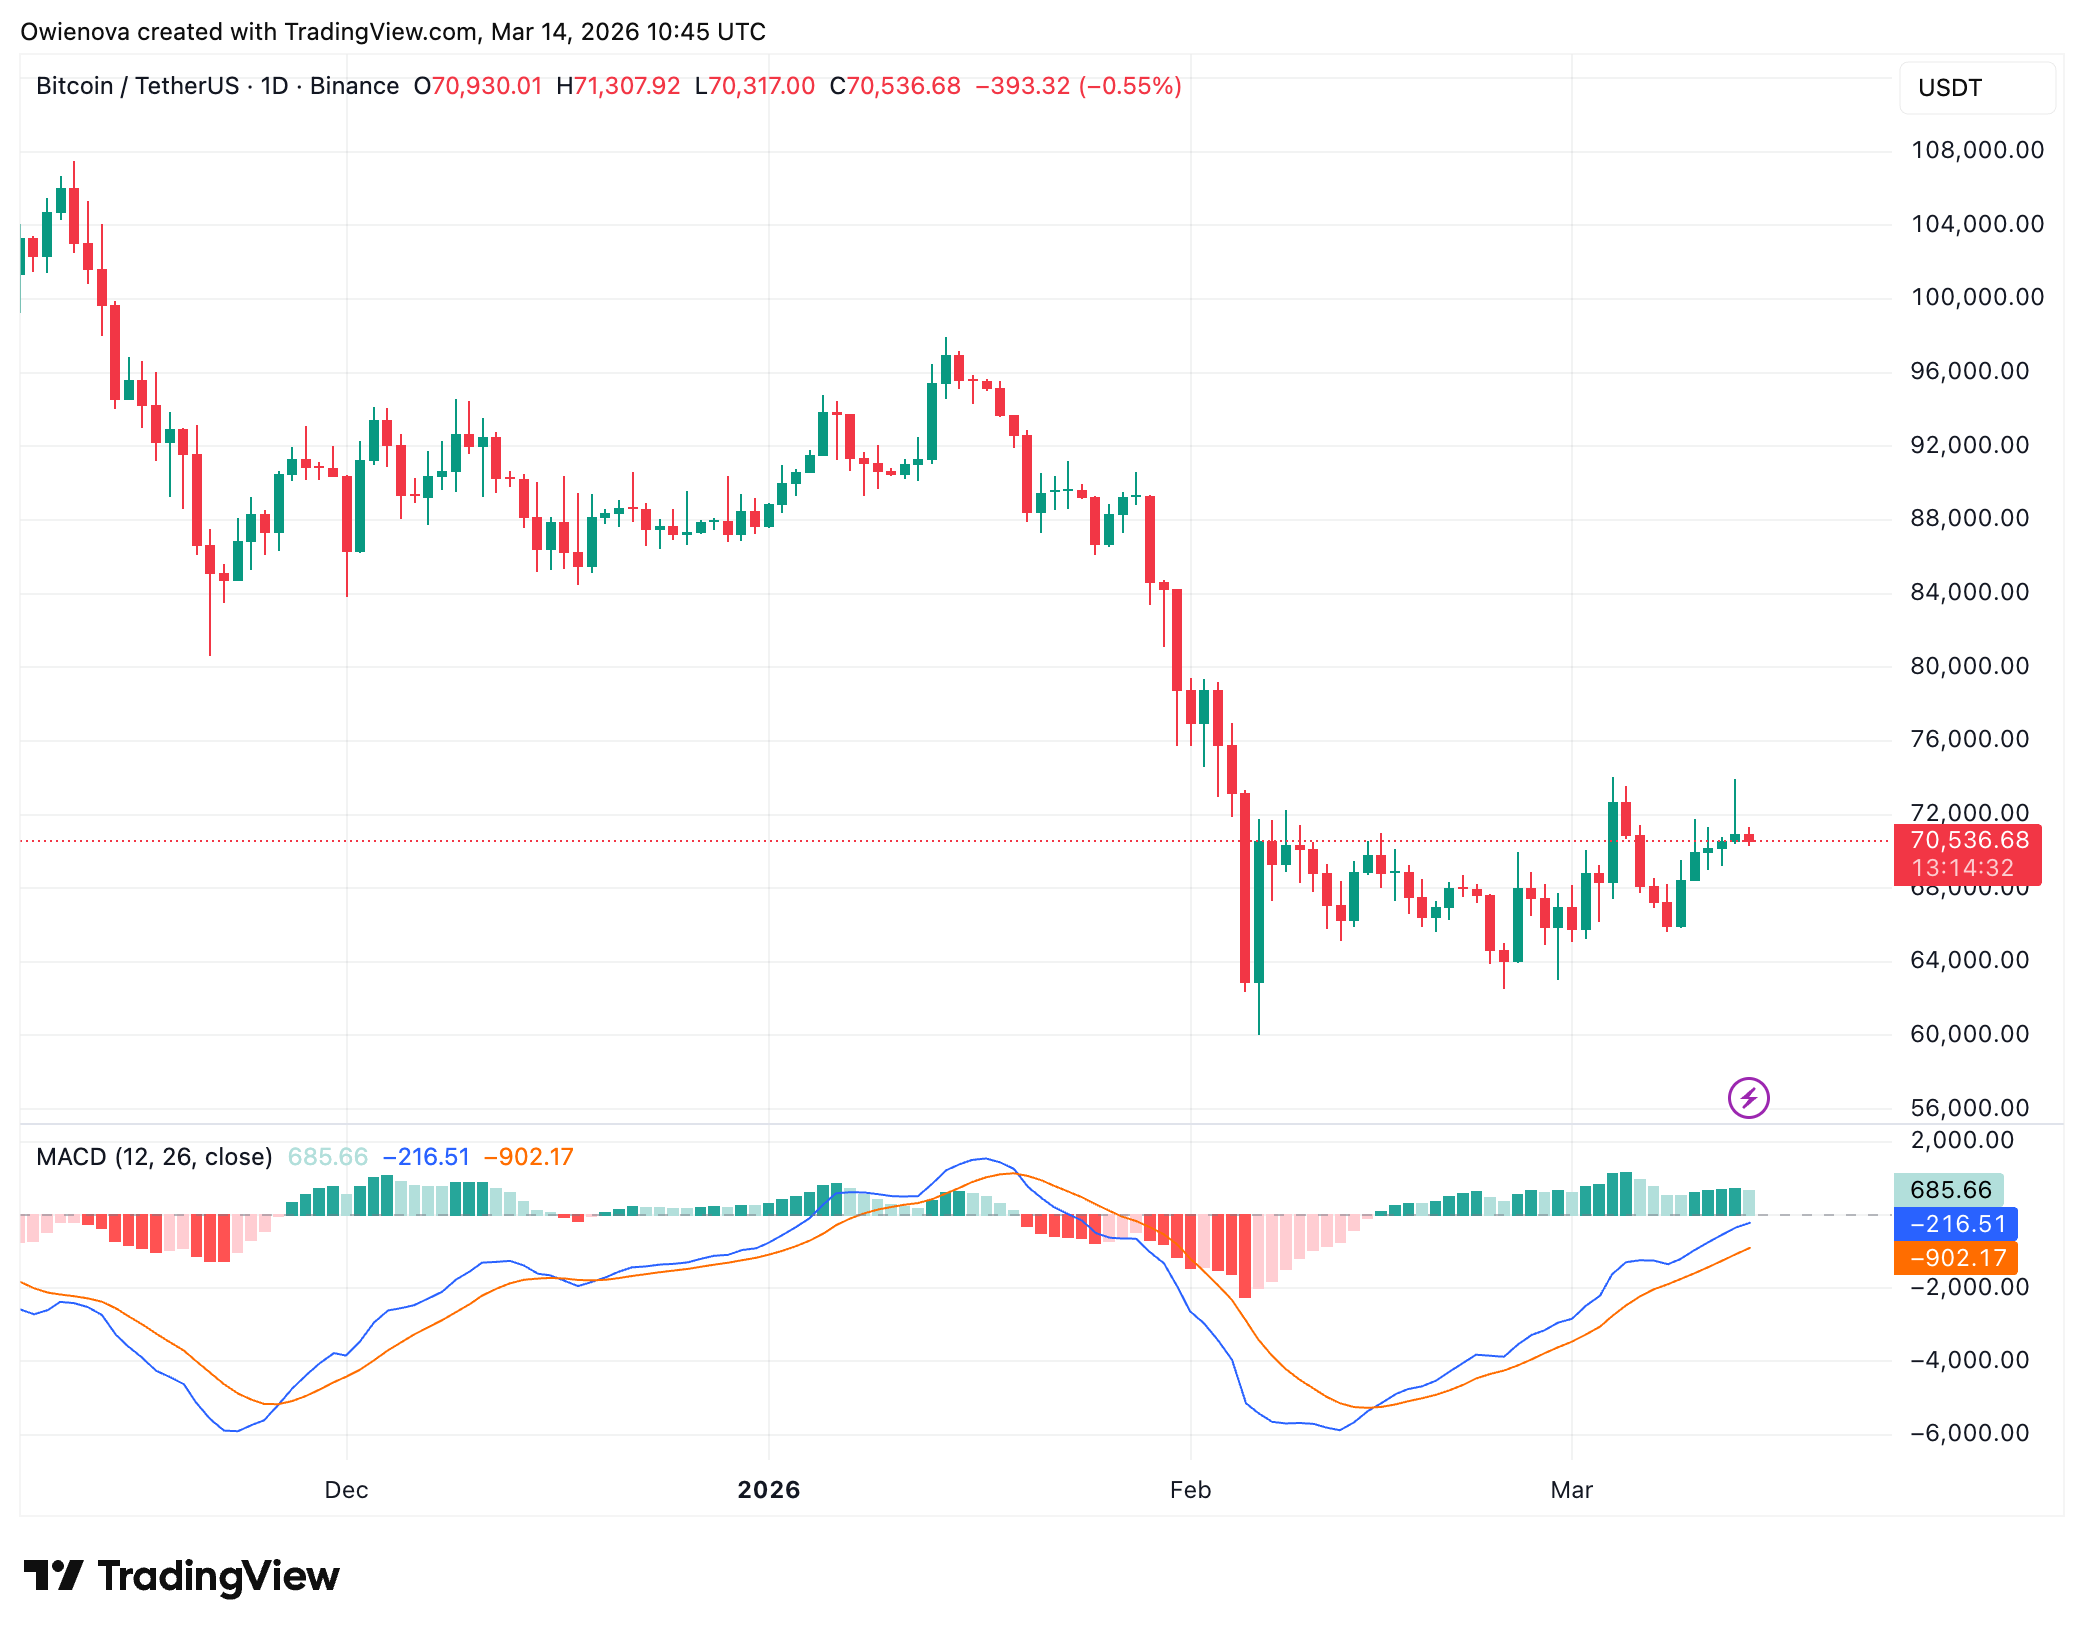
According to the latest MMT Heatmap update from Columbus, Bitcoin experienced a significant surge into the upper liquidity pocket during the overnight session. The price climbed aggressively to the $73,000 mark, testing the strength of overhead supply. However, this momentum was met with a sharp corrective reaction as it approached a substantial liquidity cluster situated near $74,000.
This specific price action is characterised by a market that is probing for liquidity without establishing immediate value acceptance. Here, there is a sweep, followed by investors building positions; a standard market mechanism where high-interest zones are cleared out before the market gathers the necessary structure to sustain a more permanent move higher.

Currently, Bitcoin remains in a rotation phase as it attempts to solidify a reclaim above its previous channel resistance. This transition period is vital for converting old resistance into support, providing the technical foundation required for the next leg of the bull cycle.
The broader outlook remains cautiously optimistic, provided that buyer demand is resilient and does not fade anytime soon. As long as bids continue to rebuild aggressively on every minor dip, the underlying market structure maintains its bullish bias.
Bitcoin Tests Historic Weekly Support–Resistance Zone
Bitcoin’s weekly chart shows that the price is currently negotiating one of its strongest support and resistance zones, a level that dates back to the week of March 11, 2024. Market action around such historically significant areas often determines the next major directional move, as both buyers and sellers tend to defend their positions aggressively.
Crypto analyst Christopher Inks notes that momentum indicators still leave plenty of room for further upside. Both the weekly RSI and the Stochastic RSI remain far from overheated territory, suggesting that Bitcoin could still extend its move higher and potentially push into the $80,000 region if bullish momentum continues to build.
Christopher Inks has also emphasized throughout the year that a strong, impulsive weekly candle breaking and closing above the yearly pivot at $96,071.25 would be a major signal for the market. Such a move would confirm that the cycle low is already in place and could open the path for Bitcoin to advance toward a new all-time high.