


Key Insights:
- Bitcoin price trades around $88K as whales try to protect the $85K-$87K support zone.
- Fear & Greed Index drops down to 20, which is extreme fear during elevated prices.
- Heavy sell liquidity over $90K locks BTC in a range bound setup.
Bitcoin is trading around $88,000 amid very fearful investor sentiment. The market still shows hesitation, with BTC unable to break through key resistance. Analysts and data are pointing to significant liquidity walls and support retests.
Bitcoin Price Sentiment Turns Bearish as Fear Index Hits Extreme
Bitcoin price Fear and Greed Index currently stands at 20 out of 100, placing the market in the “Extreme Fear” category. This measure implies that a majority of investors are risk-averse and the momentum is on the downside. Although BTC price was trading just above $88,000, many participants in the market remain cautious.
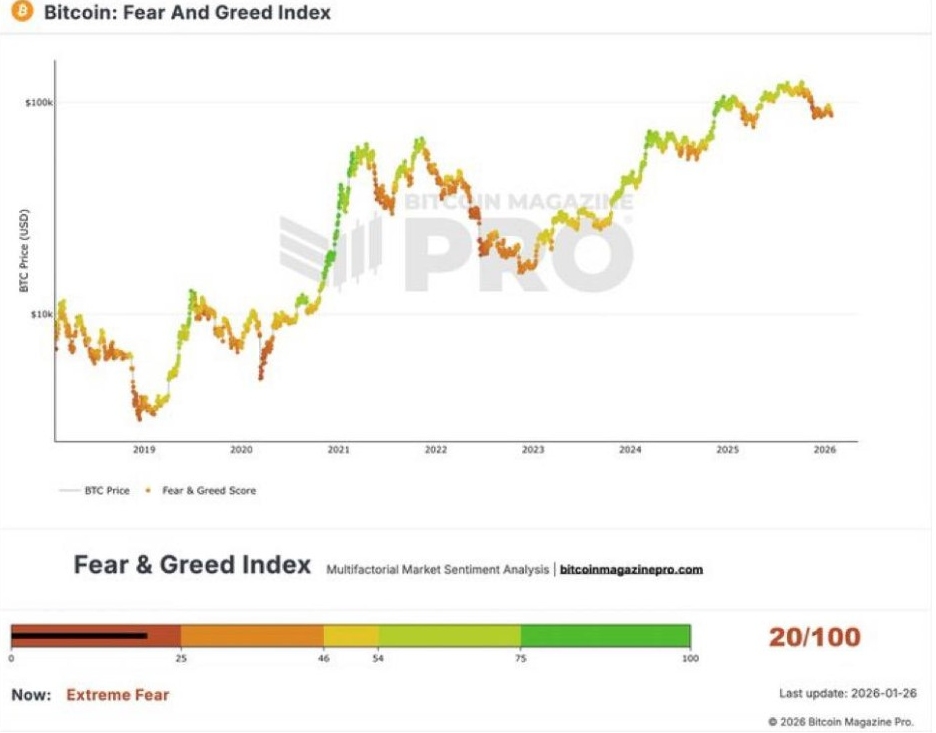
The fear-driven conditions have often preceded strong upward movements in the past. However, sentiment is not the sole determining factor of short-term price action. MisterCrypto shared a chart showing a history of sentiment cycles, with fear often aligning with pullbacks or local bottoms. This time, however, Bitcoin is still close to recent highs, making this fear-driven environment unique.
Key Levels hold as Support Retests Continue
Analyst Ted Pillows pointed out that Bitcoin price recently tested the support level of $87,000, which has been holding firm a number of times. The chart showed significant levels of resistance above, especially at $90,000, $94,000, and $98,000. For the bulls, getting back $90,000 is important for further upside.
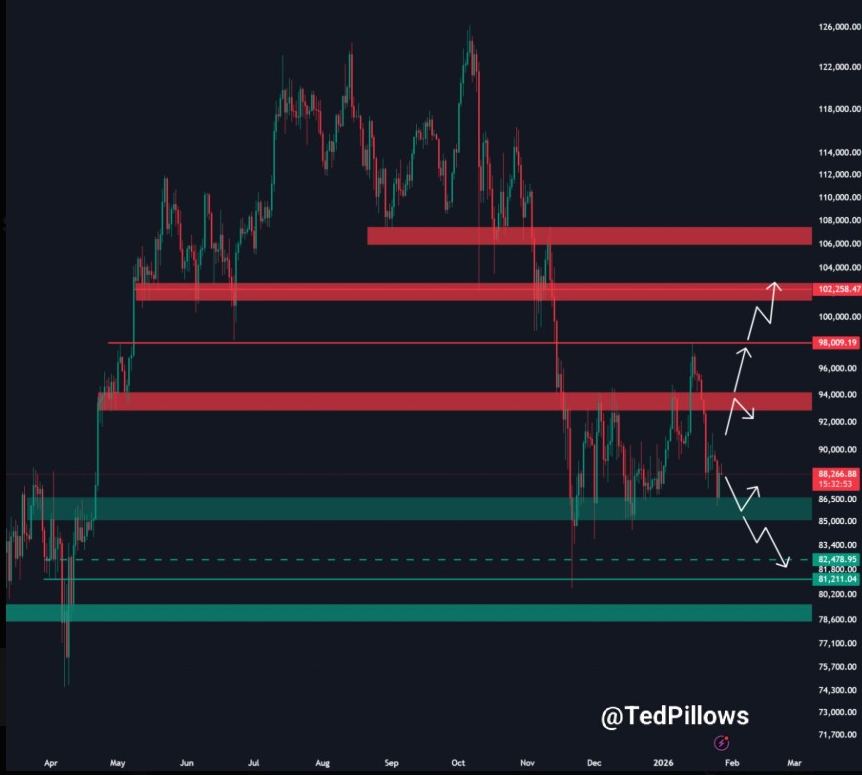
If buyers don’t push the BTC price beyond this resistance, there’s a risk of a price sweep of the $85,000 zone, which offers more support. The structure is still range-bound, and momentum seems neutral. Bulls have to defend down lower to avoid a breakdown. The bounce at $87,000 shows temporary strength, but a move above $90,000 is needed to flip sentiment.
BTC Whale Activity Strong Defense at $86K-$87K
Order book data taken from CoinGlass showed clear whale behavior at current levels. Large buy orders are stacked at $86,000 to $87,000, indicating interest from high-value traders in defending this area. Conversely, sell walls are seen right above $89,000 to $90,000, which is in line with current resistance.
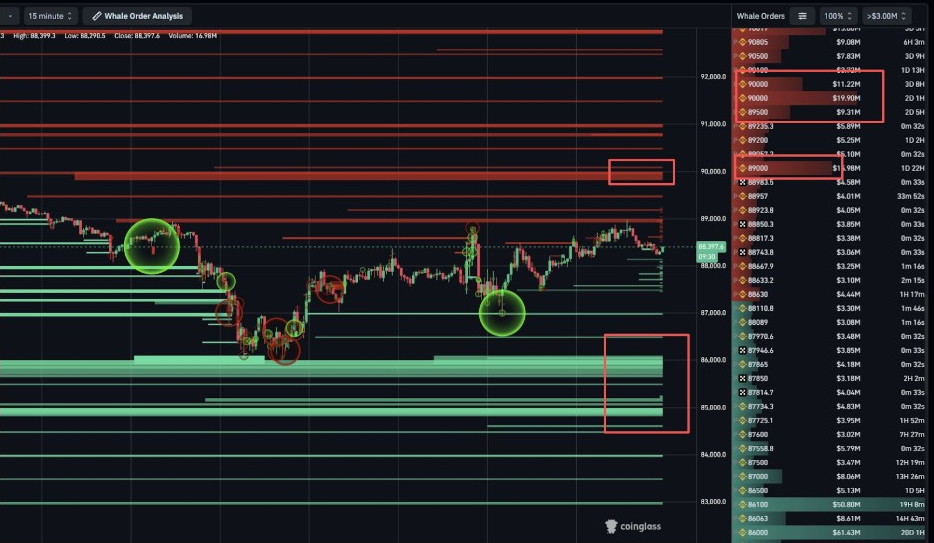
This liquidity range forms a compression zone. Traders sit and watch price reactions at the extremes of this band. If whale sell orders at $90,000 are filled and the price moves higher, it could change the momentum. For now, the presence of liquidity both above and below keeps BTC stuck in a tight range.
Additionally, there are significant clusters of buy orders below $85,000, which could act as the next cushion against higher support failure. This behavior implies that Bitcoin’s current move is liquidity-driven, not yet a directional breakout.
Weekly Patterns Suggest Another Dip Before Surge
Meanwhile, Trader Tardigrade noted a repeating pattern on the BTC weekly chart. The recent structure resembles a prior correction and rebound phase during early 2025. In either case, there was a double bottom in BTC before it launched higher.
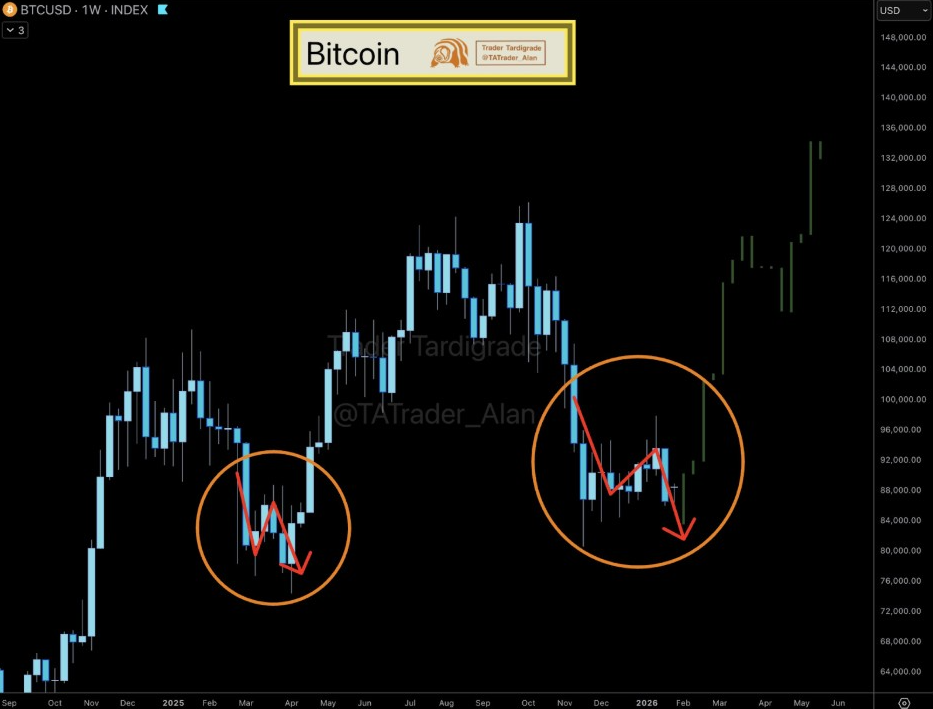
The current structure suggests that Bitcoin price may have to test lower levels one more time before it breaks out. If this fractal pattern holds up, a final dip down to the $85,000 – $83,000 range could be followed by a big move up.
The post Bitcoin Price Holds Support Amid Extreme Fear and Tight Whale Liquidity Zones appeared first on The Market Periodical.