


Key Insights:
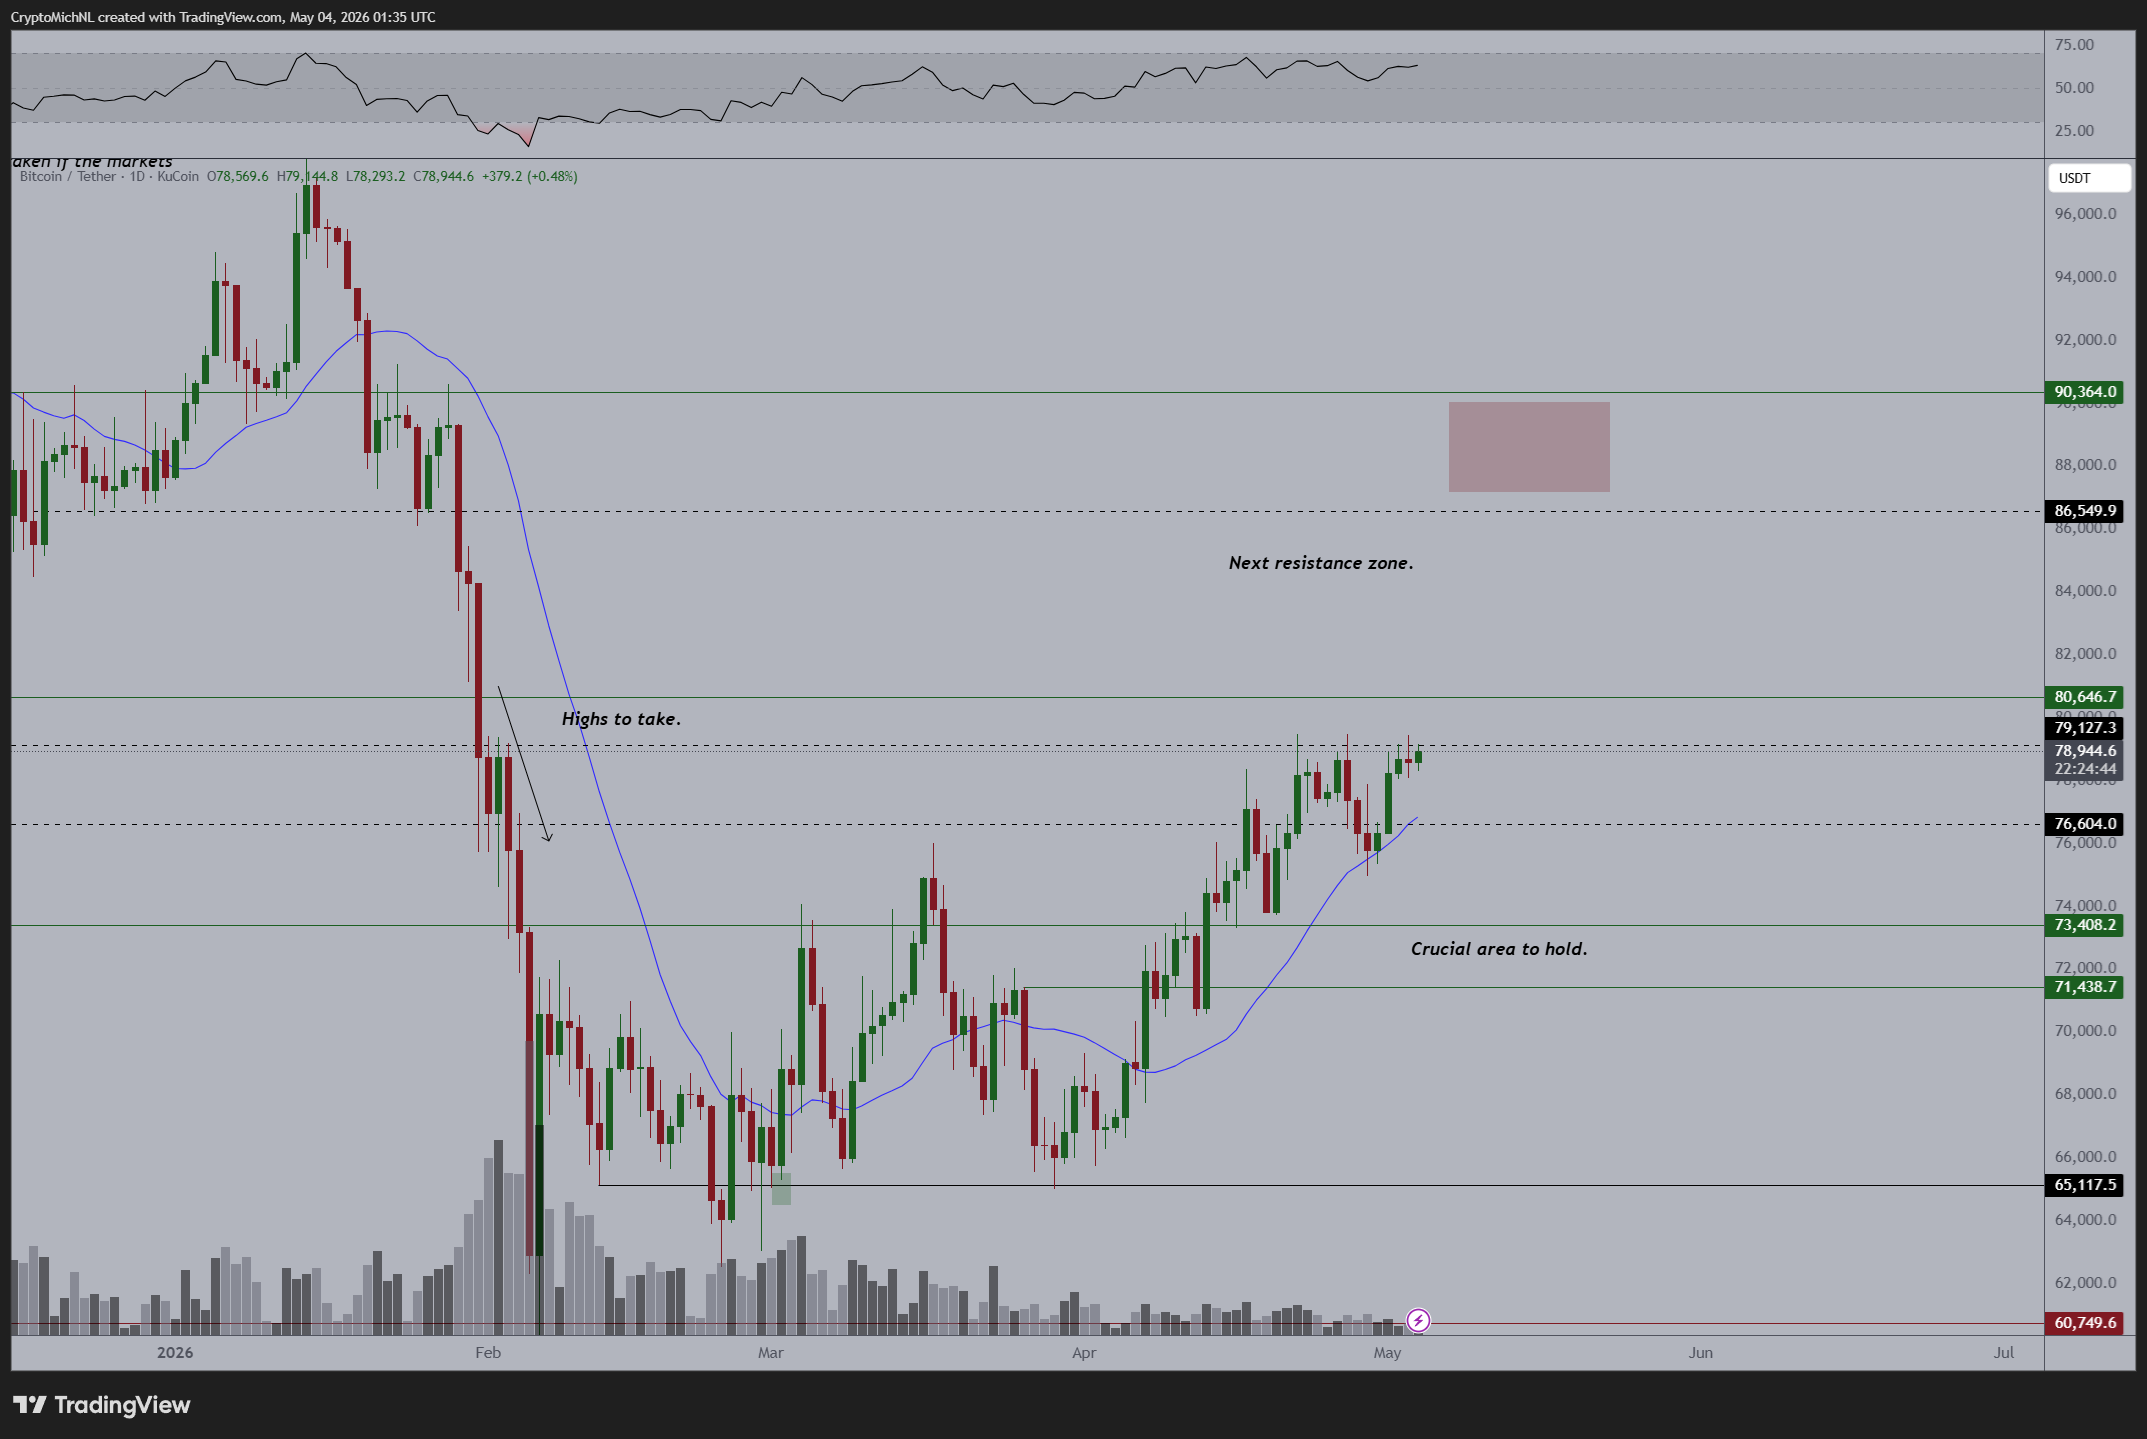
- Bitcoin price targeted $86K–$88K after breakout signal.
- CME gaps near $84K acted as price magnets.
- The MVRV ratio at 1.45 showed improving market strength.
Bitcoin price moved toward a potential breakout zone on May 3 as analysts tracked rising momentum. Market participants reacted to recent exchange-traded fund inflows and shifting derivatives data. The move followed a steady recovery after months of muted price action.
Bitcoin price narrative shifted as traders focused on improving valuation signals and institutional demand.
Analysts tracked a combination of ETF flows, futures gaps, and on-chain indicators to assess near-term direction. This alignment suggested the market entered a recovery phase rather than a late-cycle rally.
Bitcoin Price Reacted To ETF Flows And CME Gaps
Michaël van de Poppe said the Bitcoin price showed upward momentum ahead of the U.S. market open. He pointed to strong ETF inflows from the previous Friday as a key catalyst. The move indicated rising institutional participation, which supported short-term price strength.
Daan Crypto Trades observed new Chicago Mercantile Exchange gaps forming during early trading sessions. He noted that gaps around key levels often acted as price magnets during trending markets. This behavior reflected how derivatives traders positioned around liquidity zones.
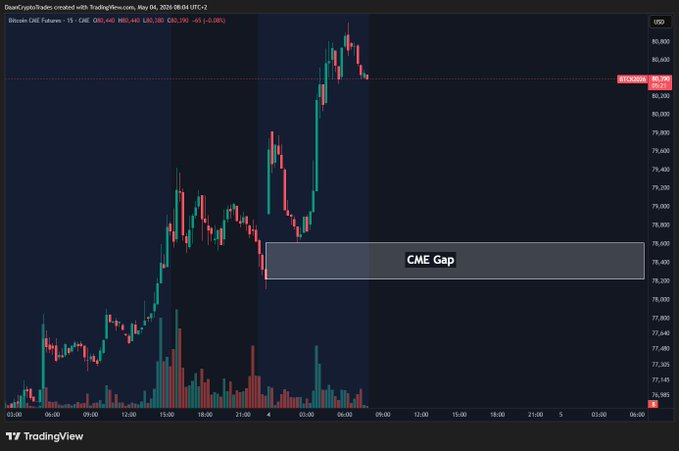
That reaction mirrored prior cycles when gaps influenced intraday reversals and continuation patterns. Traders tracked these zones closely because they often aligned with short-term support or resistance levels. This alignment strengthened the case for continued volatility in the near term.
Bitcoin Price Gained Support From On-Chain Recovery Signals
Arab Chain reported that the Market Value to Realized Value ratio climbed to 1.45 during the latest recovery phase. This reading marked one of its highest levels since early 2026. The shift indicated improving investor profitability after a prolonged correction period.
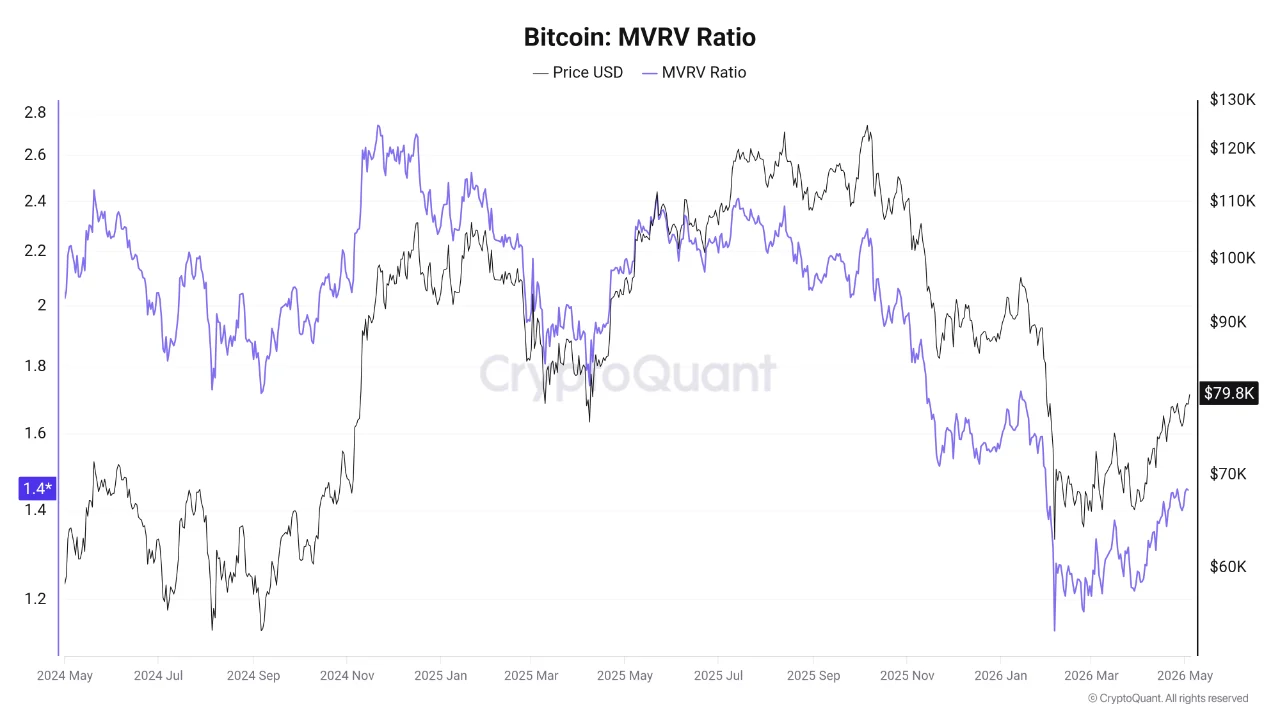
The metric remained below levels historically linked to overheated market conditions. That positioning suggested the market had room for further upside without triggering broad profit-taking pressure. It also reflected growing confidence among holders returning to accumulation behavior.
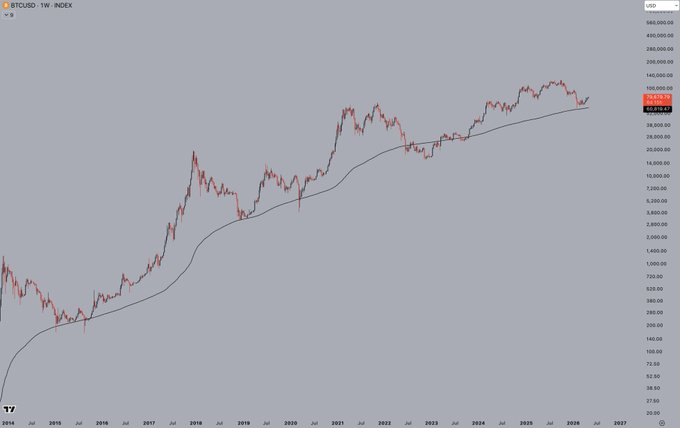
Jelle argued that previous bear markets often bottomed below the 200-week exponential moving average. He noted that recent price behavior challenged that pattern, implying structural shifts in cycle duration. This interpretation suggested shorter correction phases and faster recovery cycles.
Bitcoin Price Structure Reflected Changing Market Dynamics
Market structure evolved as institutional flows influenced liquidity distribution across exchanges and derivatives platforms. ETF inflows provided a consistent demand source, reducing reliance on retail-driven rallies. This shift changed how price trends developed over time.
Futures market activity also contributed to directional bias as traders responded to gap formations and funding conditions.
These factors combined to create a more structured recovery pattern rather than a sharp rebound. The trend reflected measured accumulation rather than speculative spikes.
This environment supported gradual price appreciation while maintaining controlled volatility levels. It also indicated that the market remained sensitive to macro-driven catalysts, particularly U.S. trading sessions and institutional allocation flows.
Bitcoin price needed to break above $79K to confirm the next phase toward the $86K–$88K range, van de Poppe said. Traders continued to monitor CME gap interactions and ETF flow data for confirmation signals.
The post Bitcoin Price Eyes $88K Mark As ETF Flows Drive Momentum appeared first on The Market Periodical.