


Bitcoin remains trapped in a broader corrective structure, but the price action is starting to stabilize after defending the $60,000 demand region. The daily chart still leans cautiously as BTC trades below the major moving averages and beneath the descending resistance trendline.
That leaves the cryptocurrency at an important crossroads, where a push higher could extend the recovery toward overhead supply, while failure would keep the broader downtrend intact.
Bitcoin Price Analysis: The Daily Chart
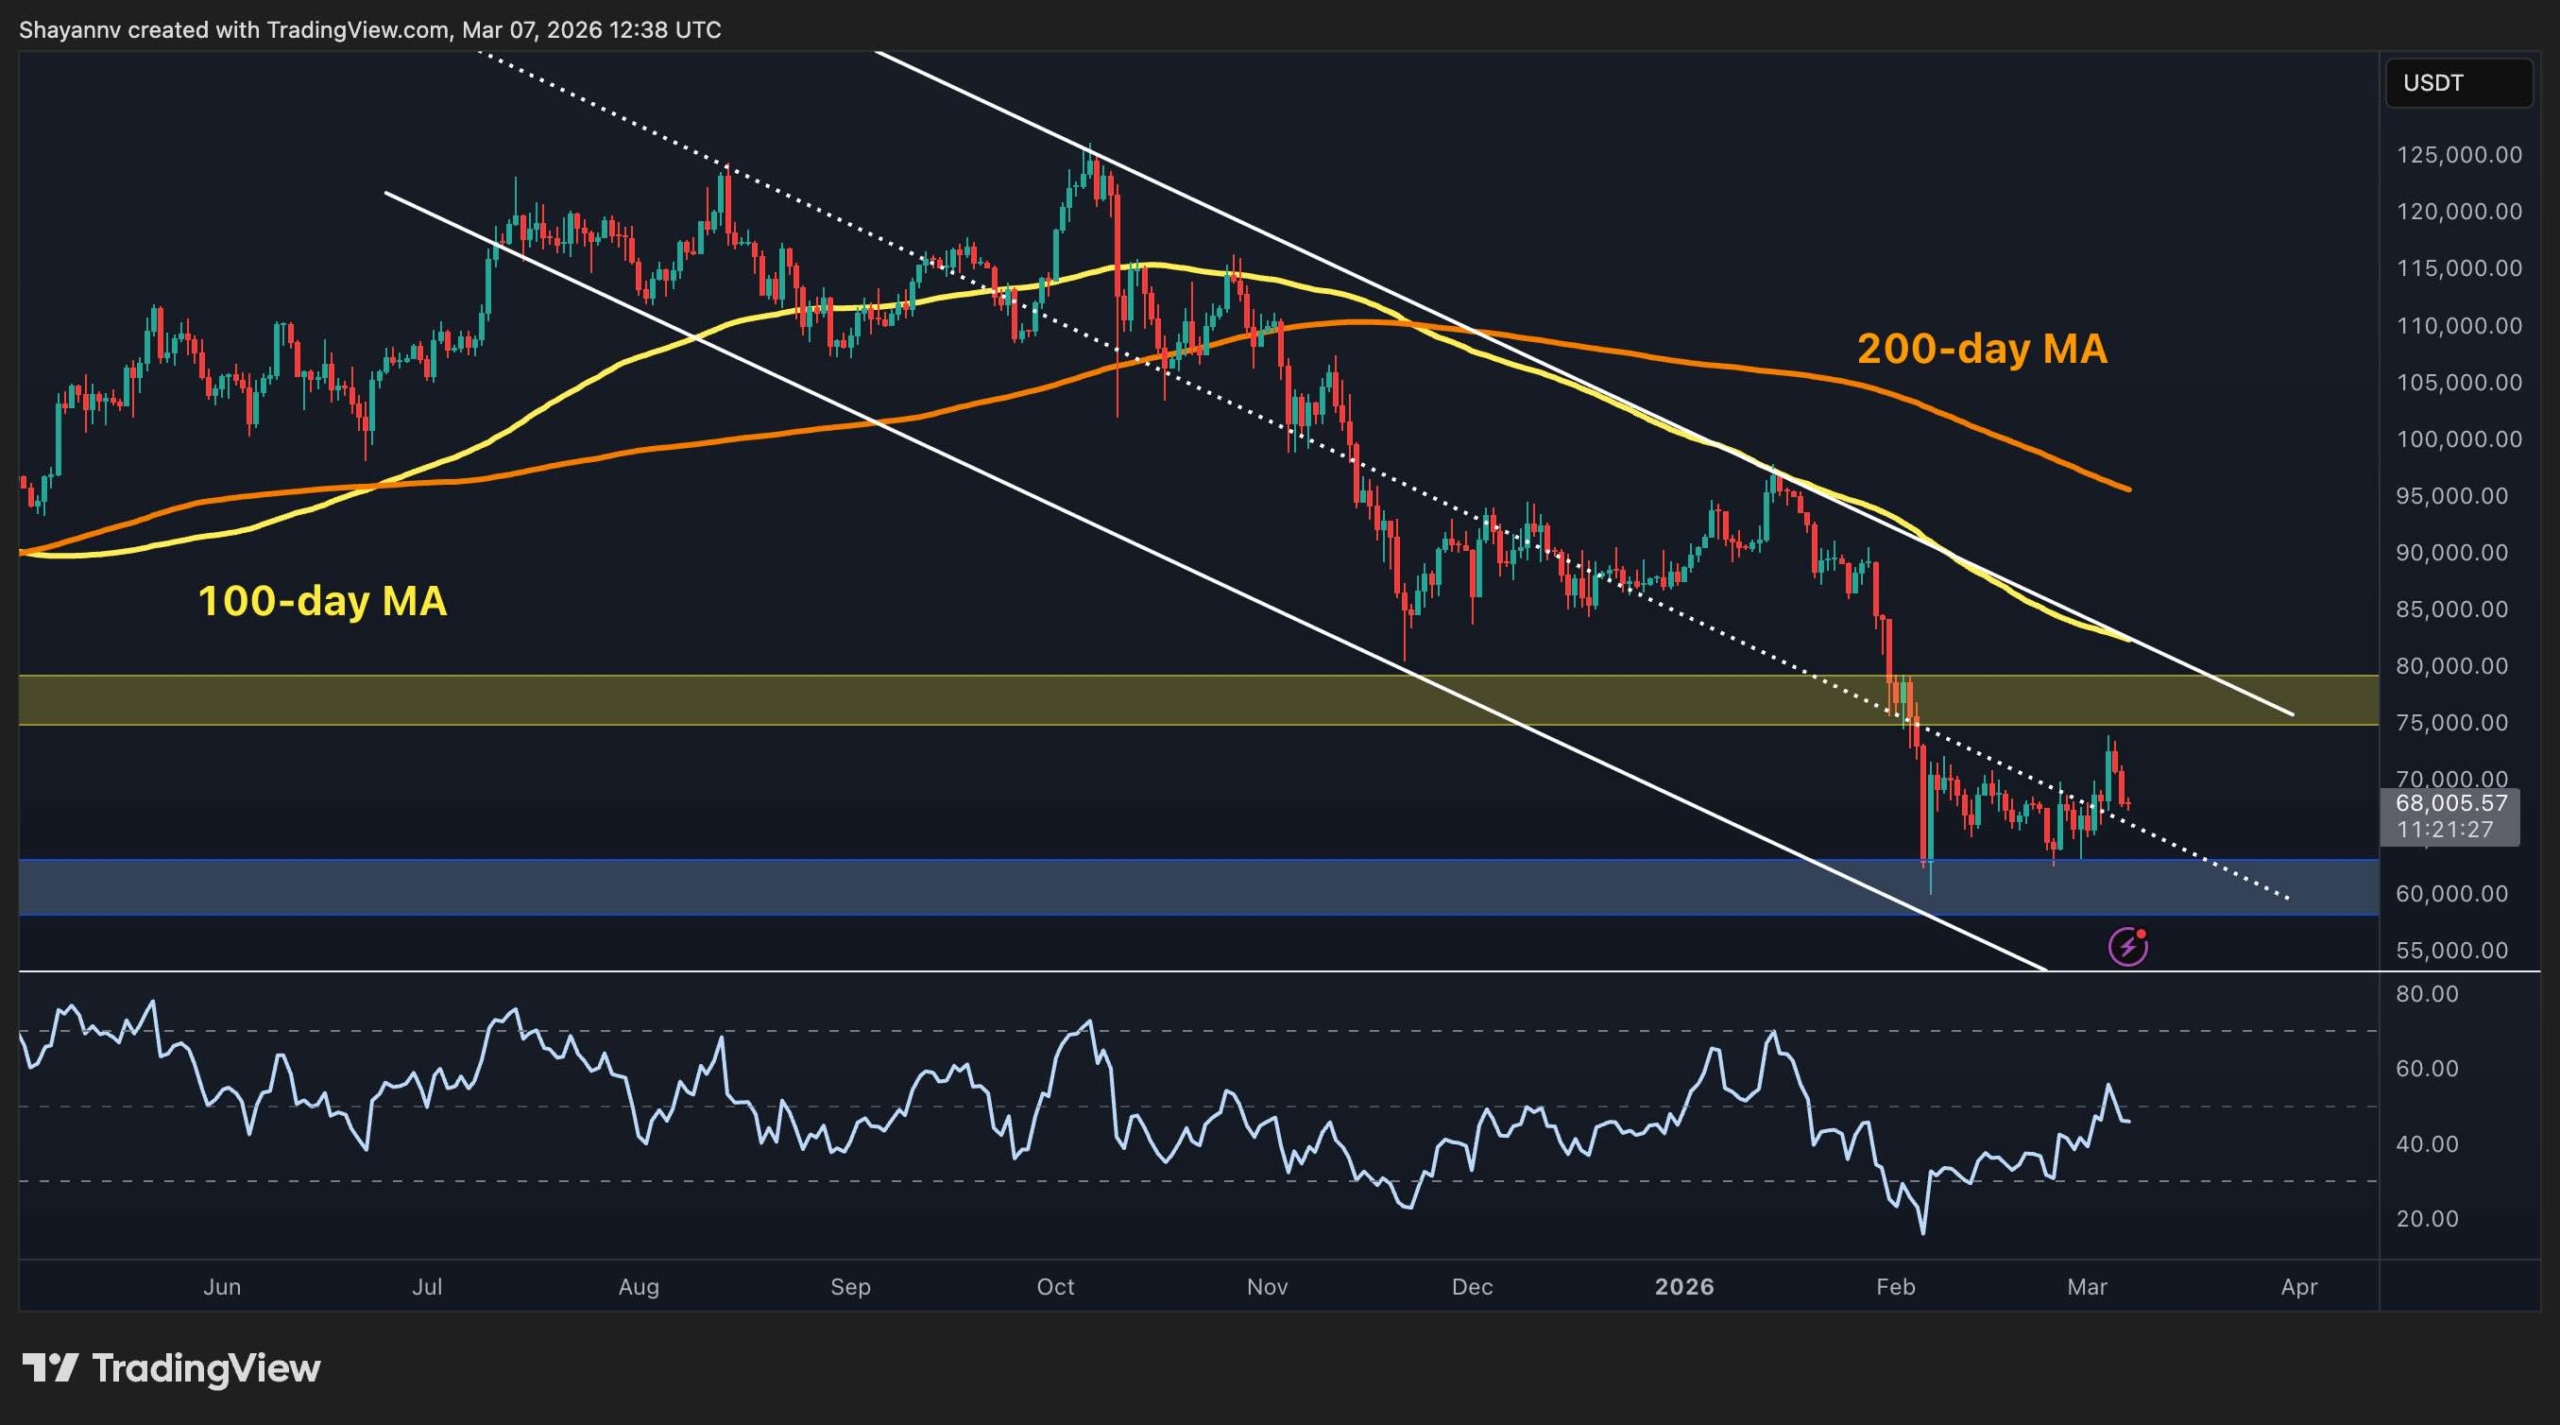
On the daily timeframe, Bitcoin is still trading inside a well-defined bearish structure, with the price capped below both the 100-day and 200-day moving averages. The 100-day MA is now trending lower near the mid $80,000 region, while the 200-day MA sits even higher around the mid $90,000s, showing that the broader trend remains under pressure.
In addition, BTC is still moving beneath the descending trendline that has guided the correction for months, which means the buyers have not yet delivered a convincing structural reversal.
That said, the reaction from the blue support zone around $60,000 was technically important. Buyers stepped in aggressively after the sharp flush below $60,000, and BTC has since rebounded toward the $68,000 area. The first major resistance remains around $76,000 to $80,000, where previous horizontal support turned into supply. As long as Bitcoin stays below that region, rebounds are likely to be viewed as corrective.
BTC/USDT 4-Hour Chart
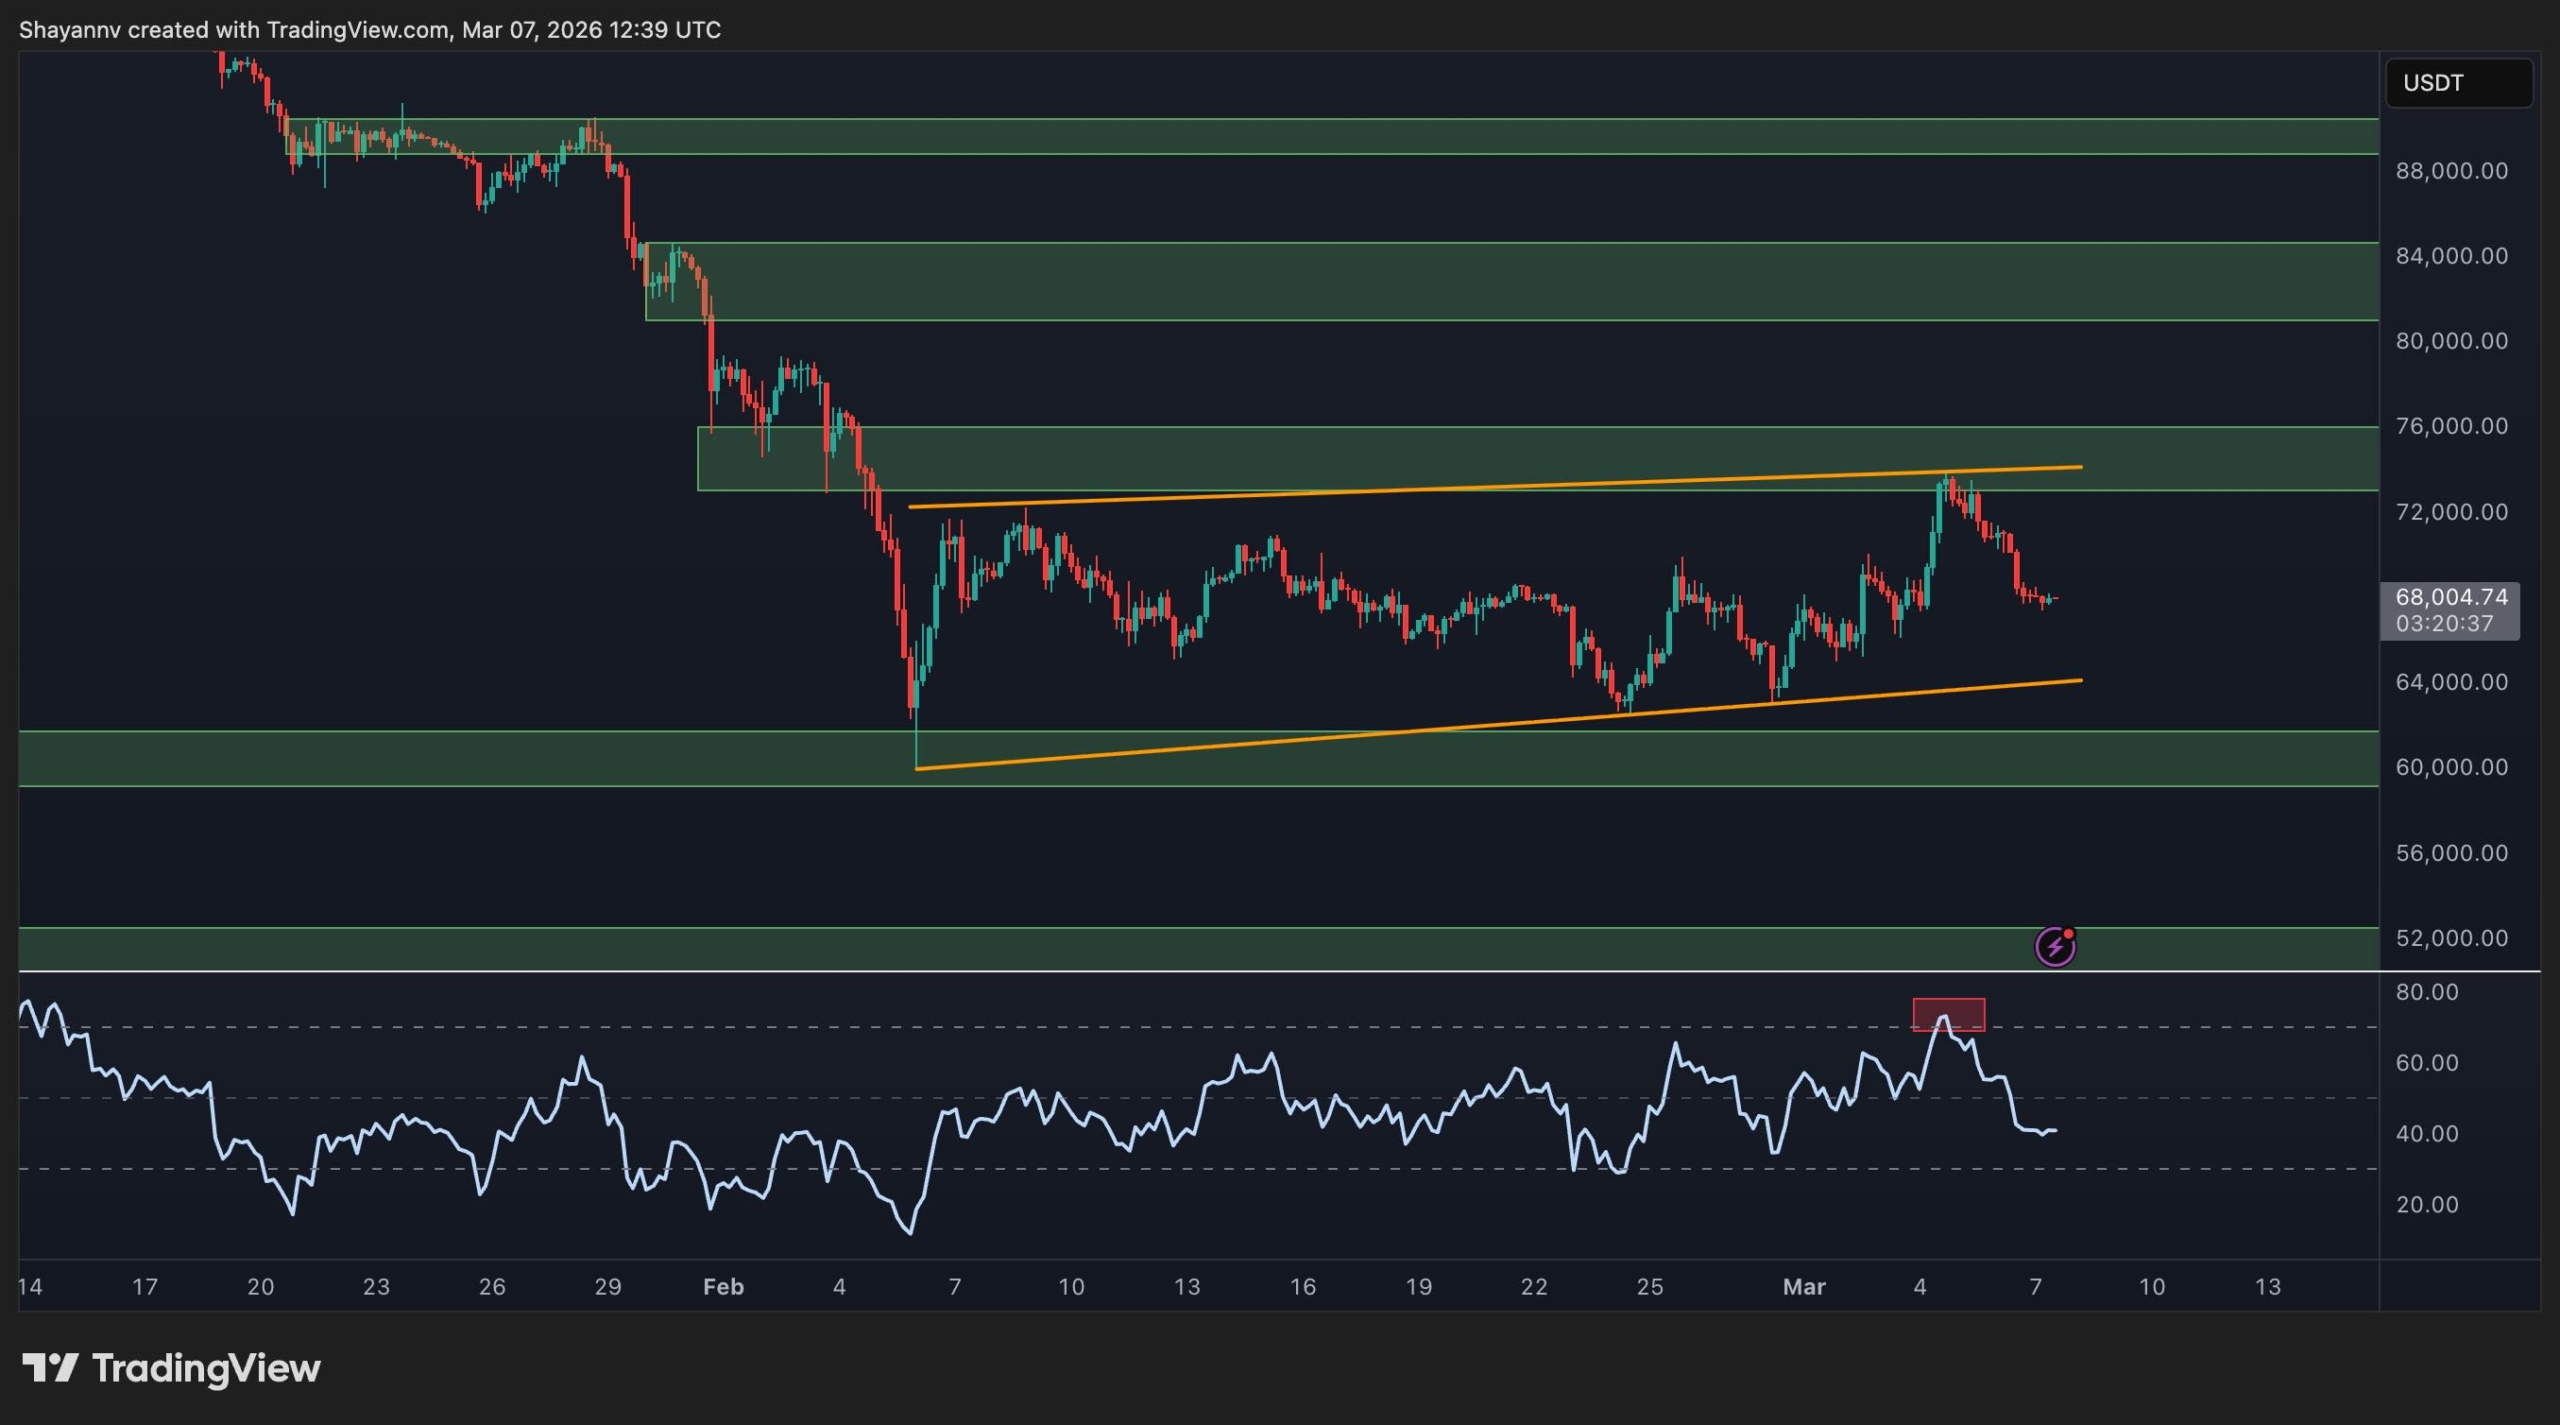
On the 4-hour chart, Bitcoin is consolidating inside a rising channel, suggesting that the recent move off the lows is more of a recovery phase than a full bullish reversal. The asset is currently hovering around $68,000 after rejecting from the upper boundary of the channel near the $72,000 to $75,000 resistance area. This rejection confirms that sellers are still active on rallies, especially when BTC approaches confluence resistance, where the channel top overlaps with horizontal supply.
Momentum has also cooled noticeably. The RSI pushed into overbought territory during the recent rally, but has since rolled over and dropped back toward neutral, showing fading upside strength in the short term.
For buyers, holding above the mid-channel area and continuing to defend the $64,000 to $65,000 region would keep the structure constructive for another attempt higher. On the downside, a breakdown below the lower boundary of the channel could send Bitcoin back toward the $60,000 support zone and potentially even lower.
On-Chain Analysis
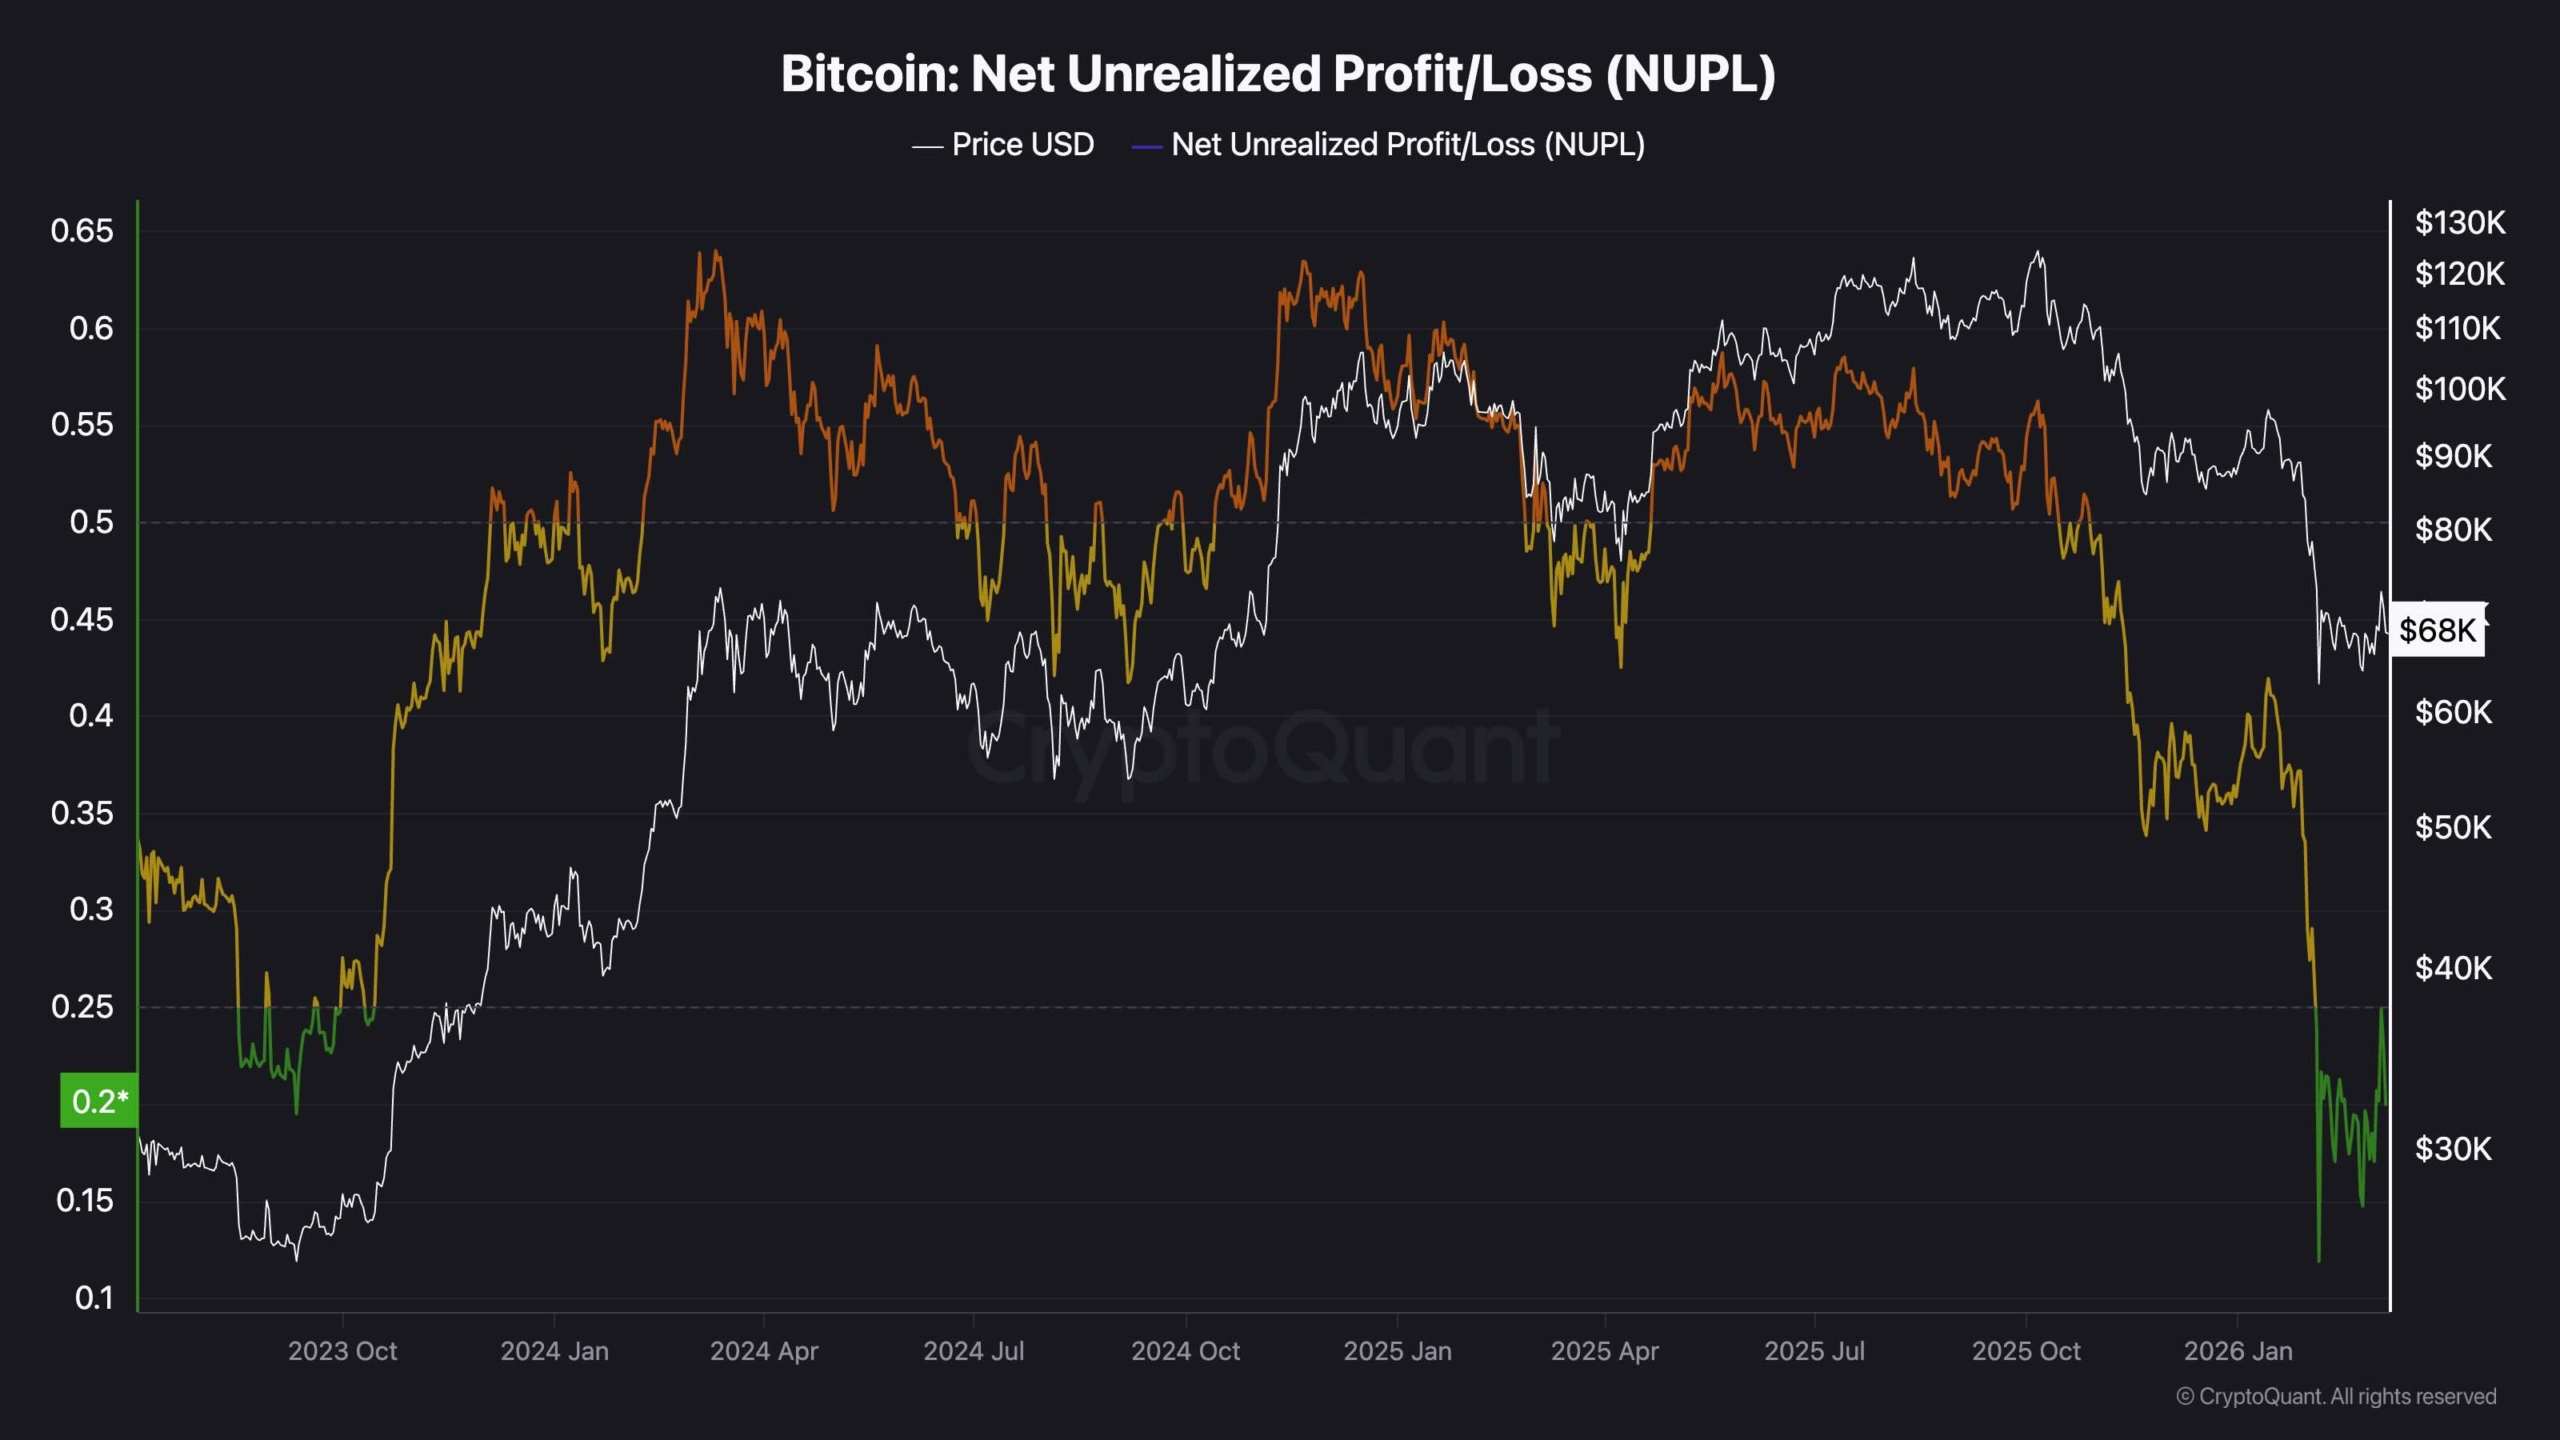
From an on-chain perspective, Bitcoin’s Net Unrealized Profit and Loss, or NUPL, has fallen sharply and is now sitting around 0.20. That is a major reset compared to the euphoric readings seen during the rally toward the cycle highs.
In simple terms, the market has flushed out a large portion of paper profits, which usually reflects a substantial reduction in speculative excess. While this does not guarantee an immediate trend reversal, it often creates a healthier backdrop than the overheated conditions seen near major tops.
Historically, a NUPL reading around this zone points to a market that is no longer in euphoria and is instead moving closer to the kind of sentiment reset that can support medium term base building. That fits well with the current price structure, where Bitcoin is trying to stabilize after a heavy correction rather than accelerate into a fresh expansion leg.
So, on-chain data suggests downside risk may be more limited than it was near the highs, but for a stronger bullish case, that improving on-chain backdrop still needs confirmation from price through a reclaim of higher resistance levels on both the daily and 4-hour charts.
The post Bitcoin Price Analysis: BTC Must Break This Key Level to Confirm a Real Rally appeared first on CryptoPotato.