


Original author: Claude, Shenchao TechFlow
Deep潮 Summary: The Bull-Bear Market Cycle Indicator from CryptoQuant has turned positive for the first time since October 2025, while another key indicator, the Bull Score Index, rose to the neutral zone of 50 in late April. Bitcoin has posted three consecutive months of monthly gains, rebounding from its February low of approximately $60,000 to above $81,000. However, the precedent of 2022 serves as a caution: similar signals previously turned invalid a week later, followed by a further sharp price decline.
On-chain data for Bitcoin is sending a long-awaited positive signal.
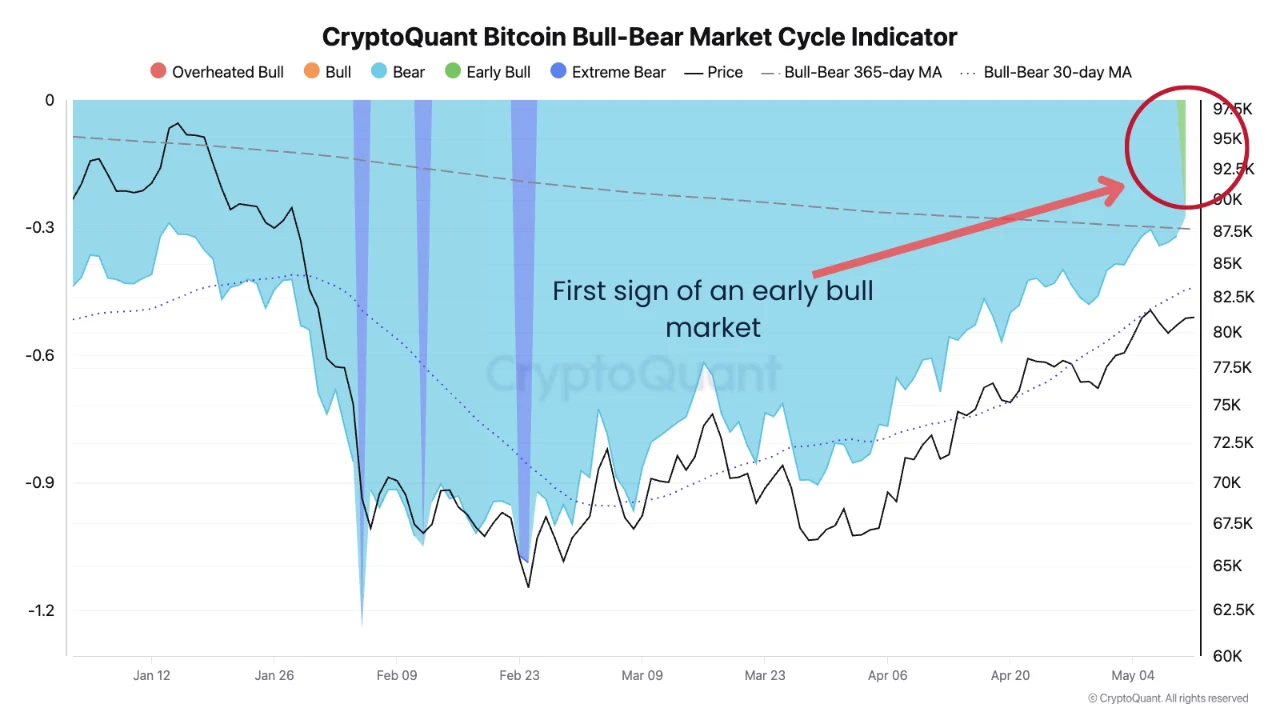
According to data from the CryptoQuant platform, the platform’s Bull-Bear Market Cycle Indicator has recently returned to positive territory for the first time since the P&L index fell below its 365-day moving average in October 2025.
This metric assesses whether Bitcoin is currently in a bull or bear market cycle by measuring the distance between the P&L index and its 365-day moving average. The P&L index itself combines three core on-chain indicators—MVRV ratio, NUPL, and long/short-term holder SOPR—serving as CryptoQuant’s unified valuation tool for determining whether Bitcoin’s price is overvalued or undervalued.
As of press time, Bitcoin is trading at approximately $81,000, rebounding more than 35% from its cycle low of around $60,000 in early February.
Source: CryptoQuant, original post by analyst MorenoDV_
It took seven months for on-chain recovery from deep bear to first reversal.
Reviewing the on-chain trajectory of this bear market: After Bitcoin plunged from its all-time high of $126,000 in October 2025, the bull-bear cycle indicator quickly fell into negative territory. According to Cryptonomist in February this year, the indicator dropped to approximately -1.2 in early February, comparable to the low seen during the March 2020 COVID crash. CryptBull’s reporting during the same period confirmed that the indicator had reached its lowest level since the bottom of the FTX collapse in 2022.
The recovery from the deep bear market low in February to recent positive territory took approximately three months. This pace is faster than the 2022 cycle, during which the indicator remained in negative territory for about 12 months. However, given that this cycle saw a decline of approximately 55% from its peak of $126,000 to below $60,000, the sustainability of this recovery remains debated.
The Bull Score Index has risen synchronously to neutral, with multiple indicators converging.
The reversal of the bull-bear cycle indicator is not an isolated event.
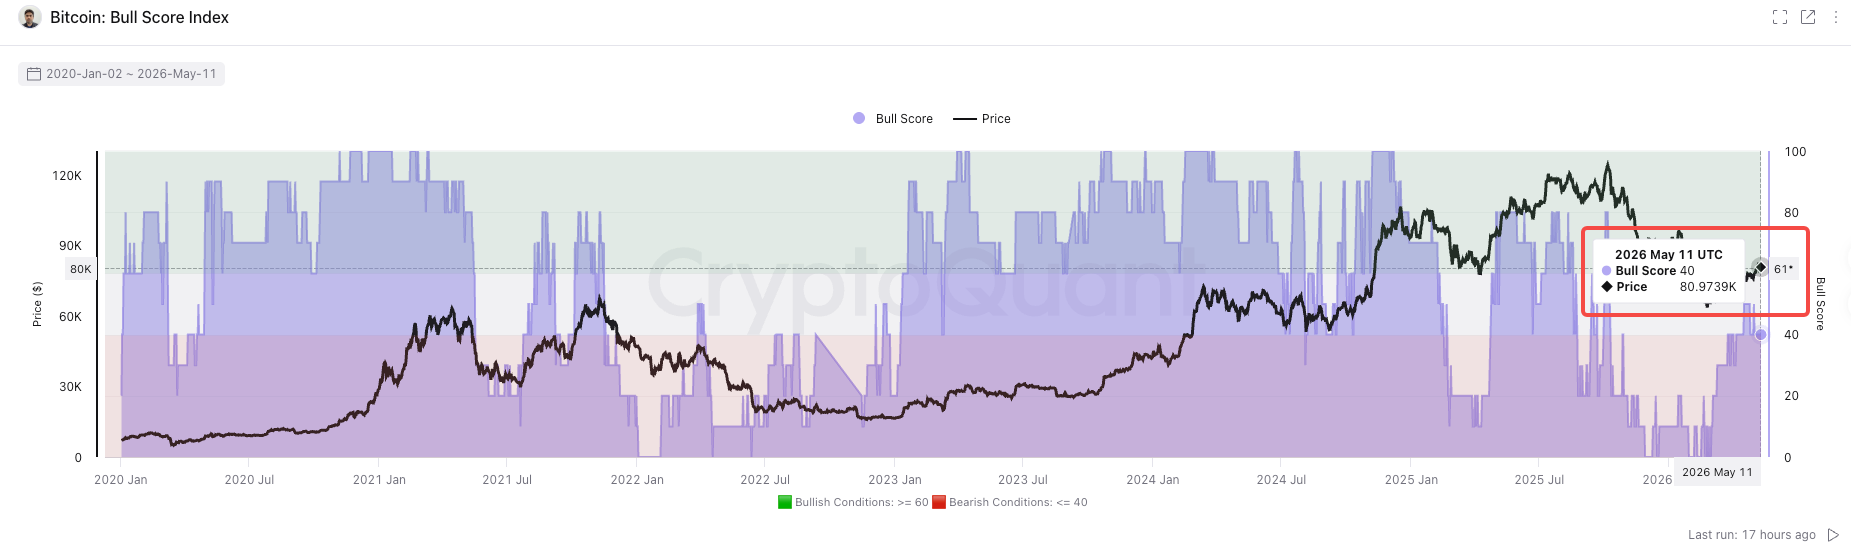
According to CoinDesk on April 23, CryptoQuant’s other key metric, the Bull Score Index, rose to a neutral reading of 50, the first time since Bitcoin began its decline from its high of $126,000.
The Bull Score Index combines 10 key metrics covering dimensions such as blockchain activity, investor profitability, and liquidity. A reading below 40 typically indicates a structural bear market, while a reading above 60 suggests a strong, sustainable upward trend.
Julio Moreno, Research Director at CryptoQuant, commented that this is the first time the Bull Score Index has entered the neutral zone during this bear market. However, he also noted a precedent from March 2022: at that time, the index similarly rose briefly to 50 but remained there for only about a week before prices continued to decline sharply.
Improvements at the price level are equally evident. Bitcoin closed up approximately 2% in March, 12% in April, and has gained about 6% so far in May, marking three consecutive months of positive returns.
The 2022 "false signal" as a cautionary tale: history may not repeat, but the market remembers
The market's greatest concern regarding the current positive signals stems from historical lessons in 2022.
In March of that year, the Bull Score Index briefly rose into the neutral zone at 50, after which Bitcoin fell from around $47,000 to $16,000. The Bull-Bear Cycle Indicator also briefly turned positive in 2022, but continued its sharp decline following the consecutive collapses of Luna/UST and FTX.
However, this cycle differs structurally from 2022. Since their launch in January 2024, spot Bitcoin ETFs have become a significant anchor for institutional demand. According to SpotterCrypto, net inflows into spot Bitcoin ETFs reached $2.44 billion in April, the strongest month since October 2025. Glassnode data shows that the number of whale addresses holding over 1,000 BTC increased by 142 over the past six months. Additionally, Glassnode’s RHODL Ratio is currently at 4.5, the third-highest reading in Bitcoin’s history, with the two previous similar peaks occurring at the bottom of the 2015 and 2022 cycles, both of which were followed by sustained bull markets.
Matt Weller, Head of Global Research at StoneX, provided a more cautious frame of reference in the Q2 outlook.
Based on Bitcoin’s four-year halving cycle, the prolonged bottom of this cycle may not occur until around the fourth quarter of 2026. If historical patterns hold, the decline from peak to bottom is approximately 60%, corresponding to a price of around $50,000.
For traders, the true meaning of the current signal may be:
The most panicked phase may already be behind us, but it’s still too early to declare the start of a new bull market. Bitcoin needs to break above and sustain the 200-day moving average resistance at $82,000 to provide a more convincing technical confirmation of a trend reversal.