


Following yesterday’s Axios exclusive report that “both sides are close to reaching an agreement,” markets briefly basked in optimism, with the S&P 500 hitting a new all-time high and the Nasdaq simultaneously setting a new record. On Wednesday, the S&P 500 surged 1.46% to 7,365.12, while the Nasdaq jumped 2.02% to 25,838.94, both reaching record closing highs.
This positive sentiment didn't last 24 hours.
On Wednesday, a spokesperson for Iran’s Ministry of Foreign Affairs stated that Washington’s peace proposal “is still under review,” with the core demands—suspending uranium enrichment and reopening the Strait of Hormuz—remaining unresolved. Iran’s red line on uranium retention remains unchanged. The bullish sentiment accumulated the previous day was quickly erased by this news, causing a reversal in risk sentiment. All three major U.S. stock indices closed lower, with the semiconductor sector leading the decline and small-cap stocks facing the heaviest pressure.
Core narrative: A peace agreement is still far off
The market's interpretation of this conflict has become highly binary: either a deal is reached, or the fighting continues.
The diplomatic pace this week created significant volatility. On Monday, Trump announced a pause in the "Project Freedom" escort mission, and intermediaries from Pakistan released positive signals. On Tuesday, Saudi media even predicted that transit rights through the Strait of Hormuz could see a breakthrough "within hours," prompting oil prices to plunge; U.S. crude fell more than 5% intraday, while Brent dropped below $97.
However, Iran quickly cooled the situation. The Iranian Foreign Ministry explicitly stated that uranium enrichment is a red line, not a negotiating chip. Simultaneously, the Islamic Revolutionary Guard Corps announced the establishment of a new "control system" over the Strait of Hormuz, suggesting that even if passage is reopened in the future, it will be selectively permitted under Iranian control, not restored unconditionally.
Meanwhile, the U.S. Department of the Treasury announced additional sanctions against Iran’s related oil network, and U.S. forces reportedly used force against an Iranian tanker violating the blockade in the strait, demonstrating that the U.S. government is maintaining simultaneous economic pressure and military deterrence with no signs of easing.
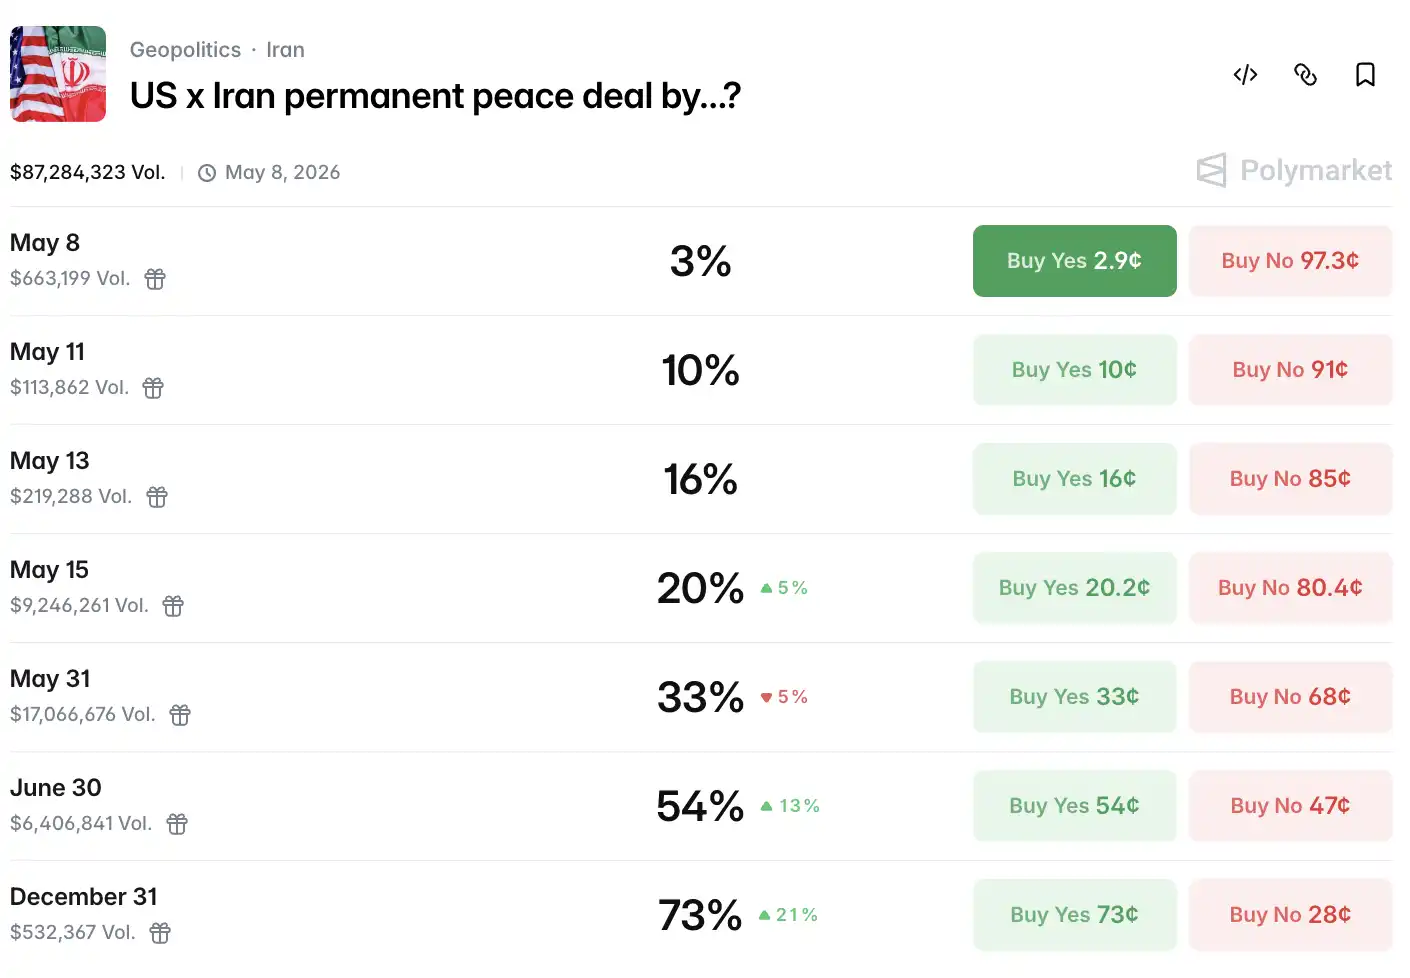
Polymarket data shows that the probability of a peace agreement being reached before May 15 has dropped to 15%, down from 20% at the time of writing.
As a result, oil prices formed a sharp V-shape.
During the session, Brent futures briefly dropped to $96.73, a decline of over 12%. After peace talks sentiment deteriorated, long positions re-entered the market, and Brent closed near $100 at the close, while WTI closed near $90.5, both barely holding onto key psychological levels.
Notably, spot Brent has fallen below the nearest-month Brent futures, signaling a reversal of the contango structure and suggesting that physical crude oil supplies are currently abundant, creating a structural divergence from the geopolitical risks priced into the futures market.
Beyond the strait, U.S. crude oil exports reached a record high last week, as global buyers accelerate their shift toward U.S. supply sources to avoid Middle East transportation risks.
Aldo Spanjer, Head of Energy Strategy at BNP Paribas, has outright abandoned trading in the energy markets: “The outcomes are too binary—headline news alone is triggering stop-losses; this has happened five times this week, making trading nearly impossible.” Scott Shelton, Energy Analyst at TP ICAP, described the current environment as a “risk desert,” with only hedgers remaining in the market.
Can Bitcoin hold the $80,000 level?
Now let’s look at Bitcoin, the asset most concerning to crypto enthusiasts.
Amid this context, Bitcoin continued to face pressure, with its spot price falling approximately 1.56% on the day and finding support near $80,000.
Unlike previous rounds of panic selling, this correction has a relatively healthy structure. On-chain data shows that the proportion of long-term holders has risen to 78.3% of the circulating supply, exchange balances have continuously declined to a seven-year low, and whale addresses net purchased approximately 270,000 BTC over the past 30 days. BlackRock’s Bitcoin ETF holdings have increased to approximately $62 billion, with institutional positioning becoming more stable.
On the Ethereum front, overall sentiment this week benefited from rising market expectations regarding the implementation of U.S. cryptocurrency regulatory legislation. ETH rose approximately 5.6% over five days, trading in a range of $2,360–$2,412, with a market capitalization maintained at around $233 billion.
Notably, April of this year saw the strongest net inflows for U.S. spot Bitcoin ETFs since October 2025, with net inflows reaching $2.44 billion. Institutional channels continue to remain open, aligning intrinsically with Bitcoin’s relative resilience amid macroeconomic volatility.
From a narrative perspective, the impact of the Middle East situation on the crypto market is undergoing structural differentiation. Rising oil prices and elevated inflation expectations have increased the probability of Fed rate hikes, putting downward pressure on Bitcoin. At the same time, capital from certain Middle Eastern regions is accelerating the transfer of assets to decentralized channels to circumvent potential sanctions and liquidity constraints within the banking system. On the same day that U.S. Treasury sanctions were imposed on Iran-related oil networks, on-chain data showed a slight anomaly in anonymous mixing transaction volumes. This is not a conclusion, but rather a signal worth continued monitoring.
On the regulatory front, market sentiment is also supported by expectations for the implementation of U.S. regulatory frameworks. Legislation on stablecoins and digital asset market structure introduced in both the U.S. Senate and House of Representatives is currently advancing; if enacted this year, it would provide a compliant foundation for institutions to further expand their allocations.
U.S. stocks fluctuated at high levels, with semiconductors experiencing a catch-up decline.
Thursday was the second day this week with unclear direction.
The S&P 500 fell 0.38% to close at 7,337.11; the Dow Jones dropped 313.62 points (-0.63%) to 49,596.97; the Nasdaq Composite posted a relatively modest decline of 0.13%, closing at 25,806.20. The Russell 2000 small-cap index slid 1.63%, posting the largest decline among major indices today.
All sectors closed lower, with the energy sector posting the largest decline, while consumer staples showed relative resilience.
There was significant divergence within the tech sector. Tesla rose 3.28%, NVIDIA increased 1.76%, Microsoft gained 1.68%, and Meta climbed 0.64%; Apple dipped 0.03%, Alphabet fell 0.01%, and Amazon declined 1.39%. The Seven Giants Composite Index edged up 0.69% overall, one of the few bright spots of the day.
Semiconductors were hit hardest. The Philadelphia Semiconductor Index closed down 2.72%, AMD fell 3.07%, and TSMC’s ADR dropped 1.28%. While Qualcomm and Fortinet reported better-than-expected earnings, and Datadog’s analyst day provided some support for the software sector—potentially marking the fourth consecutive weekly gain for the software index—the rally in software cannot mask the systemic selling in the chip sector.
Goldman Sachs trading desk data provides a more striking perspective: the daily high-beta momentum portfolio fell by as much as 8%, while both the S&P 500 and Nasdaq 100 declined by less than 0.5%. This divergence ranks among the top ten most extreme single-day gaps over the past five years, and has already occurred five times in 2026 to date.
Additionally, the VIX fell 1.78% to 17.08, exhibiting a rare divergence from the decline in U.S. stocks. Typically, when stocks fall, the fear index rises; however, both are moving downward together, suggesting that markets may be awaiting Friday’s upcoming non-farm payroll data and are reluctant to take directional positions in the short term.
Recent earnings reports from U.S. stocks are also highly representative. Arm Holdings released its FY2026 Q4 earnings after the market closed on May 6, slightly surpassing analyst expectations with an adjusted EPS of $0.60 and revenue of $1.49 billion. Licensing revenue increased by 29% year-over-year, and royalty revenue rose by 11%.
The financial report itself was not poor. However, during the earnings call, management mentioned that the company's latest AGI CPU data center chip is facing supply constraints, preventing an additional $1 billion in demand from being converted into revenue. Raymond James analyst Simon Leopold directly wrote: “Supply constraints have led management to temper its revenue guidance.”
The stock surged as much as 13% after hours, then fully retraced those gains, dropping over 10% after opening on Thursday and becoming one of the biggest losers among tech stocks that day. This marks the third time in the past year that Arm has seen a “beat-and-raise” earnings report followed by a sharp decline the next day.
After hours, following Arm’s performance, CoreWeave took the stage. Q1 actual revenue exceeded expectations, with backlog swelling to $99 billion, and NVIDIA injected another $2 billion during the quarter. However, Q2 revenue guidance fell below market expectations, while full-year 2026 capital spending was raised to $31–35 billion—more than double the $14.9 billion spent in 2025—causing the stock to drop more than 10% in after-hours trading.
CoreWeave's losses are real, its debt is real, but so are its orders: $99 billion in pre-orders and continuous backing from NVIDIA. Yet many are skeptical whether these future revenues can outpace today's capital expenditures.
The Fed is hawkish; Friday's non-farm payrolls data
Finally, regarding the Fed, the short-term interest rate market showed a slight hawkish shift, with the probability of an unexpected rate hike before year-end rising to around 20%. However, the market largely viewed this as noise, as labor data remained strong, with initial jobless claims for the week only marginally rebounding to 200,000, indicating the labor market is far from showing any significant cracks.
The 10-year U.S. Treasury yield rose approximately 4.8 basis points to 4.393%, moving higher in tandem with the rebound in oil prices.
The offshore renminbi rose above 6.80 during trading, hitting a four-year high, before slightly retracing to close at 6.8078 in New York. The U.S. dollar index ended up 0.08% at 98.10.
In the gold market, spot gold touched a two-week high above $4,700 during trading, closing up 0.22% at $4,701.61 per ounce, as inflation concerns driven by oil prices and safe-haven demand amid peace negotiation expectations created a tug-of-war, allowing gold to find its footing. Silver posted even stronger gains, with COMEX silver futures closing up 3.02% at $79.64 per ounce, while spot silver surged above $82 during intraday trading.
In European markets, the STOXX Europe 600 fell 1.02%, the UK FTSE 100 dropped 1.55%, France’s CAC 40 declined 1.17%, and Germany’s DAX slipped 0.99%.
The variables in Hormuz have not yet been cleared. The next market trigger point is Friday’s non-farm payrolls data. Initial jobless claims this week rose slightly to 200,000, but remained below the market expectation of 206,000, indicating continued mild pressure on labor market layoffs. With the probability of a Fed rate hike this year rising to approximately 20%, this means the non-farm payrolls data will serve as the next benchmark for repricing.
Source:律动 BlockBeats