


Bitcoin (BTC) has flashed a major sell signal, as of March 19, after getting trapped in a slow decline in the past three days to trade at about $70,134 at press time.
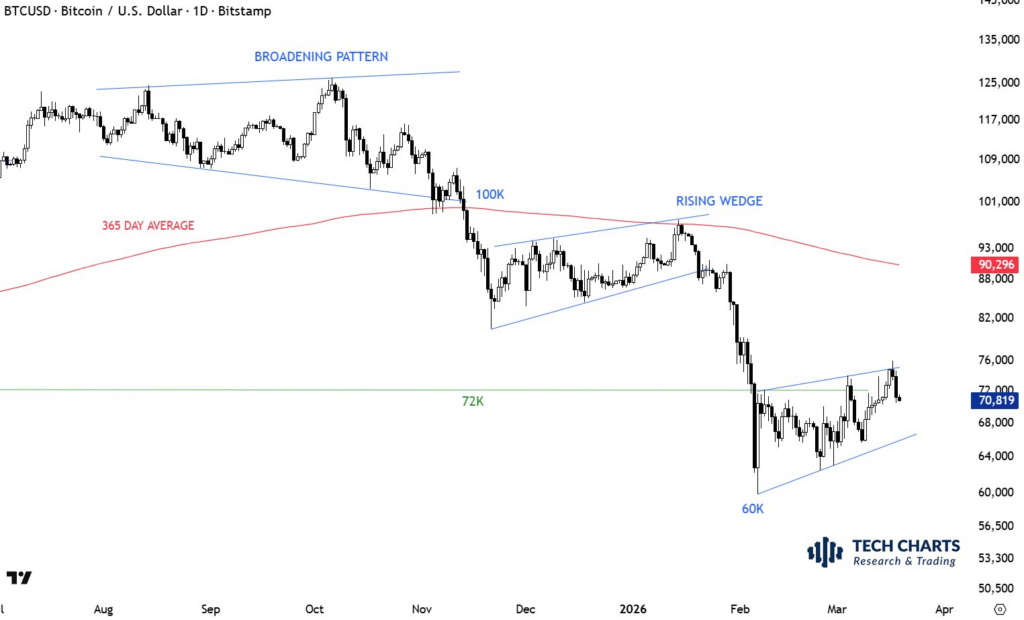
The flagship coin could be on the cusp of another selloff to $52,500, despite the recent notable renewed interest from institutional investors, as Finbold analyzed. From a technical analysis standpoint, BTC price could be forming a bearish pattern with a target of $52,500, characterized by its multi-week rising wedge pattern, according to insights from Aksel Kibar, an ex-fund manager.
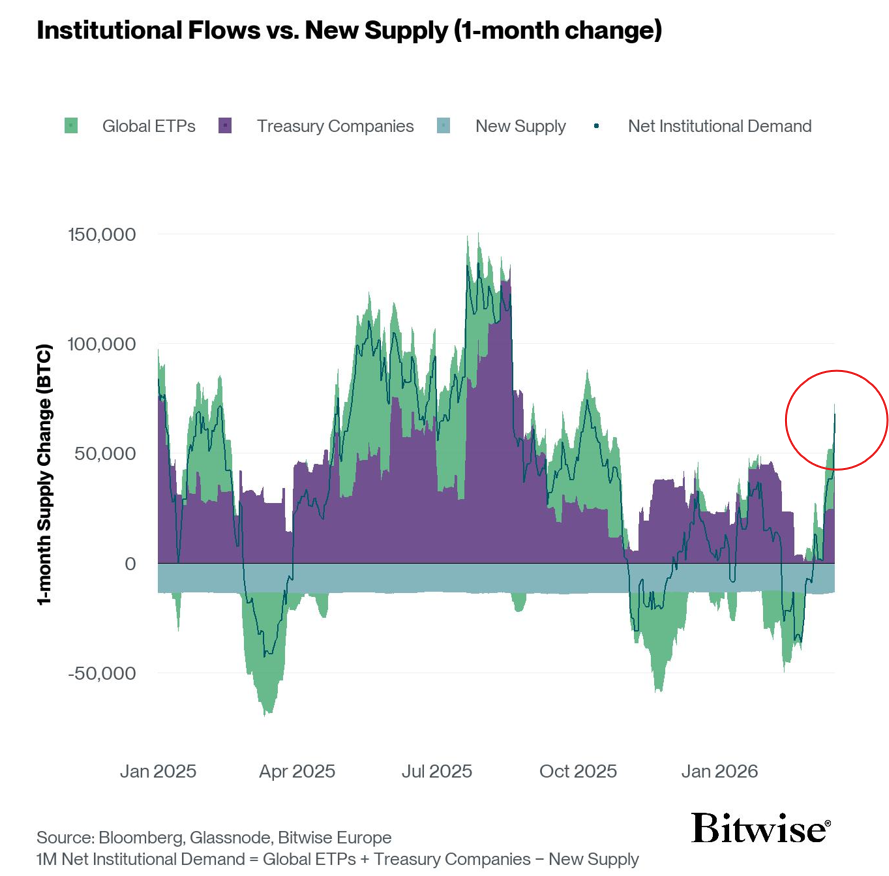
The midterm bearish outlook for Bitcoin is vivid amid record demand from institutional investors, led by Strategy Inc., year-to-date.
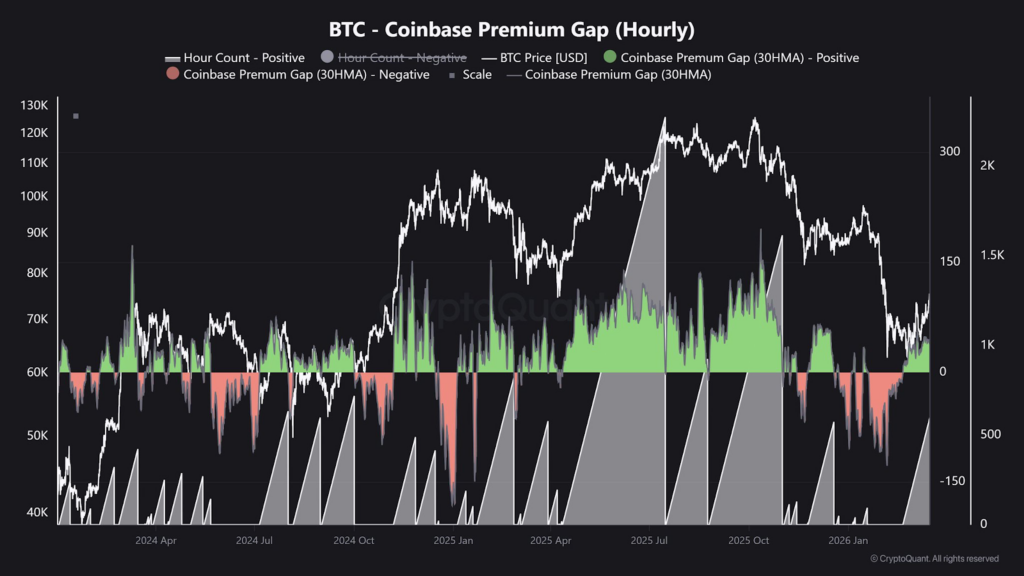
The notable institutional demand for BTC was led by investors from the United States, as revealed by the analysis from CryptoQuant. Notably, the Coinbase premium gap has been positive in the past few weeks, indicating consecutive demand from U.S. investors.
Bitcoin long-squeeze incoming
Although institutional investors are aggressively accumulating at the current Bitcoin price range, technical analysis hints at a potential long squeeze. The significant accumulation of Bitcoin via spot investors could be a bull trap in the leveraged markets.
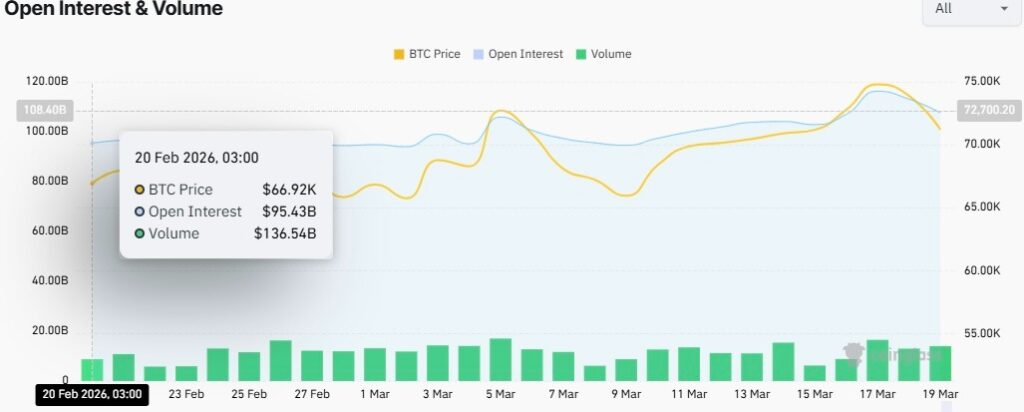
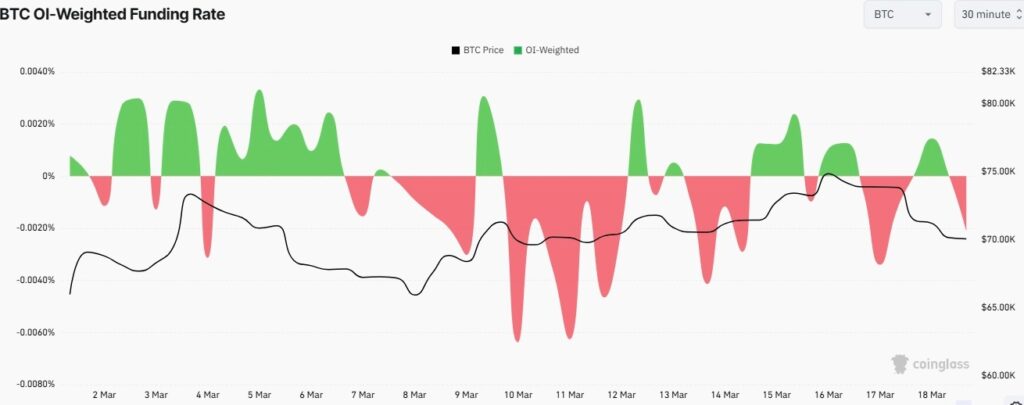
During the past four weeks, Bitcoin’s Open Interest (OI), the total number of outstanding futures or options contracts in the market, has surged by more than $12.9 billion to hover around $108.4 billion at press time, based on metrics from CoinGlass.
Meanwhile, the BTC’s funding rate, a fee set by crypto exchanges to maintain a balance between the perpetual contract price and the underlying asset price, flipped back to negative on Thursday, thereby reaffirming potential capitulation ahead.
What’s the bigger picture for BTC price?
The recent multi-week consolidation for BTC price is predicted to end similarly to its 2022 bear bottom, as analyzed by FrankAFetter.
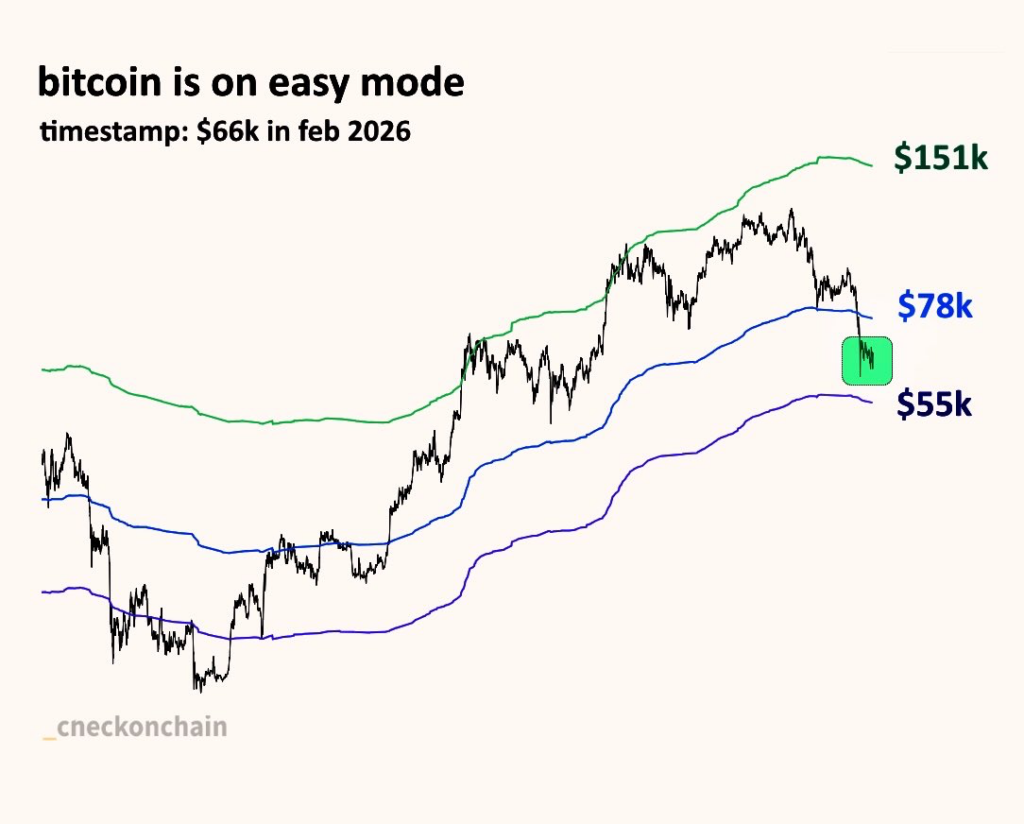
This analyst argued that BTC price is almost at its bear market bottom, but cautioned that it might drop to the lower end of this band below $55k before rebounding towards $151k due to the mean-reversion impacts.