


Last week, market movements largely aligned with expectations—Bitcoin remained weakly range-bound near the lower boundary of its uptrend channel, with the bearish trend still dominating; HYPE confirmed support in the $36–$38 range and continued its independent upward momentum.
This week's report will build on this foundation by further breaking down the current price structure, updating market forecasts and trading plans, and fully reviewing last week's trade execution.
This week's key trading insights summary:
• HYPE this week's market outlook and short-term trading strategy. (See Part 1 for details)
• In-depth analysis of HYPE's current price structure (hourly timeframe). (See Part 2 for details.)
• BTC this week's market outlook and short- to medium-term trading strategy. (See Part 3 for details.)
• Review of BTC operations. (See Part 4 for details.)
Last week's core viewpoint market validation:
• HYPE Short-Term Trading Performance: HYPE executed a short-term long position (1x leverage) last week, achieving a profit of approximately 5.25%. (See Table 1 for details)
• BTC Short-Term Trading Performance: Bitcoin executed a short trade (1x leverage) last week, achieving a profit of approximately 6.17%. (See Table 2 for details)
• Medium-term BTC trading performance validation: Last week, Bitcoin followed the established medium-term strategy, maintaining a short position opened at $89,000 (1x leverage). By the close of last week (approximately $66,962), the position yielded a profit of approximately 24.76%, with a peak profit of about 32.58% during the period.
• BTC Price Trend Forecast Verified by Market Action: In last week’s article, we clearly stated that the market would remain in a range-bound consolidation phase, with bullish and bearish forces competing near the lower boundary of the channel (formed from the low on February 6). The current market movement confirms our earlier forecast.

I. HYPE: Market Outlook and Short-Term Trading Strategy
1. HYPE This Week’s Price Outlook: We believe the current market structure remains in an uptrend on the daily timeframe, and the price is currently in a pullback confirmation phase following the breakout above Wave I’s peak (the February 3 high of $38.41). This week, focus on the validity of support in the $36–$38 range. If the pullback is confirmed, the uptrend is likely to continue.
2. HYPE This Week's Short-Term Trading Strategy:
• Based on the anticipation of an upward structure, follow the principle of “going with the trend and buying on dips.”
• Use a 30-minute/60-minute time frame as the trading cycle and strictly adhere to stop-loss discipline; allocate 30% of your position and identify spread opportunities based on support and resistance levels.
3. Risk Warning for HYPE Surge: Although HYPE's price movement is relatively independent, it cannot fully detach from the broader Bitcoin environment. If Bitcoin experiences a significant correction going forward, it may impact HYPE's rebound momentum.
II. HYPE: Short-Term Trading Review and Price Structure Analysis
1. HYPE Short-Term Trading Review (1x Leverage): (03.23~03.29)
We strictly followed our contingency plan and, based on trading signals captured by our proprietary spread trading model and momentum quantification model, executed a short-term (long) position on HYPE last week, successfully achieving a 5.25% profit.
• HYPE Short-Term Trading Summary: (Leverage *1x)
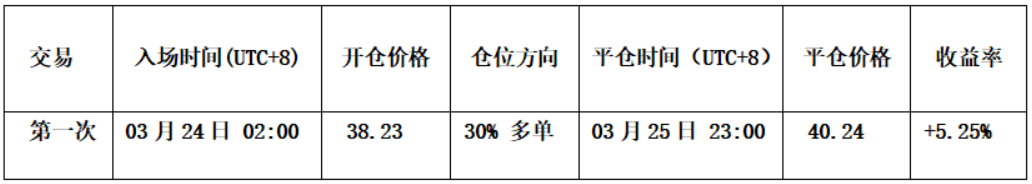
Table 1
• Entry Decision: This entry decision (see Figure 1) was based on meeting three bullish conditions. First, we anticipated a high probability that the prior hourly correction had ended near point 34. Second, the spread quantification model triggered a strong bottom signal (red dot + white dot). Third, the momentum quantification model issued a bottom divergence signal. Based on these signals, we entered a 30% long position at $38.23.
• Position closure decision: Triggered by a quantitative spread model generating a top bearish signal (white dot); a momentum model indicating top divergence; and a candlestick pattern forming a “strong top fractal.” These three signals created technical convergence, prompting us to close the position near $40.24.
• Trade Summary: This operation successfully generated a profit of approximately 5.25%.
HYPE 60-minute K-line chart (momentum quant model + spread trading model):
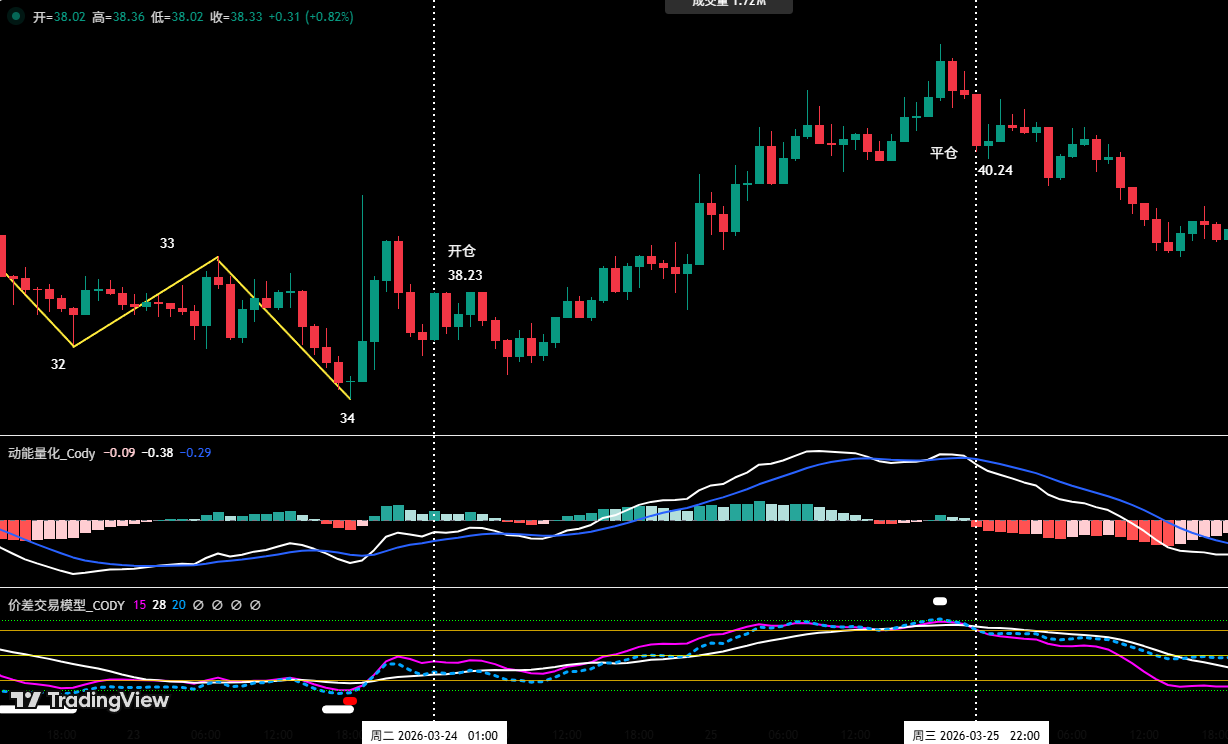
Figure 1 (Short-term trading diagram)
2. In-depth Analysis of HYPE's Current Price Structure (1-Hour Timeframe)
• As shown in Figure 2, reviewing the hourly price movement of HYPE between the 16th and 22nd, the price successfully formed a descending central segment (Central Segment C). We initially anticipated the low to form near Endpoint 32 (approximately $37.52), but the actual price action revealed the low occurred at the lower Endpoint 34 (approximately $36.79), dipping about $0.73 below our initial expectation.
• HYPE's hourly-level internal structure breakdown last week: (03.23~03.29)
a. As shown in (Figure 2), starting from point 34, HYPE’s price movement last week formed a complex consolidation structure consisting of eight segments: 34-35, 35-36, 36-37, 37-38, 38-39, 39-40, 40-41, and 41-42. At the time of analysis, the 41-42 segment is currently in progress.
b. Composed of segments 34-35 forming an upward structure.
c. The adjustment structure consists of seven segments: 35-36, 36-37, 37-38, 38-39, 39-40, 40-41, and 41-42. Among these, the five segments—36-37, 37-38, 38-39, 39-40, and 40-41—overlap to form a falling central structure (Central D).
d. The current market is currently in the divergence section (sections 41-42). As shown in Figure 2, the divergence section has formed a momentum divergence signal compared to the entry section (sections 35-36). If the divergence signal remains after the divergence section concludes, the probability of price moving upward is high.
HYPE_1 hour K-line chart:
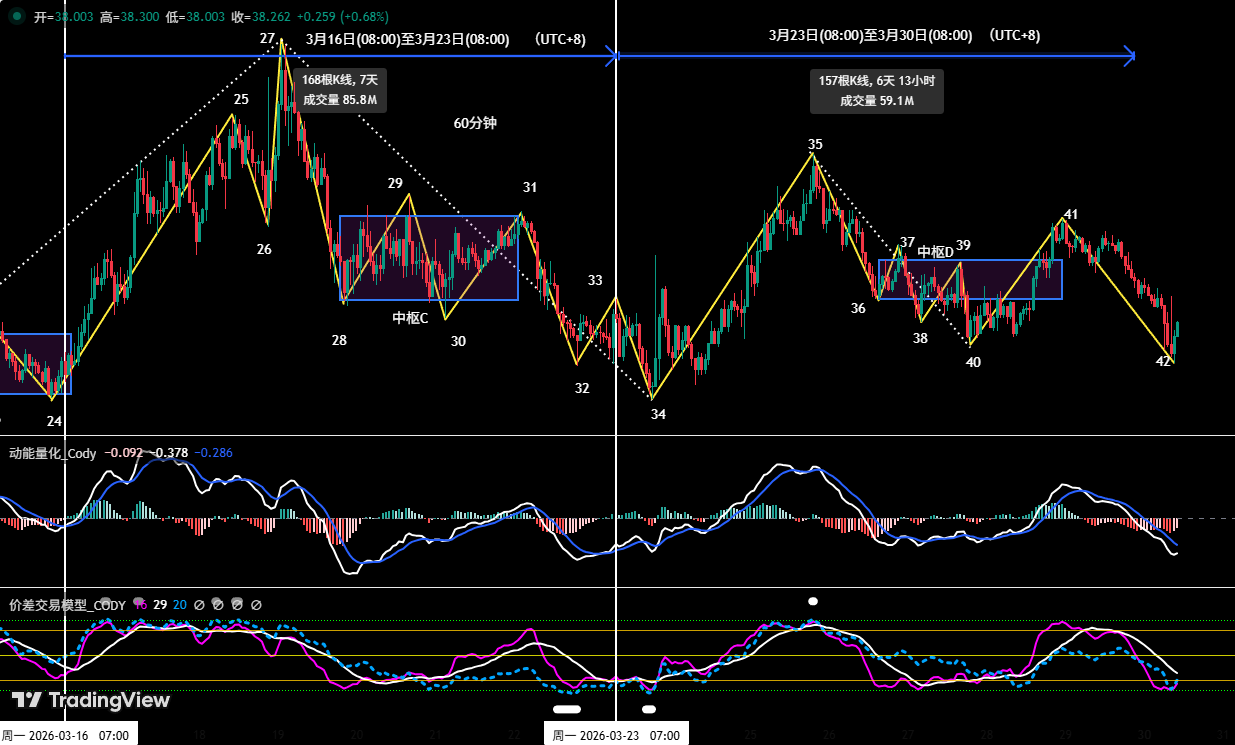
Figure 2
Three: Bitcoin Price Forecast and Trading Strategy for This Week
1. In-depth Analysis of Bitcoin's Current Price Structure (4-Hour Timeframe)
• Following the price action after the February 6 low (approximately $60,000).
• Maintain the core analytical framework established previously: In the February 16 Weekly Review, we clearly stated that the rally initiated from the February 6 low is an oversold rebound within the larger C-wave correction, specifically the C-2 wave, followed by an upcoming C-3 wave correction.
• Condition for Wave C-3: If the price of Bitcoin falls below the low of February 6 (approximately $60,000), then Wave C-3 is confirmed.
• Current BTC Market Analysis: As shown in Figure 3, on the 4-hour chart, Bitcoin effectively broke below the short-term uptrend line established from the February 24 low last week and has now reached near the lower boundary of the uptrend channel formed since the February 6 low, where it is currently trading in a narrow range. A break below this level could lead to a retest of the $60,000 support level.
• In-depth Analysis of BTC Hourly Price Structure: As shown in Figure 3, within the 4-hour time frame, Bitcoin has retraced from its high of approximately $76,000 on March 17, forming a five-segment corrective structure: 13-14, 14-15, 15-16, 16-17, and 17-18. Among these, segments 14-15, 15-16, and 16-17 constitute a downward consolidation zone (Consolidation B), while the subsequent departure segment (17-18) has now reached near the lower boundary of the upward channel. Currently, only the spread trading model has triggered a bottom alert signal (white dot) at this level. As a result, the price is exhibiting weak consolidation here, aimed at correcting the oversold condition of the 4-hour technical indicators.
Bitcoin 4-hour K-line chart:
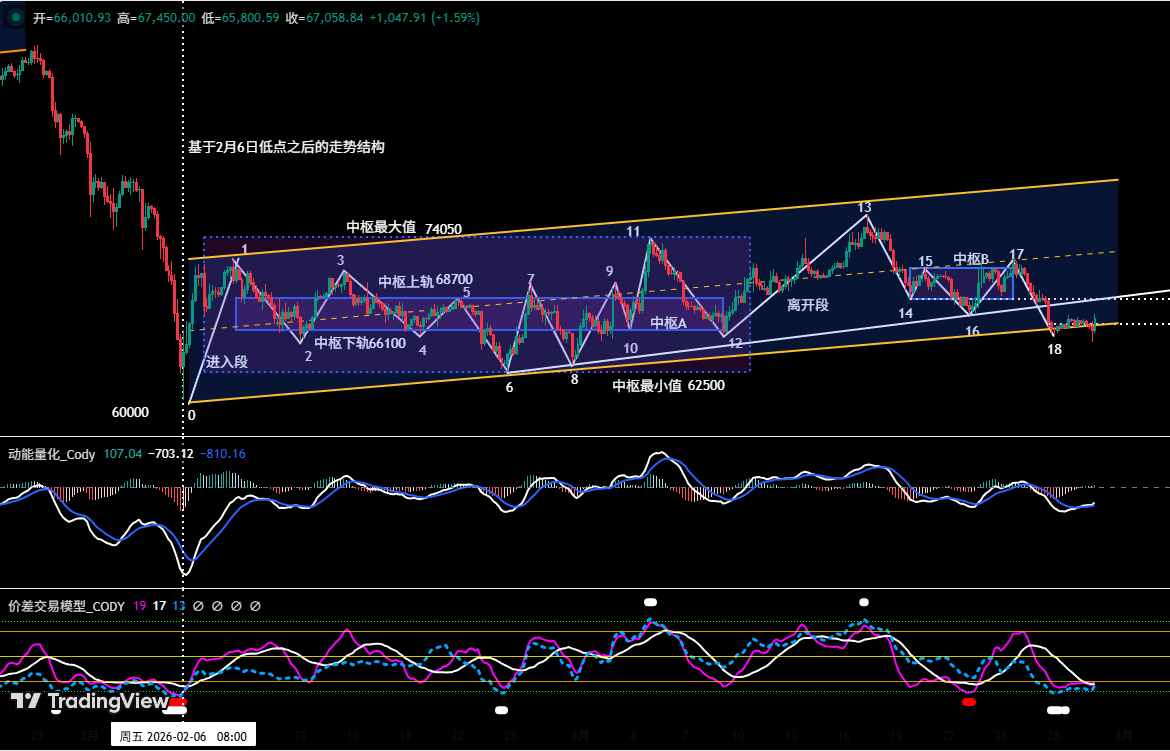
Figure 3
2. This week’s key perspective: Maintain a range-bound adjustment pattern, observing the battle between bulls and bears near the lower boundary of the channel (from the February 6 low).
3. Key resistance level:
• First resistance zone: $69,500 to $72,000 range (previous consolidation range)
• Second resistance zone: $74,500 to $76,000 area (near the November 2025 low)
4. Key Support Level:
• First support level: $65,000–$66,000 range (key previous support area)
• Second support level: $60,000–$62,500 range (near the February 6 low)
• Third support level: around $57,400
5. This Week’s Trading Strategy (excluding impact from sudden news): (03.30~04.05)
①. Medium-term strategy:
Bitcoin _ Daily K-line Chart: (Position Monitoring Model)
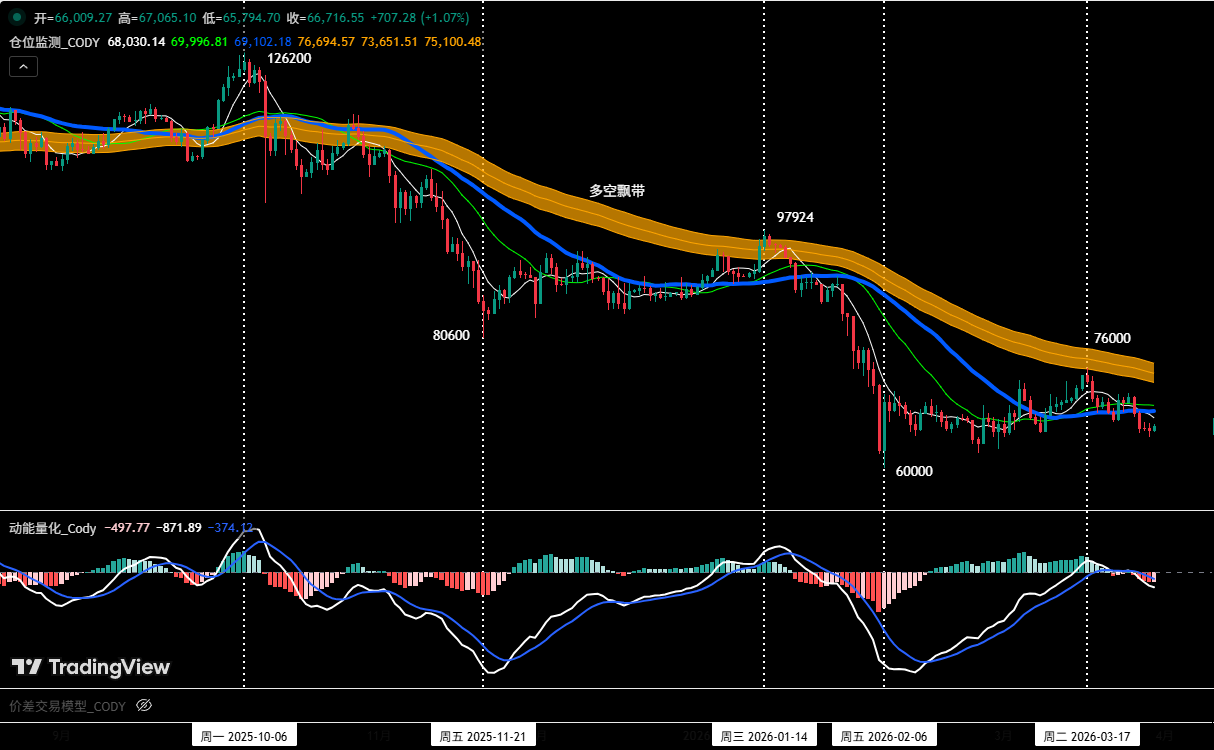
Figure 4
Position Monitoring Model: As shown in (Figure 4), the current price is below the Bull-Bear Ribbon (yellow), indicating continuation of the bearish trend. In accordance with our strategy rules, we continue to hold our 60% short position established at $89,000 (January 28). If the price effectively rebounds and closes above the Bull-Bear Ribbon, we will fully close our medium-term position.
② Short-term strategy: Use a 30% position size, set stop-loss levels, and identify arbitrage opportunities based on support and resistance levels. (Use a 30-minute or 60-minute time frame for trading.)
③ Based on the expectation of a medium-term bearish market trend, we should adhere to the principle of “trading in the direction of the trend” by taking short positions. To dynamically respond to the market’s complex evolution and in conjunction with signals from our proprietary trading model, we will prepare two short-term trading strategies, A and B:
• Option A: Rebound meets resistance; sell on rallies.
• Open position: When the price rebounds to the $69,500–$72,000 range and triggers a resistance signal combined with a model top signal, establish a 30% short position.
• Risk Management: Initial stop-loss levels for short positions are all set above $74,500.
• Close positions: When the price approaches a key support level in conjunction with model signals, gradually close positions to realize profits.
• Option B: Enter a short position on a breakout with the trend.
• Open position: When the price effectively breaks below the $65,000–$66,000 range and is confirmed by the model’s top signal, consider establishing a 30% short position.
• Risk Management: Initial stop-loss for short position set above $67,500.
• Close positions: When the price declines to the support level and aligns with model signals, gradually close positions to realize profits.
Four: Bitcoin: Trade Review
1. Short-term Trading Review: (See Table 2)
We strictly followed our operational protocol and executed a short-term (short) trade last week based on trading signals generated by our proprietary spread trading model and momentum quantification model, achieving a profit of 6.17%.
① Bitcoin Short-Term Trading Activity Summary: (Leverage *1x)
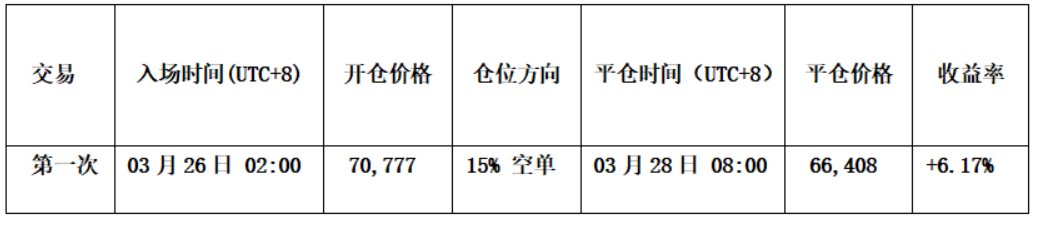
Table 2
② Short-term Trading Review: (See Figure 5)
• Open Position: As the coin price rebounded to around $72,000 and encountered resistance, the spread trading model simultaneously triggered a top alert signal (white dot), which aligned with the momentum quant model to generate a short-selling resonance. Based on this combined signal, we established a 15% short position at $70,777.
• Close position: When the coin price stabilized near $65,000 and the spread trading model triggered a strong bottom alert signal (red dot + white dot), we closed our entire position near $66,408.
• Summary: This transaction resulted in a profit of approximately 6.17%.
Bitcoin 60-minute K-line chart: (Momentum Quantification Model + Spread Trading Model)
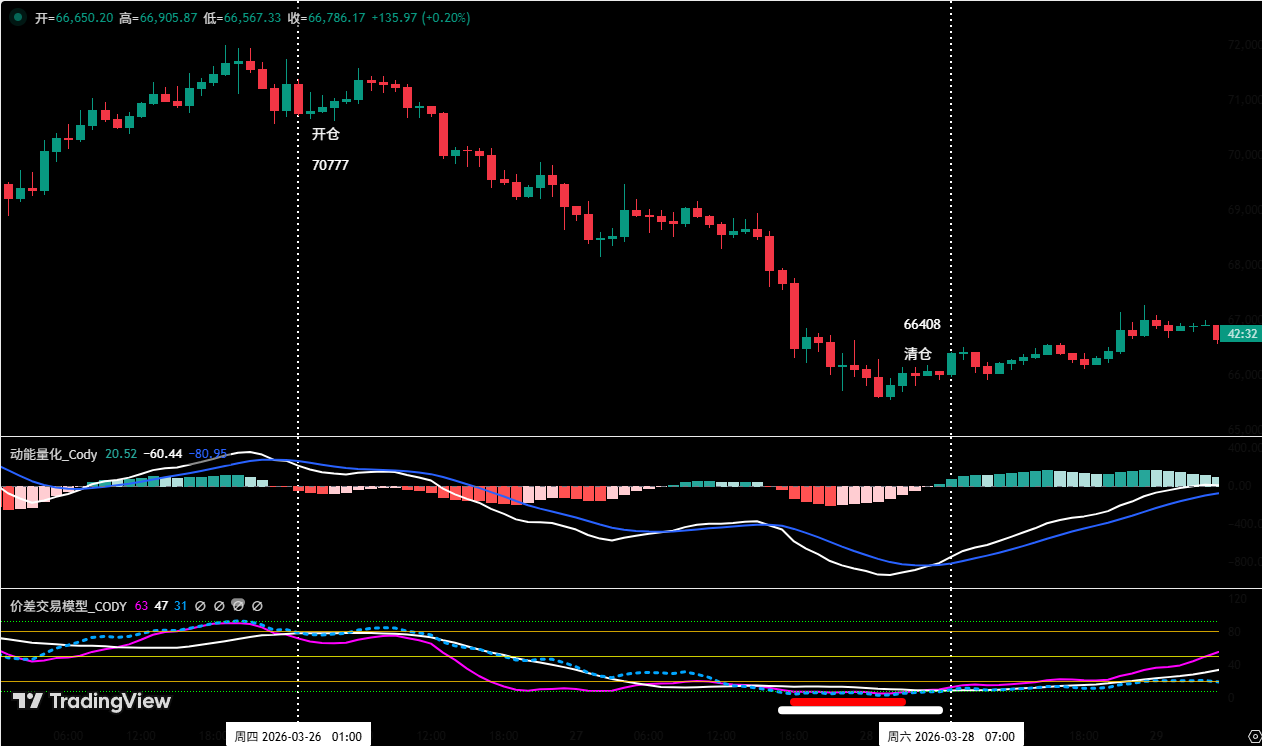
Figure 5 (Short-term trading diagram)
2. Medium-term trading review:
Medium-term strategy: Continue holding the 60% short position established near $89,000 (January 28), with a profit of approximately 24.76% as of the close of last week (closing price around $66,962).
Five: Special Notice:
1. When opening a position: Set the initial stop-loss immediately.
2. When profit reaches 1%: Move the stop-loss to the entry price (break-even point) to secure your principal.
3. When profit reaches 2%: Move the stop-loss to the 1% profit level.
4. Continuous tracking: For every additional 1% profit in price, the stop-loss level moves同步 by 1%, dynamically protecting and locking in gains.
Financial markets are constantly changing; all market analysis and trading strategies must be adjusted dynamically. All viewpoints, analytical models, and trading strategies mentioned in this article are derived from personal technical analysis and are intended solely for personal trading logs; they do not constitute any investment advice or basis for action. The market carries risks—invest with caution and do not make decisions based on this information.