


Key Insights:
- Altcoin dominance structure supports a potential 40-50x cycle.
- Bitcoin dominance rejection resembles setups before 2017 and 2021 altseasons.
- ALT/BTC monthly support bounces historically preceded explosive altcoin rallies.
Altcoin season signals are increasing due to the long-term dominance charts across multiple signals. Several historical structures now resemble setups that were seen before in previous altseasons. Traders are watching to see if this is the early phase of rotation.
Altcoin Dominance Bounces From Multi-Cycle Trend Support
Altcoin dominance has bounced back from an uptrending year-long trend line seen in the monthly charts. This same structure was responsible for the previous altcoin season phases in the years 2018 and 2022. Each rebound was accompanied by strong relative performance across non-Bitcoin assets.
Charts shared by Dr. Whale showed dominance, forming a higher low within an ascending channel. The pattern closely resembles the historical Altcoin season launch zones on the chart.
Momentum indicators, such as the MACD, are turning up from compressed levels. Golden cross signals have previously coincided with major expansions of altcoins.
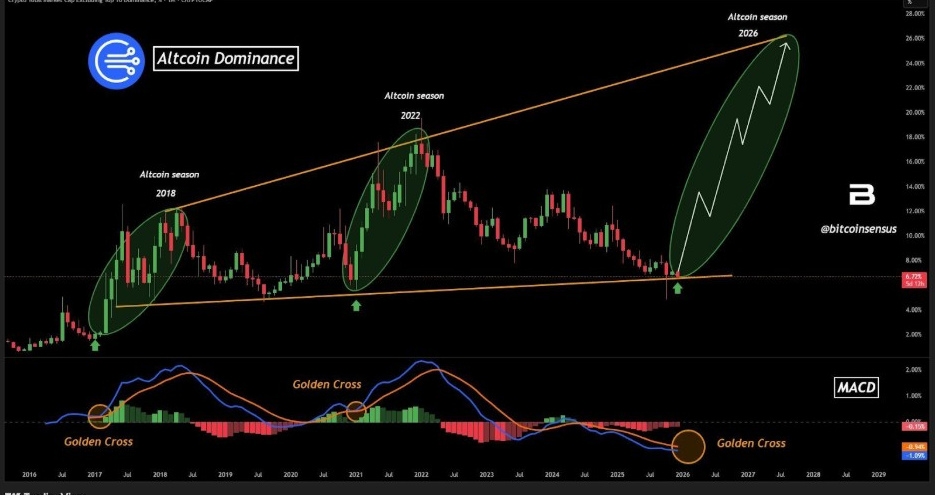
The rebound took place exactly on the lower boundary of the long-term channel. Price respected the structure without extended breakdown efforts. Such reactions can often be an indication of accumulation rather than distribution. This behavior historically precedes sustained directional moves.
BTC Dominance Loses Momentum after Topping Cycle Highs
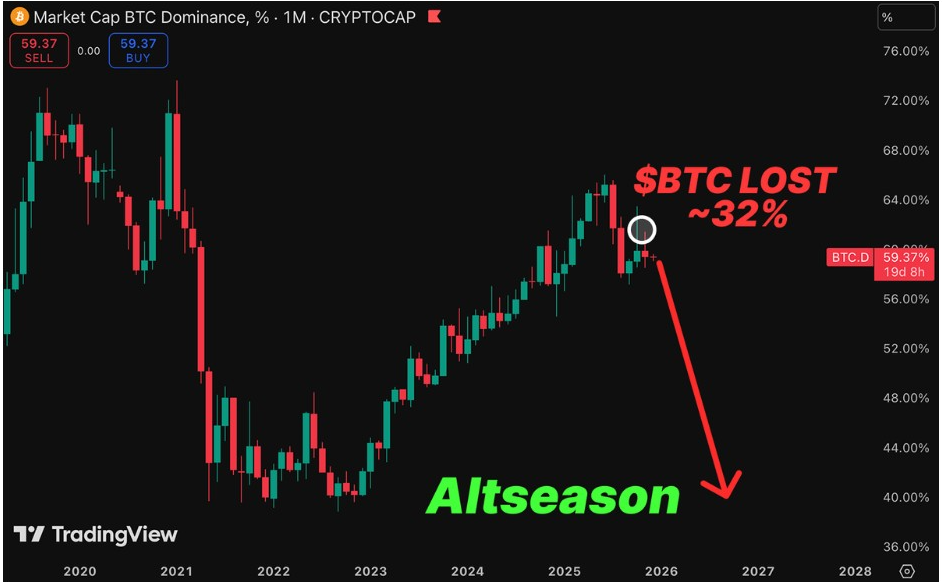
Bitcoin dominance has stalled recently, after moving towards the mid-60 percent range. That region aligns with historical cycle highs marked on the charts. Repeated failures around this point weaken bullish dominance momentum.
ParabolicXBT noted that dominance broke its rising channel and retested it. He added that similar structures have preceded altseason phases in 2017 and 2021. According to his framework, early crowd positioning tends to delay rotations. Once the expectations fade, the actual move tends to follow.
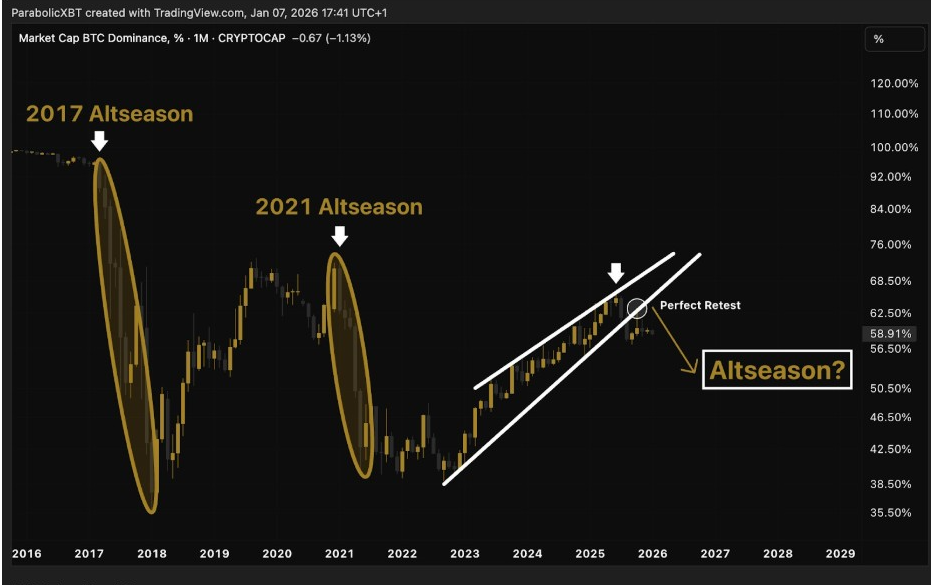
The current pullback formed after a rejection from resistance. This implied the waning upside strength for Bitcoin dominance. Such conditions in the past provided space for altcoin rallies.
Conflicting Views Emerge as Dominance Tests Key Levels
However, not all analysts view the current setup as confirmation of an immediate altcoin season. Some believe Bitcoin’s dominance might make one last attempt to rise higher. That perspective frames the recent pullback as a corrective pause.
Klarck said dominance could swing back towards the 60% to 62% range. He called the ongoing decline unfinished, not fully reversed. Under that scenario, there may be temporary relief for altcoins. A sustained altcoin season would require a deeper dominance breakdown.
Still, even cautious interpretations add to increased downside pressure. The repeated failure to continue is a sign of weak confidence. Each time there is a rejection, the probability of structural rollover increases. This tension keeps the altcoin season firmly in focus.
Other/BTC ratio and Altcoin Season Index Add Confirmation
The Other/BTC monthly chart is maintaining an uptrend with support from a trendline. This represents the third major bounce from that structure. Past bounces resulted in long periods of altcoin outperformance.
Charts shared by Bitconsensus show price pressing towards long-term resistance near 0.7. That level was previously a cap for rallies during strong altcoin seasons. A move towards it would mean huge gains against Bitcoin.
Meanwhile, the Altcoin Season Index from CoinMarketCap is currently near the low 20s. The index has continued to indicate Bitcoin season conditions to this day. Historically, major altcoin season rallies have been triggered at the point where the index appeared weakest. Early rotations are often begun before index confirmation.
The post Could Altcoins Deliver 40–50x Gains as Altseason Structure Repeats? appeared first on The Market Periodical.