


Original Title: The Microstructure of Wealth Transfer in Prediction Markets
Original Author: Jonathan Becker
Translated by SpecialistXBT, BlockBeats
Editor's Note: The author thoroughly examines how retail traders' irrational preference for "long shots" and "confirmatory outcomes" leads to the emergence of the "optimism tax." This is not only a rigorous analysis of market microstructure, but also a must-read guide for every market participant to avoid common pitfalls.
The following is the original content:
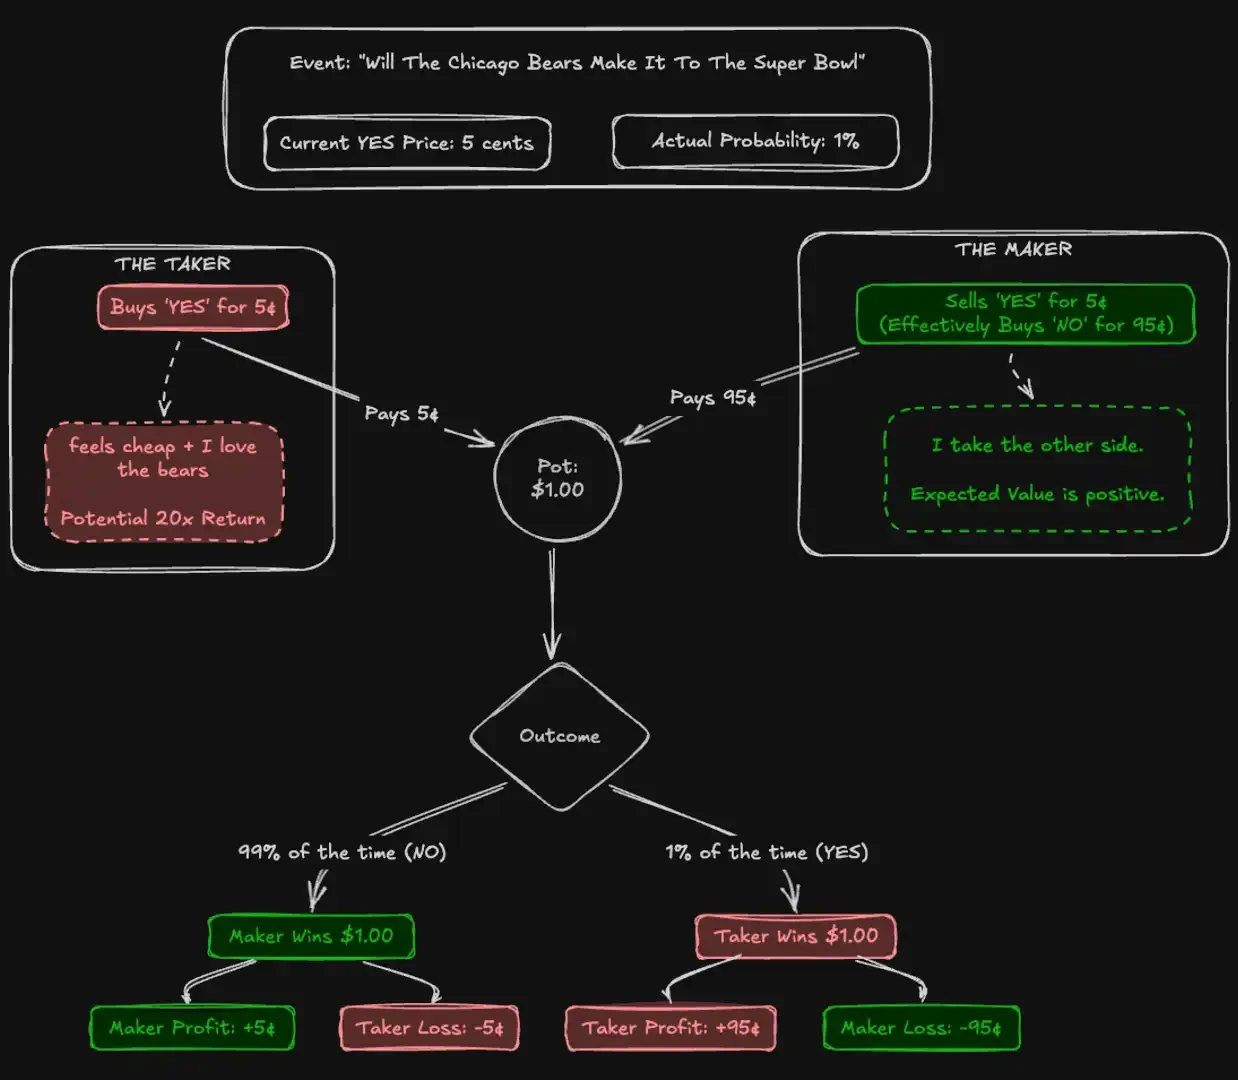
Slot machines on the Las Vegas Strip return about 93 cents for every dollar wagered. This is widely considered one of the worst odds in gambling. However, on the prediction market Kalshi, which is regulated by the U.S. Commodity Futures Trading Commission (CFTC), traders have placed substantial amounts of money on "longshot" contracts with historical returns as low as 43 cents for every dollar. Thousands of participants voluntarily accept expected values far worse than those of casino slot machines, simply to bet on their beliefs.
The Efficient Market Hypothesis (EMH) suggests that asset prices should perfectly incorporate all available information. In theory, prediction markets provide the purest test of this hypothesis. Unlike stocks, the intrinsic value of prediction markets is not ambiguous: a contract either pays $1 or pays nothing. A price of 5 cents should precisely indicate a 5% probability.
To test this effectiveness, we analyzed 72.1 million transactions covering $18.26 billion in trading volume. Our findings suggest that the accuracy of the crowd relies less on rational actors and more on a "harvesting errors" mechanism. We documented a systematic wealth transfer: impulsive "takers" pay a structural premium for "YES" outcomes, while "makers" capture an "optimism tax" simply by selling contracts to this biased flow of capital. This effect is strongest in high-participation categories such as sports and entertainment, whereas in low-participation categories like finance, markets approach near-perfect efficiency.
Contributions of this paper
This paper makes three contributions.
First, it confirms the presence of a "longshot bias" on Kalshi and quantifies its magnitude across different price levels.
Second, it decomposes returns by market roles, revealing a continuous wealth transfer from takers to makers driven by asymmetric order flows.
Third, it identifies a "YES/NO asymmetry," where bettors disproportionately favor affirmative bets on high-risk wagers (low-probability prices), thereby exacerbating their losses.
Predictive Markets and Kalshi
A prediction market is an exchange where participants trade binary contracts on real-world outcomes. These contracts settle for either $1 or $0, with prices ranging from 1 to 99 cents, serving as a proxy for probability. Unlike stock markets, prediction markets are strictly zero-sum games: every dollar of profit corresponds exactly to a dollar of loss.
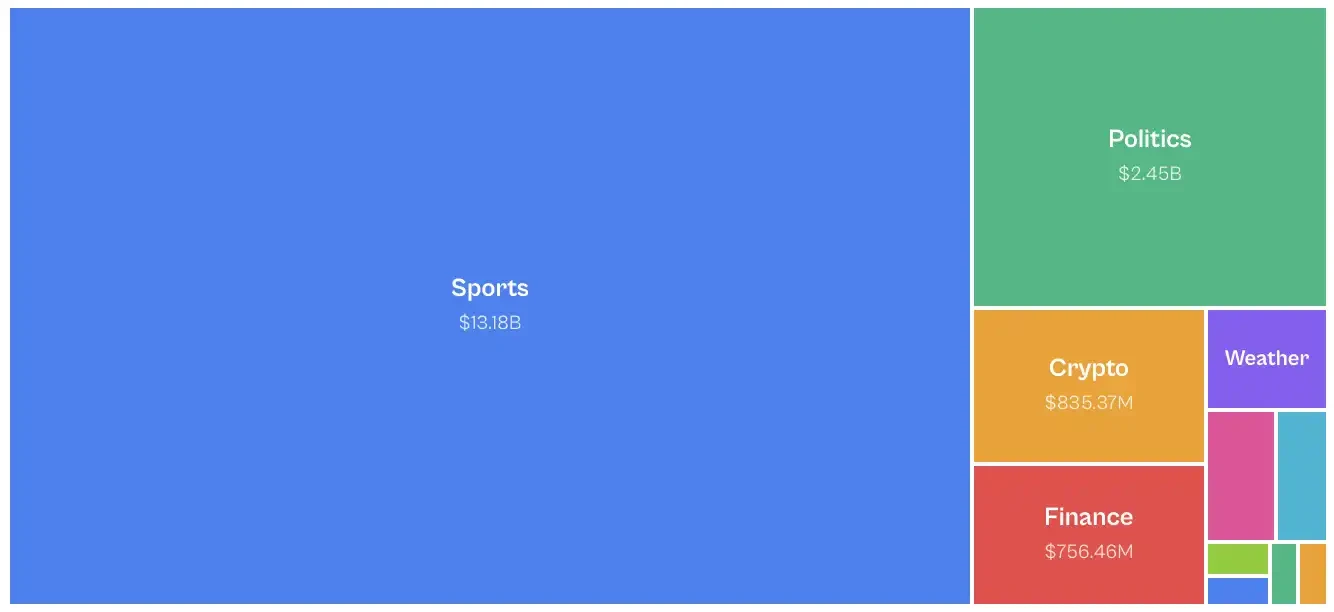
Launched in 2021, Kalshi is the first prediction market in the United States regulated by the CFTC. Initially focused on economic and weather data, the platform remained niche until 2024. The 2024 election cycle triggered explosive growth after the platform legally overcame the CFTC and gained the right to list political contracts. The sports market, introduced in 2025, now dominates trading activity. Trading volume is highly unevenly distributed across categories: sports account for 72% of nominal trading volume, followed by politics (13%) and cryptocurrencies (5%).
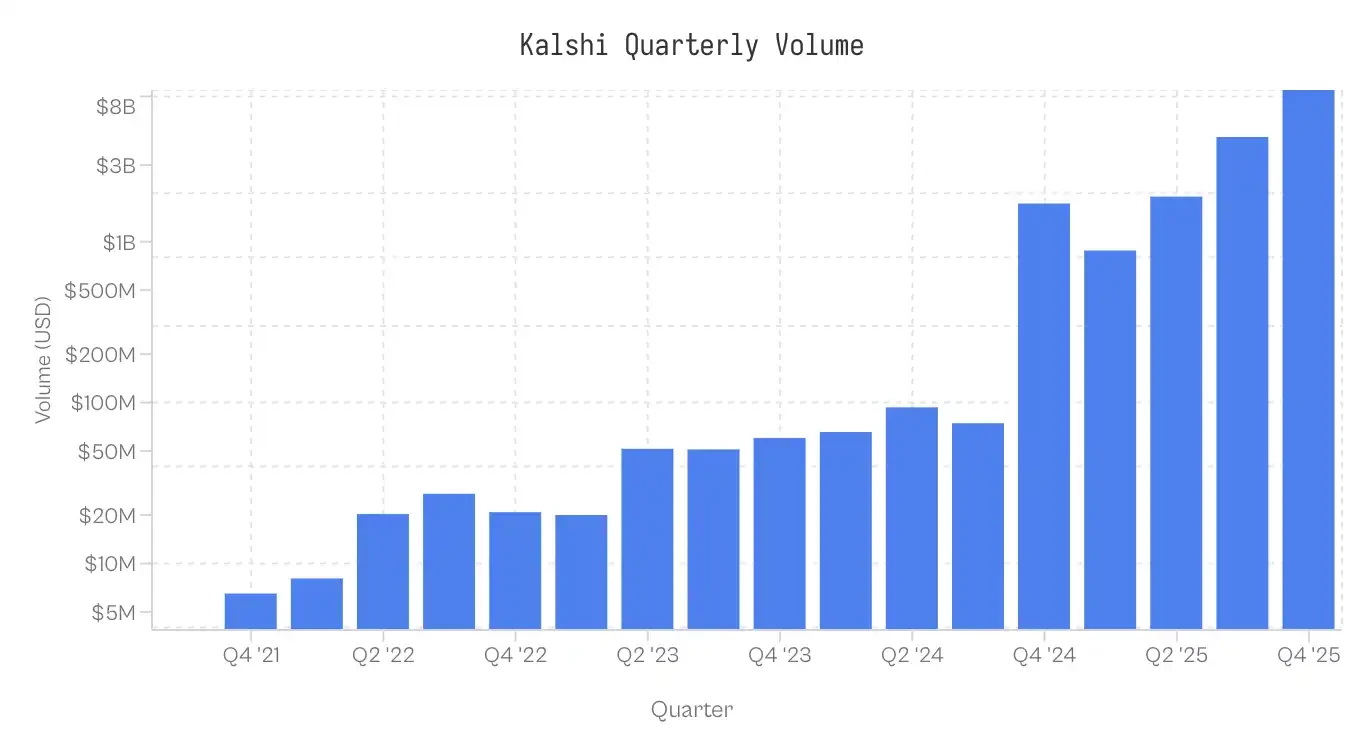
Note: Data collection is as of November 25, 2025, 5:00 PM ET; the data for the fourth quarter of 2025 is incomplete.
Data and Methodology
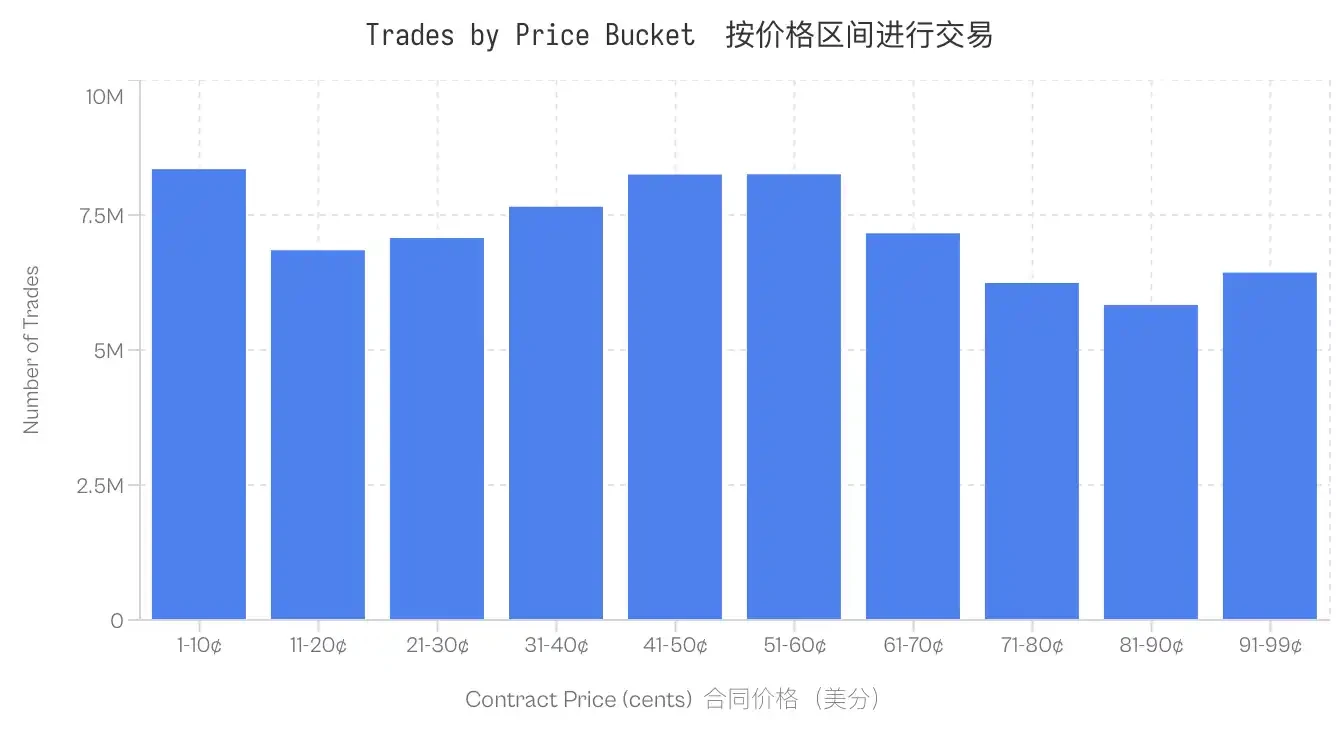
The dataset contains 7.68 million markets and 72.1 million trades. Each trade records the execution price (1-99 cents), whether it was a market-taker order (yes/no), the number of contracts, and a timestamp.
Role Assignment: Each trade identifies the liquidity consumer (taker). The maker takes the opposite position. If taker_side = yes and the price is 10 cents, it means the taker buys YES at 10 cents; the maker buys NO at 90 cents.
Cost Basis (Cb): To compare the asymmetry between YES and NO contracts, we normalize all transactions by the capital at risk. For a standard YES transaction of 5 cents, Cb = 5. For a NO transaction of 5 cents, Cb = 5. Unless otherwise specified, the term "price" mentioned in this paper refers to this cost basis.
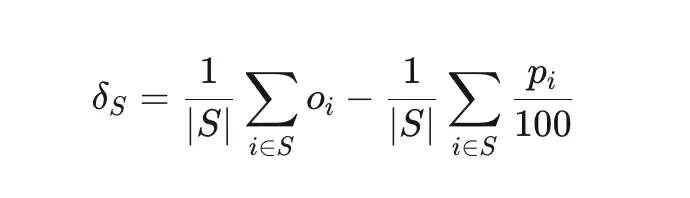
Price discrepancy (δS) measures the deviation between the actual win rate of a set of trades S and the implied probability.
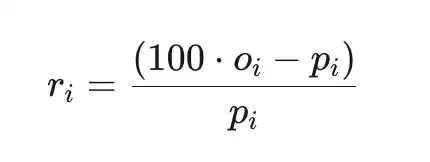
The total excess return (ri) is the return relative to the cost (before platform fees), where pi is the price in cents, and oi∈{0,1} is the outcome.
Sample
The calculation is based only on settled markets. Markets that have been canceled, delisted, or are still open are excluded. In addition, trades in markets with a notional volume of less than $100 are also excluded. This dataset remains robust across all price levels; even the least active price range (81-90 cents) contains 5.8 million trades.
Longshot Bias on Kalshi
Longshot Bias was first recorded in horse racing by Griffith (1949), and later formalized in the analysis of parimutuel betting markets by Thaler & Ziemba (1988). It describes the phenomenon where bettors tend to overpay for outcomes with low probabilities. In an efficient market, a contract priced at p cents should have approximately a p% chance of winning. In markets exhibiting Longshot Bias, the win rates of low-priced contracts are lower than their implied probabilities, while the win rates of high-priced contracts are higher than their implied probabilities.
Kalshi's data confirms this pattern. Contracts trading at 5 cents had only a 4.18% win rate, implying a -16.36% pricing error. In contrast, contracts trading at 95 cents had a 95.83% win rate. This pattern is consistent: all contracts priced below 20 cents performed worse than their odds, while contracts priced above 80 cents performed better than their odds.
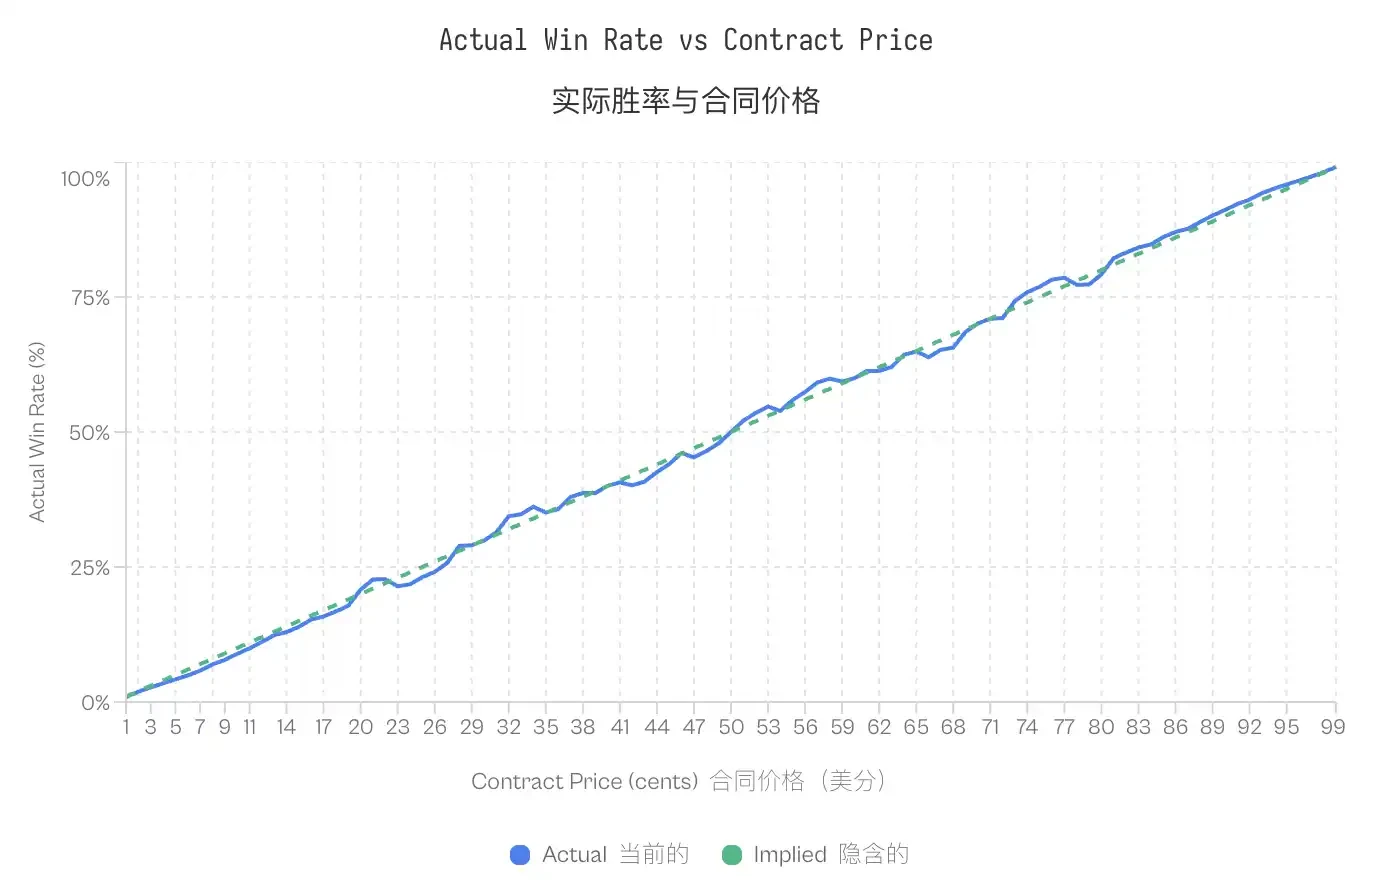 Note: Despite this bias, the calibration curve shows that prediction markets are actually quite effective and accurate, with only slight exceptions in the tails (extremely low or high prices). The close alignment between implied and actual probabilities confirms that prediction markets are well-calibrated mechanisms for price discovery.
The existence of the longshot bias brings up a problem unique to zero-sum markets: if some traders systematically pay excessively high prices, who captures the remaining value?
Wealth transfer between order makers and takers
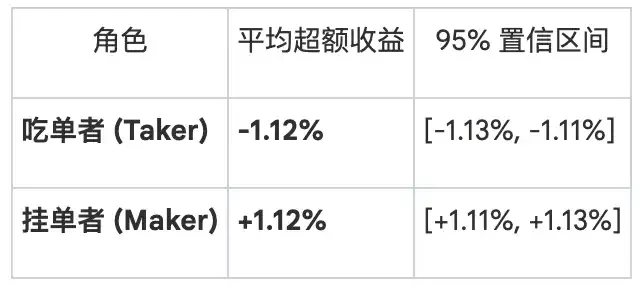
Breakdown of Returns by Role Market microstructure defines two categories of participants based on their interaction with the order book. Makers provide liquidity by placing limit orders that remain on the order book. Takers consume liquidity by executing against existing orders. A breakdown of total returns by role reveals a clear asymmetry:
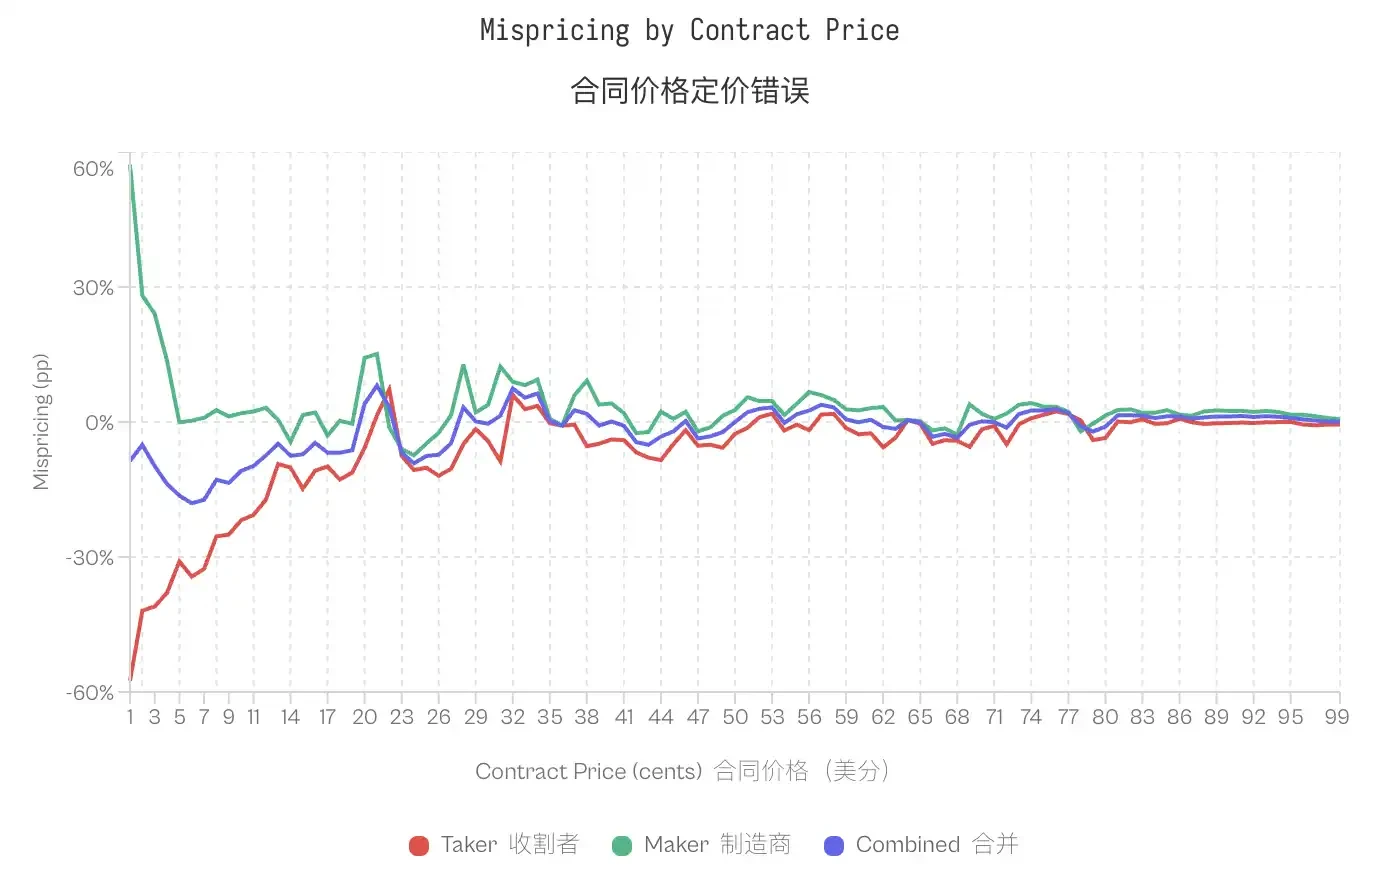
This discrepancy is most evident in the tails. For the 1-cent contract, the taker's winning probability is only 0.43% (implied probability of 1%), corresponding to a -57% mispricing. The maker's winning probability for the same contract is 1.57%, with a +57% mispricing. At 50 cents, the mispricing is compressed; takers show -2.65%, while makers show +2.66%. At 80 out of 99 price levels, takers exhibit negative excess returns, while makers show positive returns at the same 80 levels.
The overall market mismatch is concentrated among specific groups: order takers bear the losses, while order makers gain the profits.
Is this just a price difference compensation?
A clear counterargument is that liquidity providers earn the bid-ask spread as compensation for providing liquidity. Their positive returns may simply reflect spread capture, rather than exploiting biased information flows.
Although this may seem reasonable, two observations suggest otherwise. First, the returns of liquidity providers depend on the direction they take. If profits were purely based on the spread, it should not matter whether liquidity providers buy YES or NO.
We test this by decomposing the order initiator's performance by position direction:
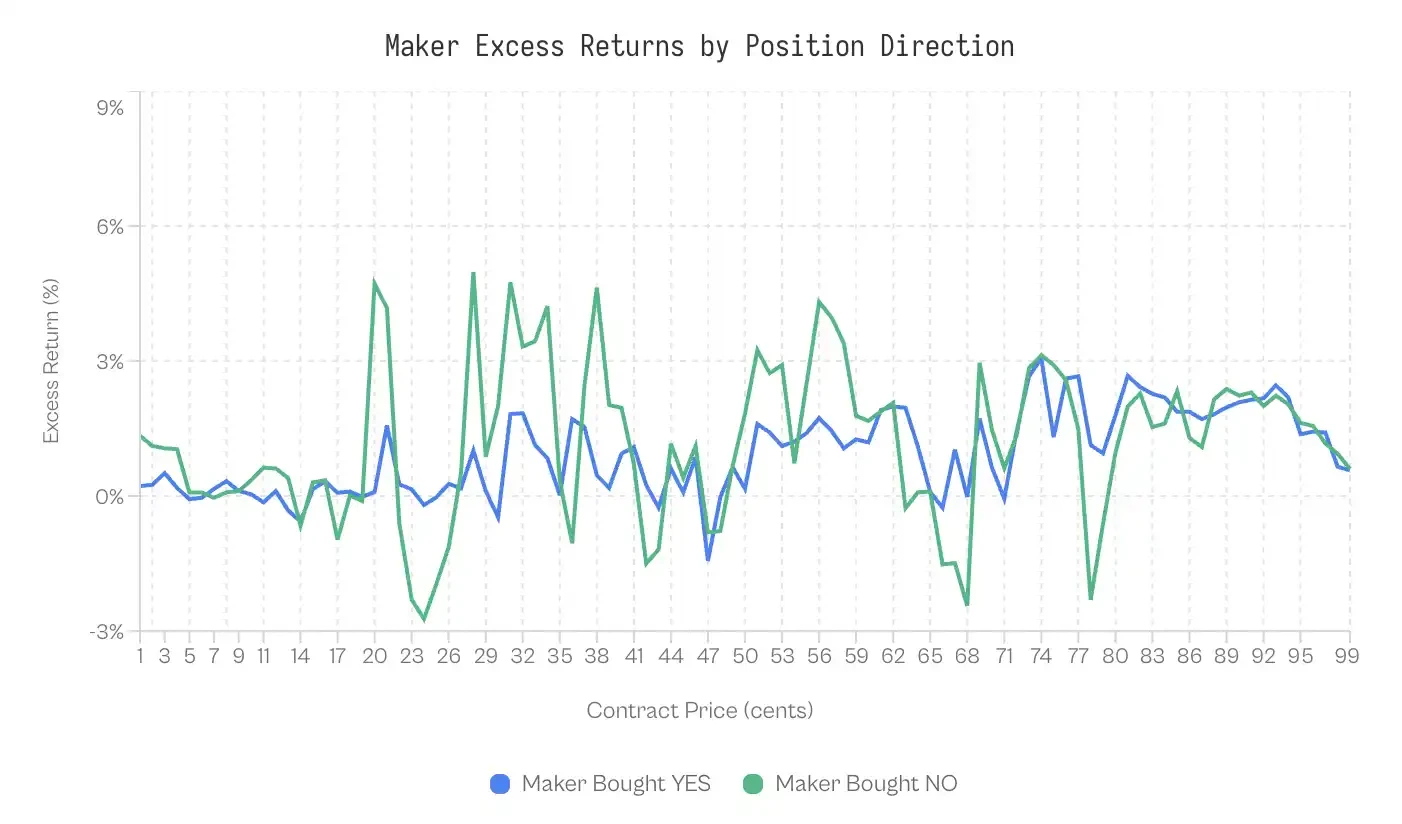
Order makers buying NO outperformed order makers buying YES 59% of the time.
The weighted excess returns for YES buy orders are +0.77%, while for NO buy orders they are +1.25%. The difference between the two is 0.47 percentage points. Although this effect is very small (Cohen's d = 0.02-0.03), it is stable.
At a minimum, this suggests that spread capture is not the sole reason.
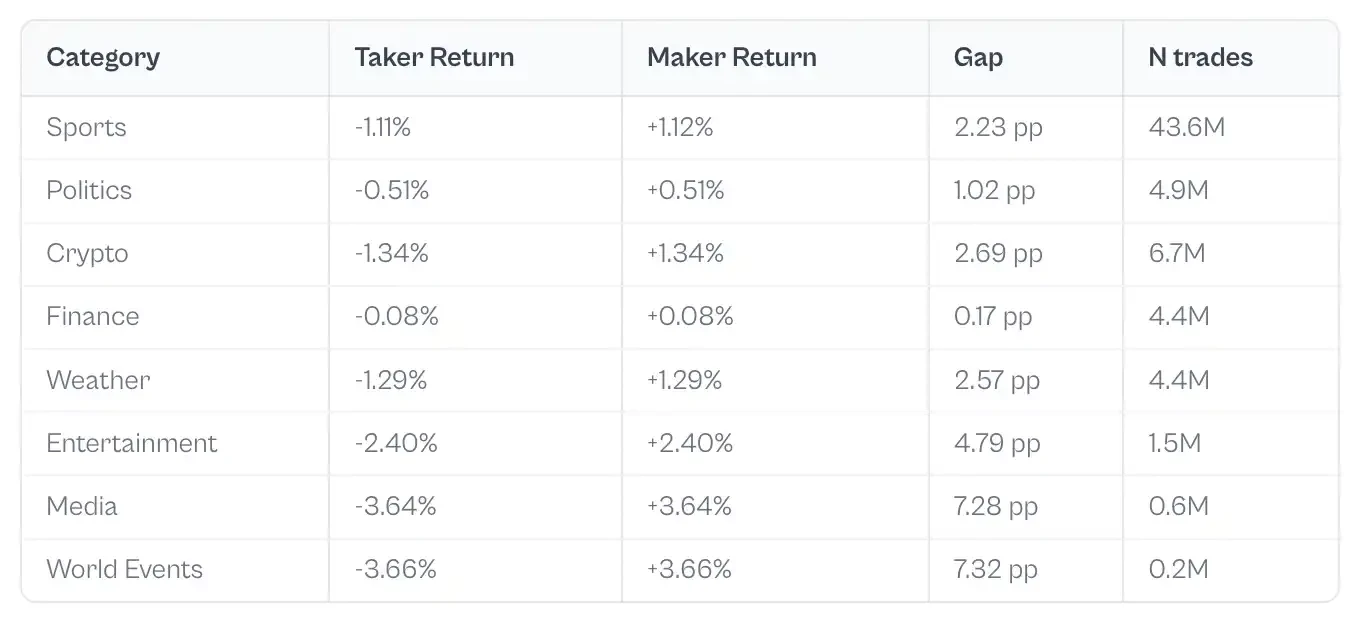
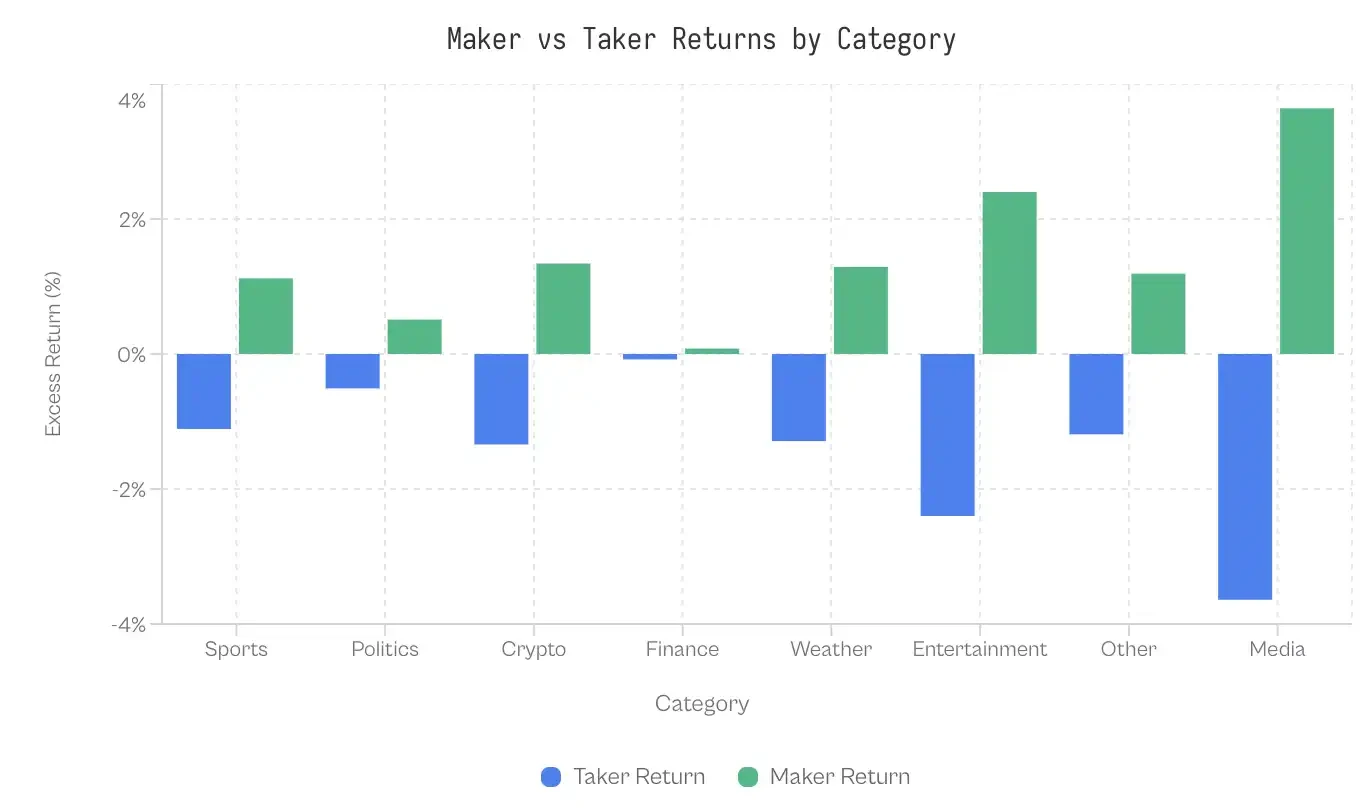
Differences between market categories
If irrational demand for certain categories leads to bias, then categories that attract fewer sophisticated participants should show larger discrepancies. The data is striking: the financial category shows a discrepancy of only 0.17 percentage points; the market is extremely efficient.
At the other end, the gap between world events and media coverage exceeds 7 percentage points. Sports, being the category with the highest trading volume, shows a moderate gap of 2.23 percentage points. Considering the $6.1 billion in buy order volume, even this moderate gap results in a significant transfer of wealth.
Why are financial markets so efficient? A possible explanation is participant selection; financial questions attract traders who think in terms of probabilities and expected values, rather than fans betting on their favorite teams. The questions themselves are inherently dull (e.g., "Will the S&P index close above 6000 points?"), which filters out emotionally driven bettors.
The Evolution of Takers and Makers
The difference between makers and takers is not an inherent feature of the market; it emerged as the platform evolved. In the early days of Kalshi, the pattern was reversed: takers earned positive excess returns, while makers incurred losses.
From launch until 2023, takers earned an average of +2.0%, while makers lost -2.0%. Without experienced counterparties, takers won; amateur makers defined the early stage and became the losers.
This situation began to reverse in the second quarter of 2024 and the gap widened sharply after the 2024 general election.
The turning point coincided with two events: Kalshi obtaining a political contract license in October 2024 after defeating the CFTC, and the subsequent 2024 election cycle. Trading volume surged from $30 million in Q3 2024 to $820 million in Q4. The influx of new capital attracted sophisticated market makers, who then began extracting value from the order flow.
Before the election, the average gap was -2.9 pp (takers win); after the election, it reversed to +2.5 pp (makers win).
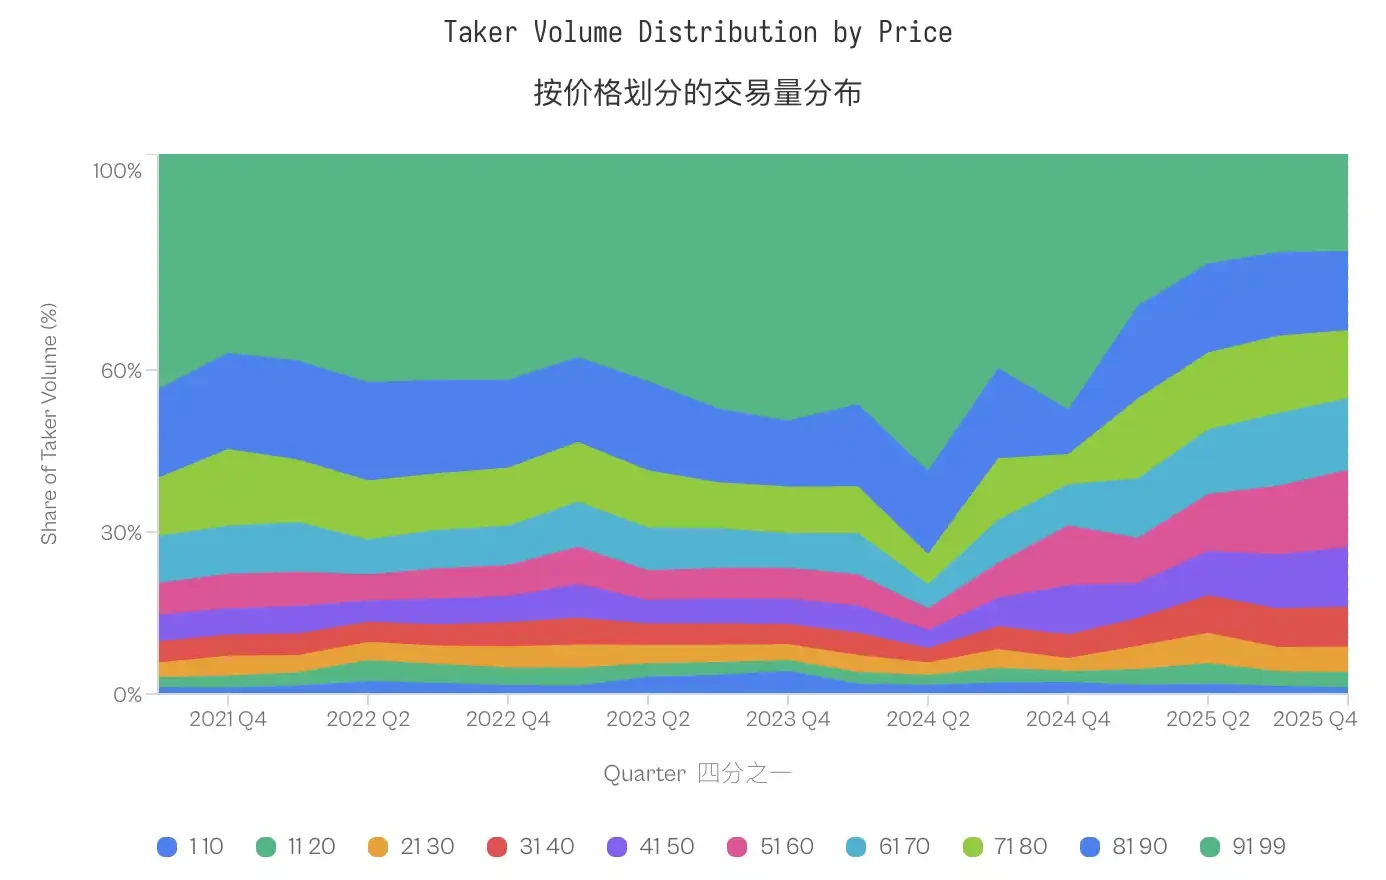
The trading volume share of low-probability contracts (1–20 cents) remained largely unchanged, at 4.8% before the election and 4.6% after the election. However, the distribution actually shifted toward the middle price range; the share of the 91–99 cents range decreased from 40–50% during 2021–2023 to less than 20% in 2025, while the mid-range prices (31–70 cents) experienced a significant increase.
The behavior of those who take single contracts has not become more extreme (the share of low-probability contracts has even slightly decreased), but their losses have increased.
This evolution reshaped the overall outcome. The transfer of wealth from traders to market makers is not an inherent feature of predicting market microstructure; it requires sophisticated market makers, and sophisticated market makers need sufficient trading volume to justify their participation.
In the early stages with low trading volume, market makers are likely to be inexperienced individuals who are outmatched by better-informed traders.
The surge in trading volume attracted professional liquidity providers, who can extract value from traders' cash flows at all price points.
YES/NO Asymmetry
The decomposition between makers and takers determines who absorbs the losses, but it leaves the question of how this occurs. Why is the pricing of taker flows always wrong? The answer does not lie in makers' superior predictive ability, but rather in takers' costly preference for favorable outcomes.
Asymmetry at the Same Price
The standard efficiency model suggests that, at the same price, pricing deviations across different contract types should be symmetric. Theoretically, a 1-cent "Yes" contract and a 1-cent "No" contract should reflect similar expected returns.
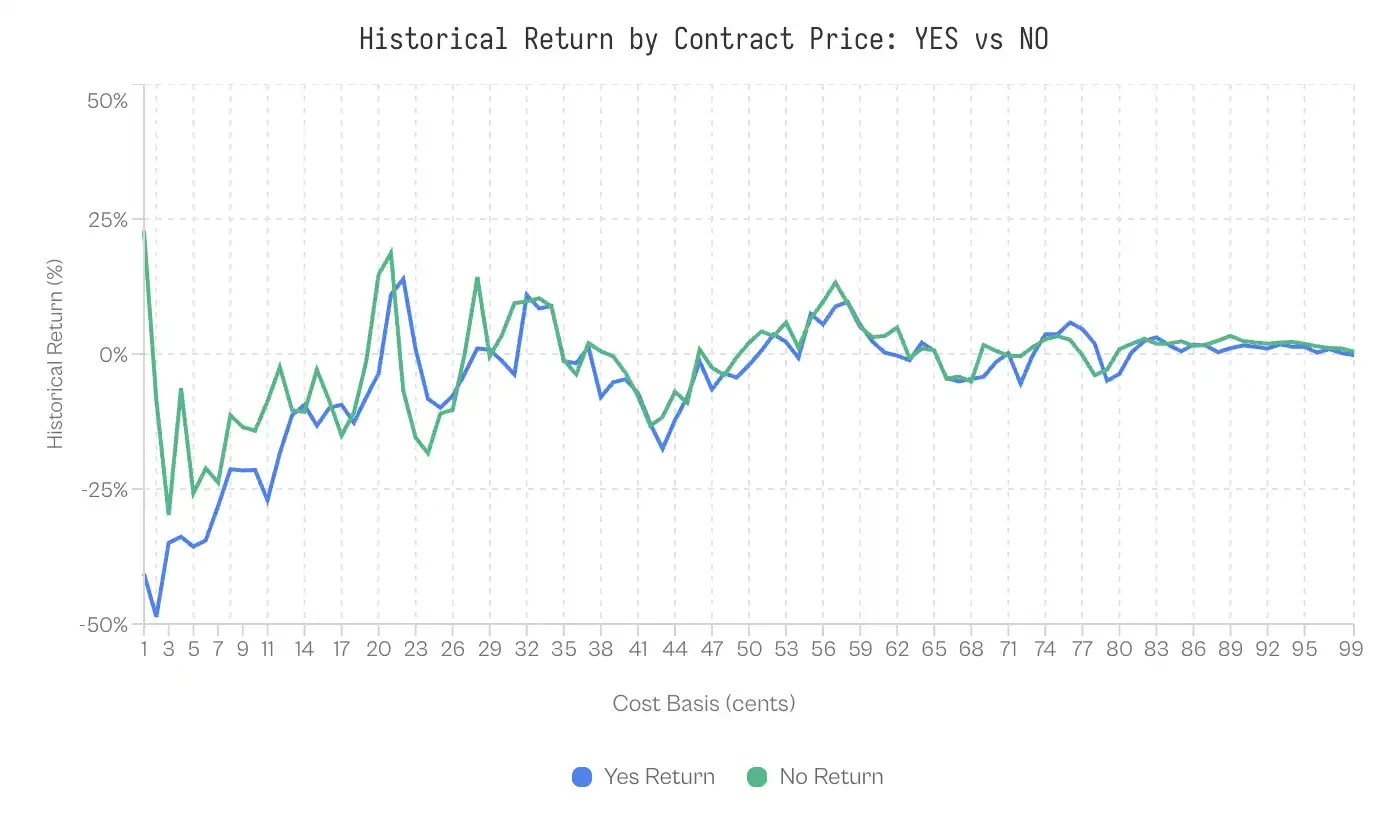
However, the data refutes this. At a price of 1 cent, the historical expected return for "YES" was -41%; buyers of YES could expect to lose nearly half of their principal. In contrast, the historical expected return for "NO" contracts at the same 1 cent price was +23%. The difference between these two seemingly similar probability estimates reaches as high as 64 percentage points.
The advantages of the NO contracts continue to exist. Among 99 price levels, the NO contracts outperformed the YES contracts at 69 price levels, with the advantages mainly concentrated at the extreme ends of the market price. The NO contracts generated higher returns at each price increment from 1 cent to 10 cents, as well as from 91 cents to 99 cents.
Although the market is a zero-sum game, the dollar-weighted return for "YES" buyers is -1.02%, while that for "NO" buyers is +0.83%, a difference of 1.85 percentage points. This discrepancy is caused by the overpricing of the "YES" contracts.
Eaters prefer affirmative bets.
Poor performance of the YES contract may be related to trader behavior. Analysis of trading data revealed structural imbalances in the order flow composition.
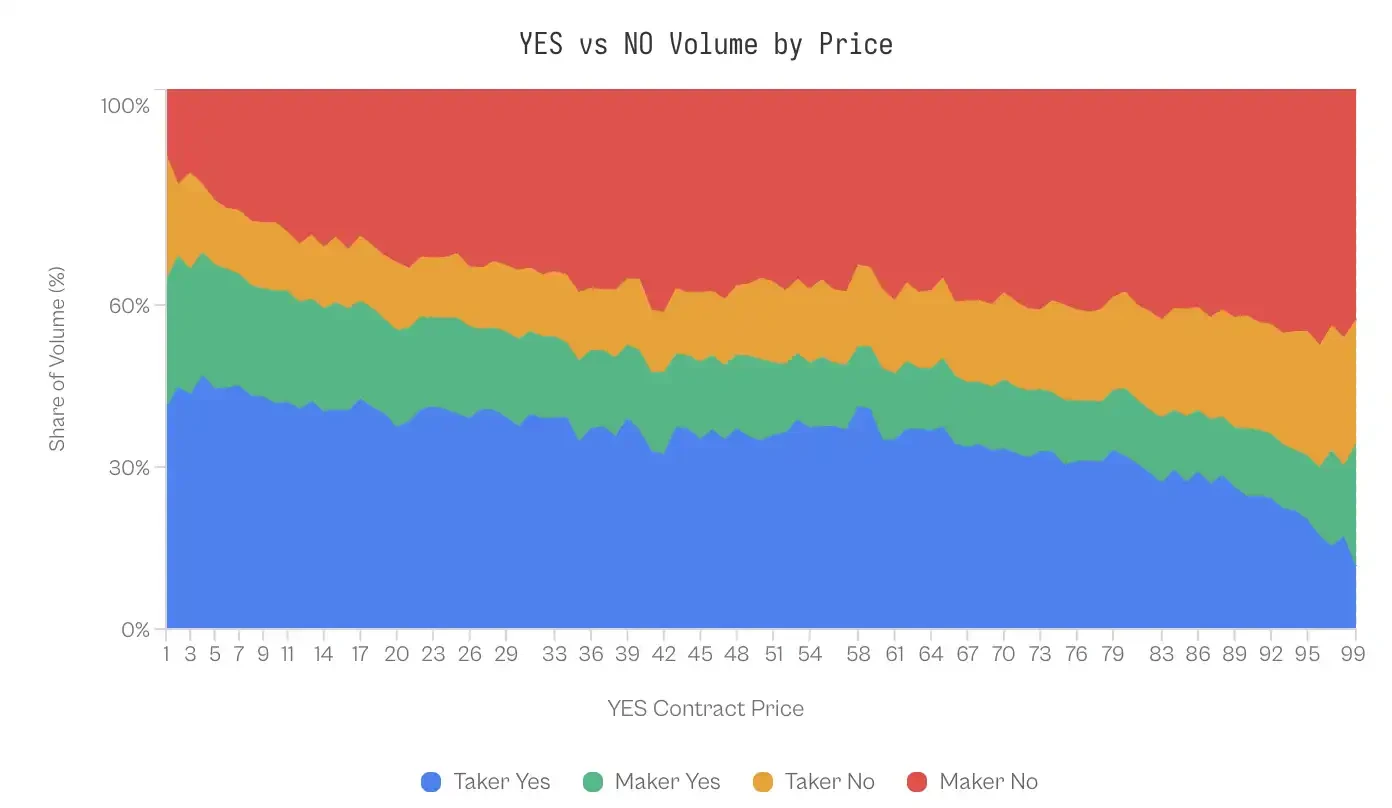
In the 1-10 cent range (where YES represents an underdog outcome), takers account for 41-47% of YES trading volume, while makers only account for 20-24%. This imbalance reverses at the other end of the probability curve. When the contract trades at 99 cents (implying that NO is the 1-cent underdog), makers actively buy NO contracts (accounting for 43% of the volume), while takers only account for 23%.
One might assume that market makers exploit this asymmetry to profit from more accurate directional predictions—that is, they know when to buy NO. However, the evidence does not support this assumption.
When decomposing the performance of market makers by position direction, the returns are almost identical. Statistically significant differences only appear in the extreme tails (1-10 cents and 91-99 cents), and even in these tails, the effect sizes are negligible (Cohen's d = 0.02-0.03).
This symmetry is significant: market makers do not profit by predicting directions in advance, but rather through a mechanism that applies equally to both directions.
Discussion
An analysis of 7.21 million trades on the Kalshi platform reveals a unique market microstructure: wealth systematically shifts from liquidity takers to liquidity makers. This phenomenon is driven by specific behavioral biases and is moderated by market maturity, concentrating in categories capable of eliciting high emotional engagement.
Profit Extraction Mechanism for Winners
In a zero-sum market, do winners prevail through informational advantage (forecasting) or structural advantage (market-making)?
The data strongly supports the latter.
When decomposing market maker profits by position direction, the performance difference is negligible: market makers who bought "YES" earned an excess return of +0.77%, while those who bought "NO" earned an excess return of +1.25% (Cohen's d ≈ 0.02).
This statistical symmetry suggests that market makers do not possess significant ability to predict winning outcomes. Instead, they profit through structural arbitrage: providing liquidity to the group of "order takers" who prefer high-risk, high-return outcomes.
This extraction mechanism relies on the "optimism tax."
Although the performance of low-probability "YES" contracts is 64 percentage points lower than that of low-probability "NO" contracts, traders still disproportionately buy "YES" contracts at low-probability prices, accounting for almost half of the total trading volume in that price range.
Therefore, market makers do not need to predict the future; they merely need to act as counterparties to optimistic traders. This is consistent with the findings of Reichenbach and Walther (2025) on Polymarket and Whelan (2025) on Betfair, which show that in prediction markets, market makers provide order flows that adapt to such biases rather than making predictions.
Specialization of liquidity
Between 2021 and 2023, despite the presence of the Longshot Bias, takers (those taking liquidity) still achieved positive returns. This trend reversal precisely coincided with the surge in trading volume on Kalshi following its legal victory in October 2024.
The wealth transfer observed by the end of 2024 is a function of market depth. In the early stages of the platform, low liquidity hindered the entry of sophisticated algorithmic market makers. The surge in trading volume after the 2024 election incentivized the entry of professional liquidity providers, who were able to systematically capture spreads and exploit biased capital flows.
Differences between markets
The differences in order-book imbalances across categories reveal how participant sorting shapes market efficiency.
• Finance (0.17 pp): As a control group, it demonstrates that prediction markets can approach efficiency. Questions such as "Will the S&P 500 close above 6,000 points?" attract participants who think in terms of probabilities and expected values, who are likely also options traders or macroeconomic data observers. The threshold for informed participation is high, and ordinary bettors have no advantage. Moreover, they are likely aware of this, and thus tend to opt out.
• Politics (1.02 pp): Although involving strong emotional factors, its predictive efficiency still shows a certain degree of insufficiency. Political bettors closely monitor opinion polls and have continuously adjusted their judgments through election cycles. This gap is larger than in financial categories but much smaller than in entertainment categories, indicating that although political participation is emotionally charged, it does not completely undermine probabilistic reasoning ability.
• Sports (2.23 pp): This is the category with the highest share in the prediction market. Although the difference is not large, it is still significant considering that this category accounts for 72% of the trading volume. Sports bettors demonstrate some documented preferences, including loyalty to home teams, the recency effect, and emotional attachment to star players. Fans betting on their supported teams to win championships are not calculating expected returns, but rather purchasing hope.
• Cryptocurrencies (2.69 pp): The participants drawn in are heavily influenced by retail investors' "price will go up" mentality, a group that overlaps with meme traders and NFT speculators. Questions such as "Will Bitcoin reach $100,000?" tend to be bets based more on narratives than on probabilistic estimates.
• Entertainment, media, and world affairs (4.79–7.32 pp): These areas show the largest gaps in understanding and share a common characteristic: people have very low thresholds for perceiving themselves as knowledgeable. Anyone who follows celebrity gossip feels qualified to predict the outcome of award ceremonies; anyone who reads news headlines feels they understand geopolitics. This leads the group of participants to conflate familiarity with judgment.
Our research indicates that market efficiency depends on two factors: the technical barriers to entry for informed participants, and the extent to which emotionally driven reasoning is triggered by issues implied in the market.
When market barriers are high and the framework is objective and calm, market efficiency approaches an ideal state; when barriers are low and the framework encourages narratives, the optimism effect reaches its peak.
Limitations
Although the data used in the study are reliable, there are still some limitations.
First, due to the lack of a unique trader ID, we can only rely on the "market maker/taker" classification to represent "sophisticated/unsophisticated" traders. Although this is a standard practice in the microstructure literature, it does not perfectly capture the situation where sophisticated traders trade across time using timely information.
Second, we cannot directly observe the bid-ask spread from historical transaction data, making it difficult to completely distinguish capturing the spread from exploiting biased traffic flows.
Finally, these results apply only to the U.S. regulatory environment; offshore trading venues with different leverage caps and fee structures may exhibit different dynamics.
Conclusion
The promise of predicting the market lies in its ability to aggregate diverse information into a single, accurate probability.
However, our analysis of Kalshi indicates that this signal is often distorted by systematic wealth transfers driven by human psychology and market microstructure.
The market splits into two distinct groups: a taker class that systematically overpays for low-probability, certain-outcome events, and a maker class that extracts this premium by passively providing liquidity.
When the subject is dull and quantifiable (such as finance), the market is efficient. However, when the subject allows hope to intervene (such as sports or entertainment), the market becomes a mechanism that transfers wealth from optimists to actuaries.