


Original | Odaily Planet Daily (@OdailyChina)
Author | Wenser (@wenser 2010)

After an eight-day winning streak on the daily chart, BTC has reversed course, declining steadily from $76,000 and currently trading at $69,200. Traditional industry benchmarks for identifying buying opportunities—such as Ahr999 (also known as the “Nine Gods Index”), weekly RSI, STH-SOPR (short-term holder average purchase price), LTH (long-term holder average purchase price), and MVRV Z-Score (market value to realized value ratio)—have shown inconsistent reliability: many indicators remain at low levels while the market continues to fall, while others appear elevated even as the market occasionally surges sharply.
Given this, we will present four representative bottom-finding indicators from the industry, and combine them with data and real-life “implicit indicators” to construct a new “bottom-finding indicator,” aiming to explore BTC’s downside potential. The following content is for educational and informational purposes only and does not constitute investment advice. All investment risks are borne by the investor. Please DYOR.
4 Classic Indicators to Identify BTC Buying Opportunities: The Best Time Has Not Yet Arrived; BTC May Fall Below $60K
From its peak of $126,000 in October last year to its current oscillation around $70,000, BTC’s price has ridden a rollercoaster in just a few months. In such a volatile crypto market environment, many industry indicators have lost their relevance, including but not limited to the dynamically adjusted miner shutdown price, the Fear & Greed Index, Google search trend data, and rainbow charts based on BTC’s early adoption phase.
The reason is simple: due to inflows into BTC spot ETFs, the growing number of U.S. publicly traded companies holding BTC, and the U.S. regulatory authorities creating a more favorable environment, the valuation framework for BTC has undergone a structural shift. Institutional holdings, derivatives arbitrage, exchange internal settlements, U.S. macroeconomic monetary policy, and global geopolitics now carry significantly greater weight in influencing BTC’s price. In other words, on-chain metrics and profit-and-loss data can no longer serve as direct indicators—they can only be used as reference points.
Here, we present and analyze the data using industry metrics that still hold some relevance, which may more clearly illustrate the current obsolescence of the old metrics.
Metric One: MVRV Z-Score, collective misalignment of the value system
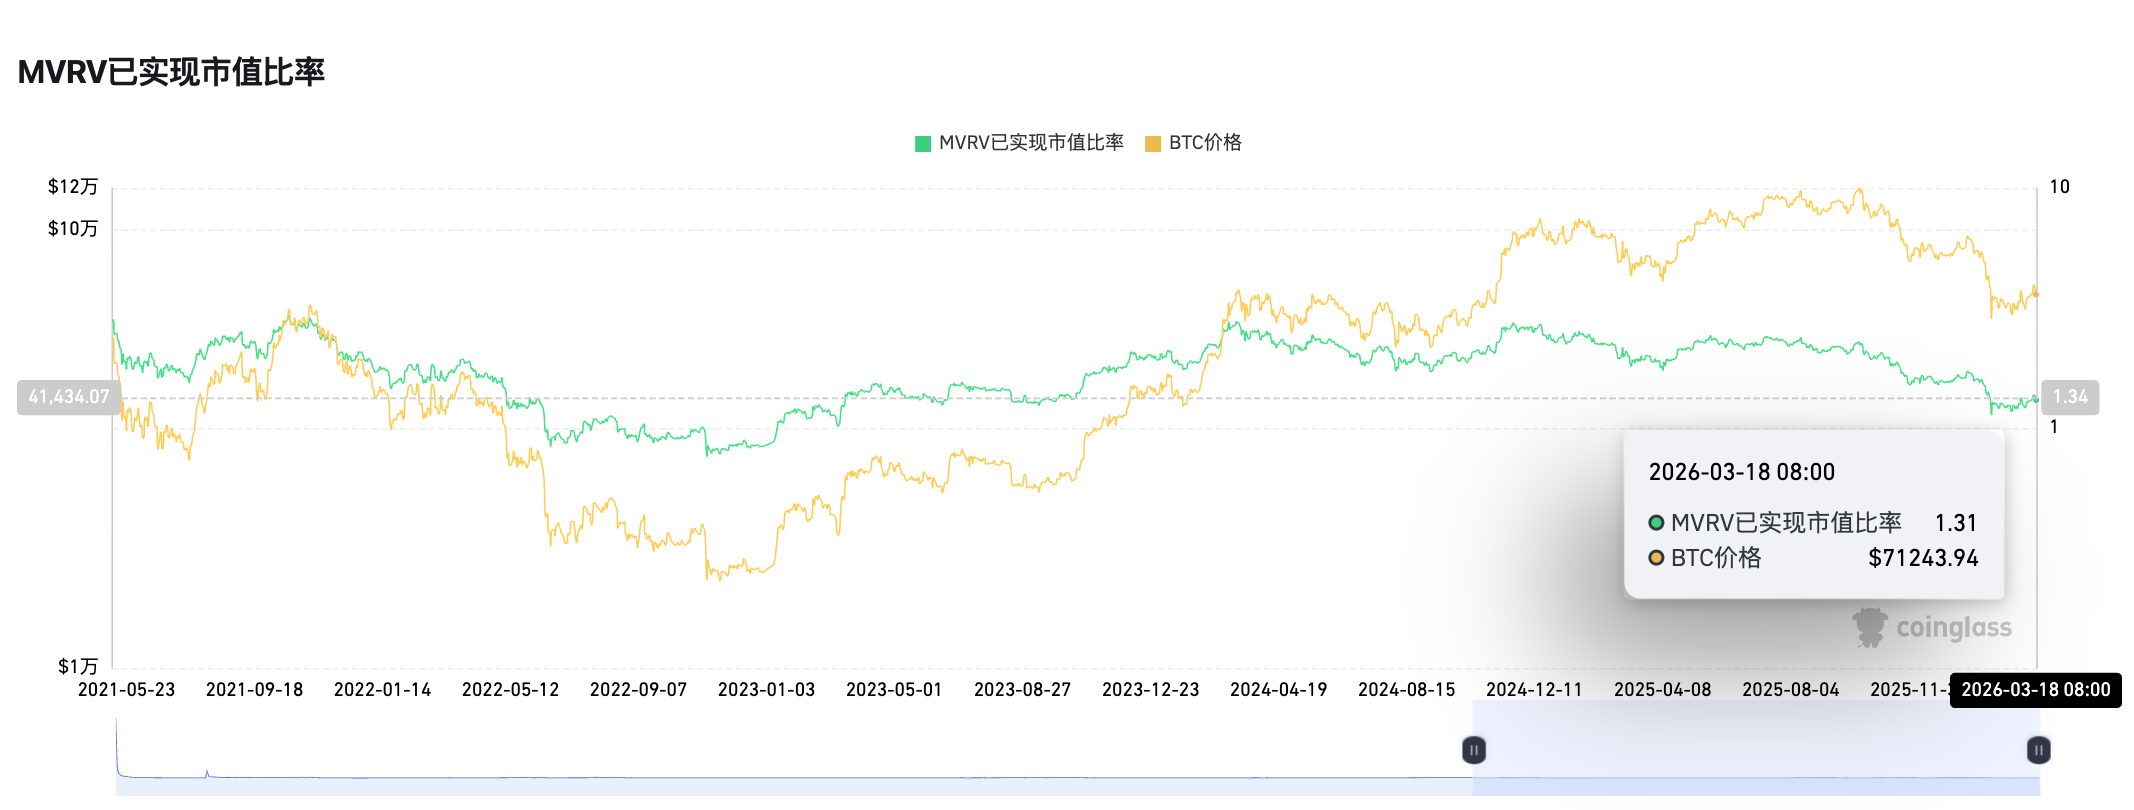
Figure 1
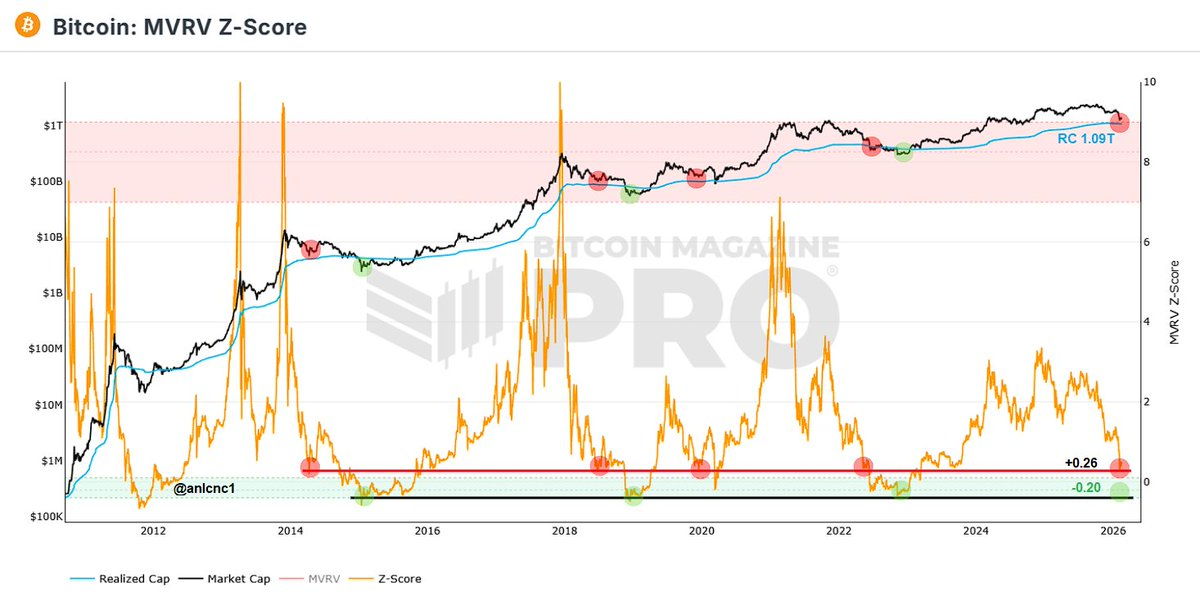
Figure 2
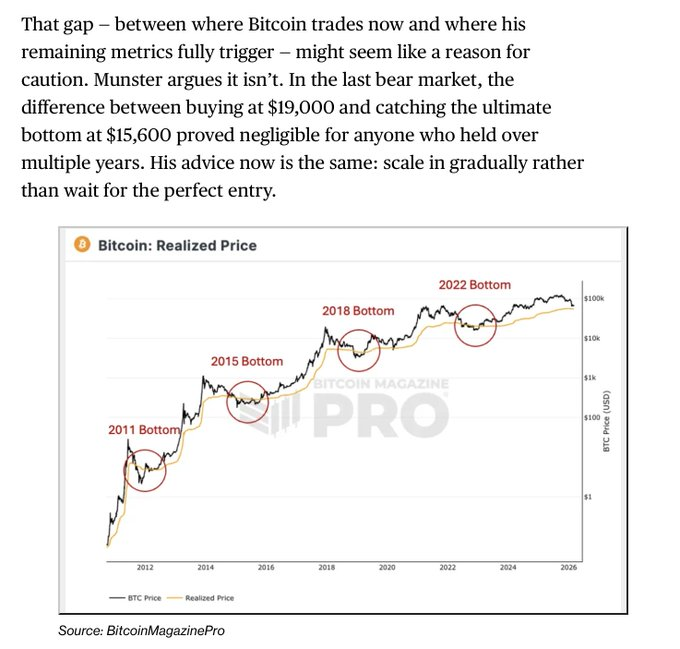
Figure 3
As of March 18, the MRVR indicator stands at 1.31; previously, in February, crypto researcher anıl noted, “When the MVRV Z-Score falls below 0, especially below -0.20, Bitcoin is at its price low. In this cycle, Bitcoin reached a minimum of +0.26, meaning the classic ‘green zone’ has not yet been tested.” (Figure 2 above) On March 14, Bitcoin News reported that the MVRV Z-Score had dropped to approximately 0.38, a level previously associated with undervaluation. Other key support levels include the realized price near $54,000 and the 200-week moving average near $58,000. Bloomberg noted that the potential bottom range lies between $45,000 and $55,000, but sustained recovery requires new demand support. (Figure 3 above)
Reason for invalidation: The large holdings by ETF custodians and DAT companies have systematically inflated the realized value (RV), causing the denominator of the Z-Score (standard deviation) to increase significantly, making historical "extreme negative values" extremely difficult to replicate under the current structure.
Indicator 2: Ahr999 Index (Nine Gods Index) — the bottoming zone below 0.45 has persisted for nearly 50 days.
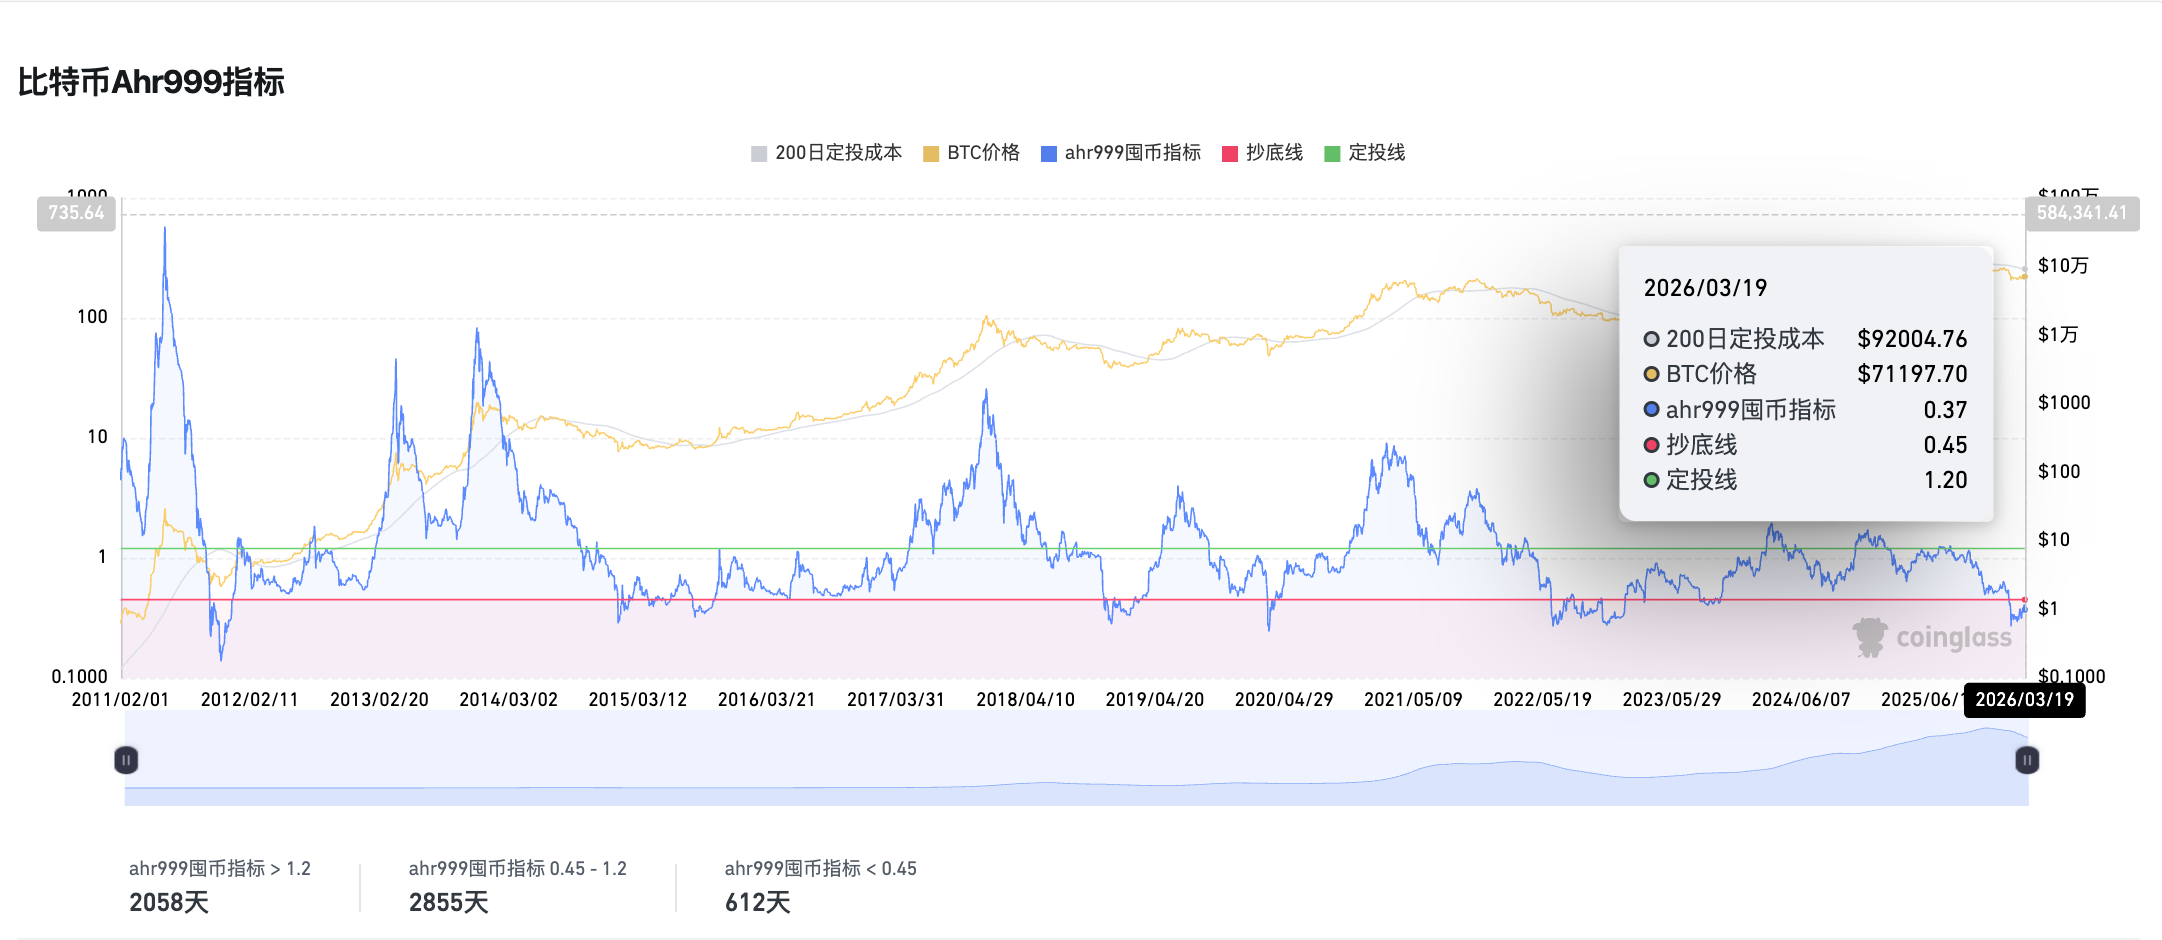
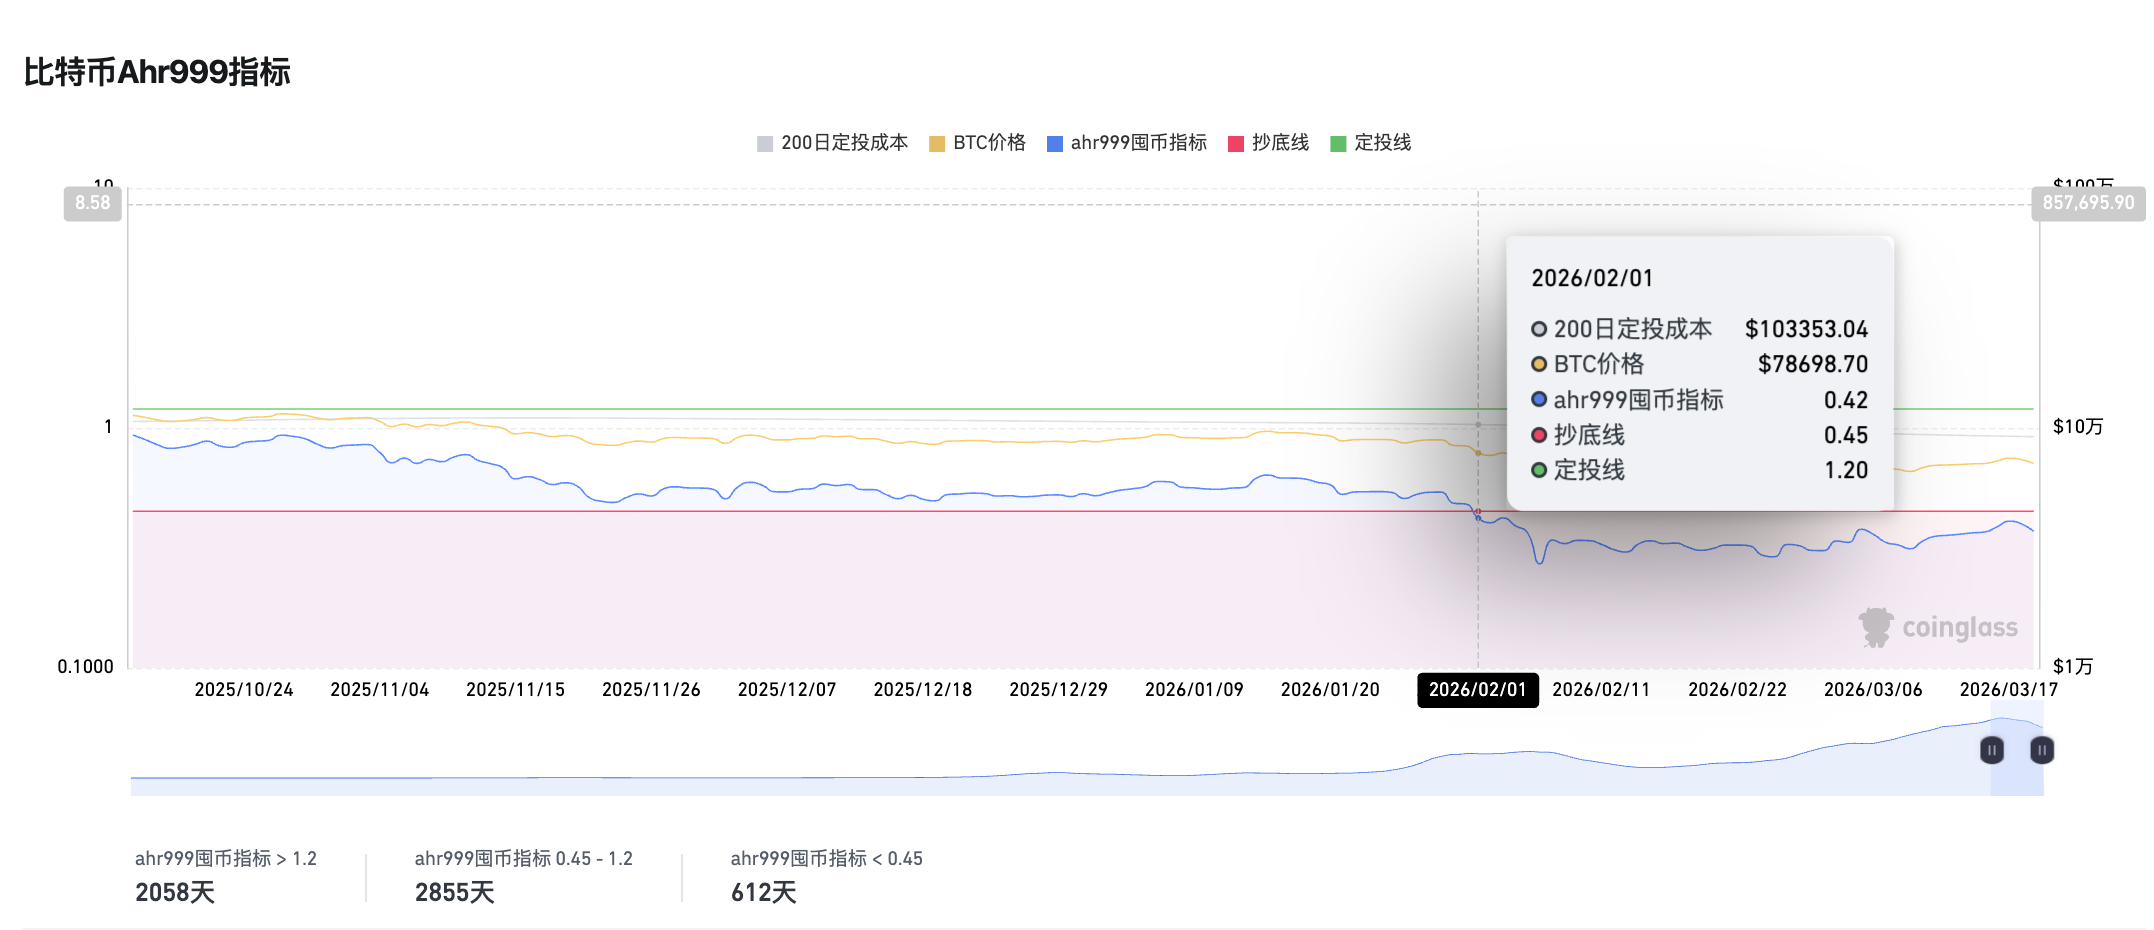
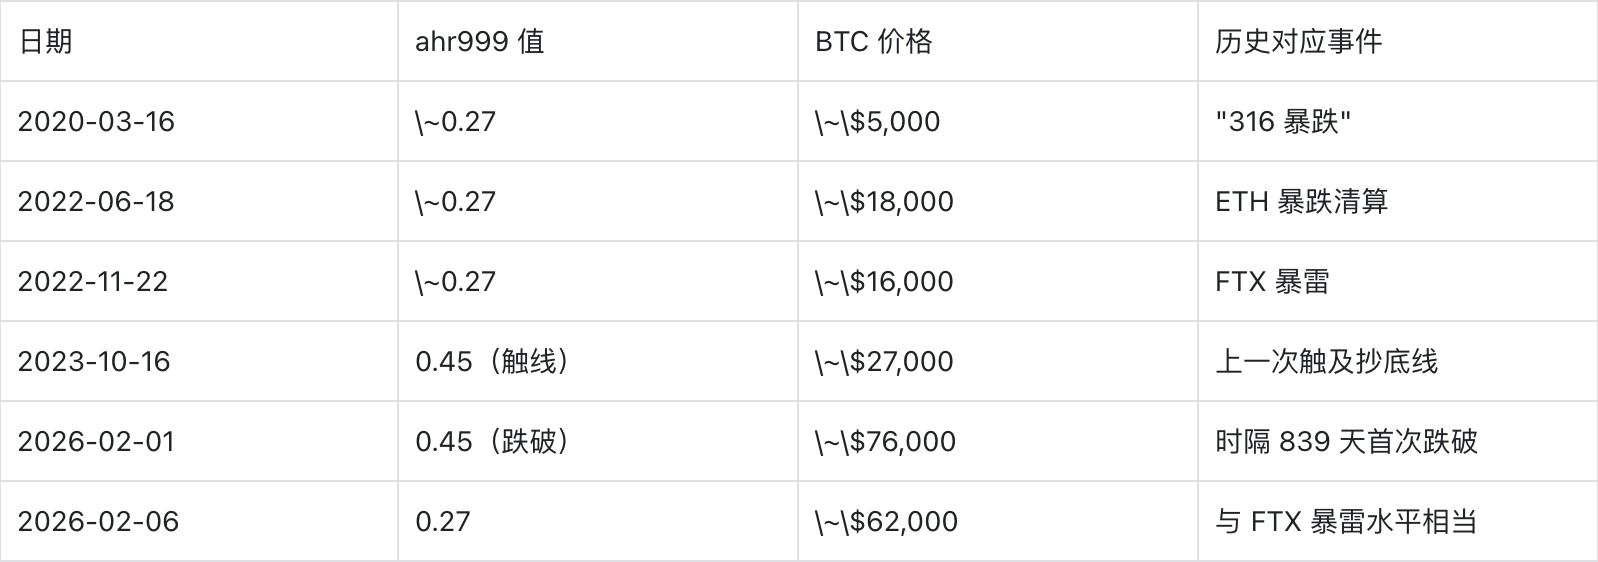
Since February 1, the Ahr999 indicator has remained below 0.45 for nearly 50 consecutive days, whereas historically this indicator has been below 0.45 for only 612 days, accounting for approximately 11% of the total. On March 19, the Ahr999 accumulation indicator stood at 0.37, indicating that the market is still in a buying zone, but it offers limited long-term guidance.
Reason for expiration: Since the major market crash on October 11 last year, the market has remained severely oversold, compounded by Trump’s unpredictable policies, weaker-than-expected Fed rate cuts, and international geopolitical turbulence. As a result, BTC’s safe-haven appeal has significantly diminished; even after breaking below the $76,000 cost line of Strategy, the largest BTC DAT-listed company, it continues to await further liquidity recovery, and this metric has gradually become a comfort index for “long-term value investors.”
Indicator 3: SOPR and STH-SOPR remain consistently below 1, while LTH-SOPR stays steadily between 0.75 and 1.
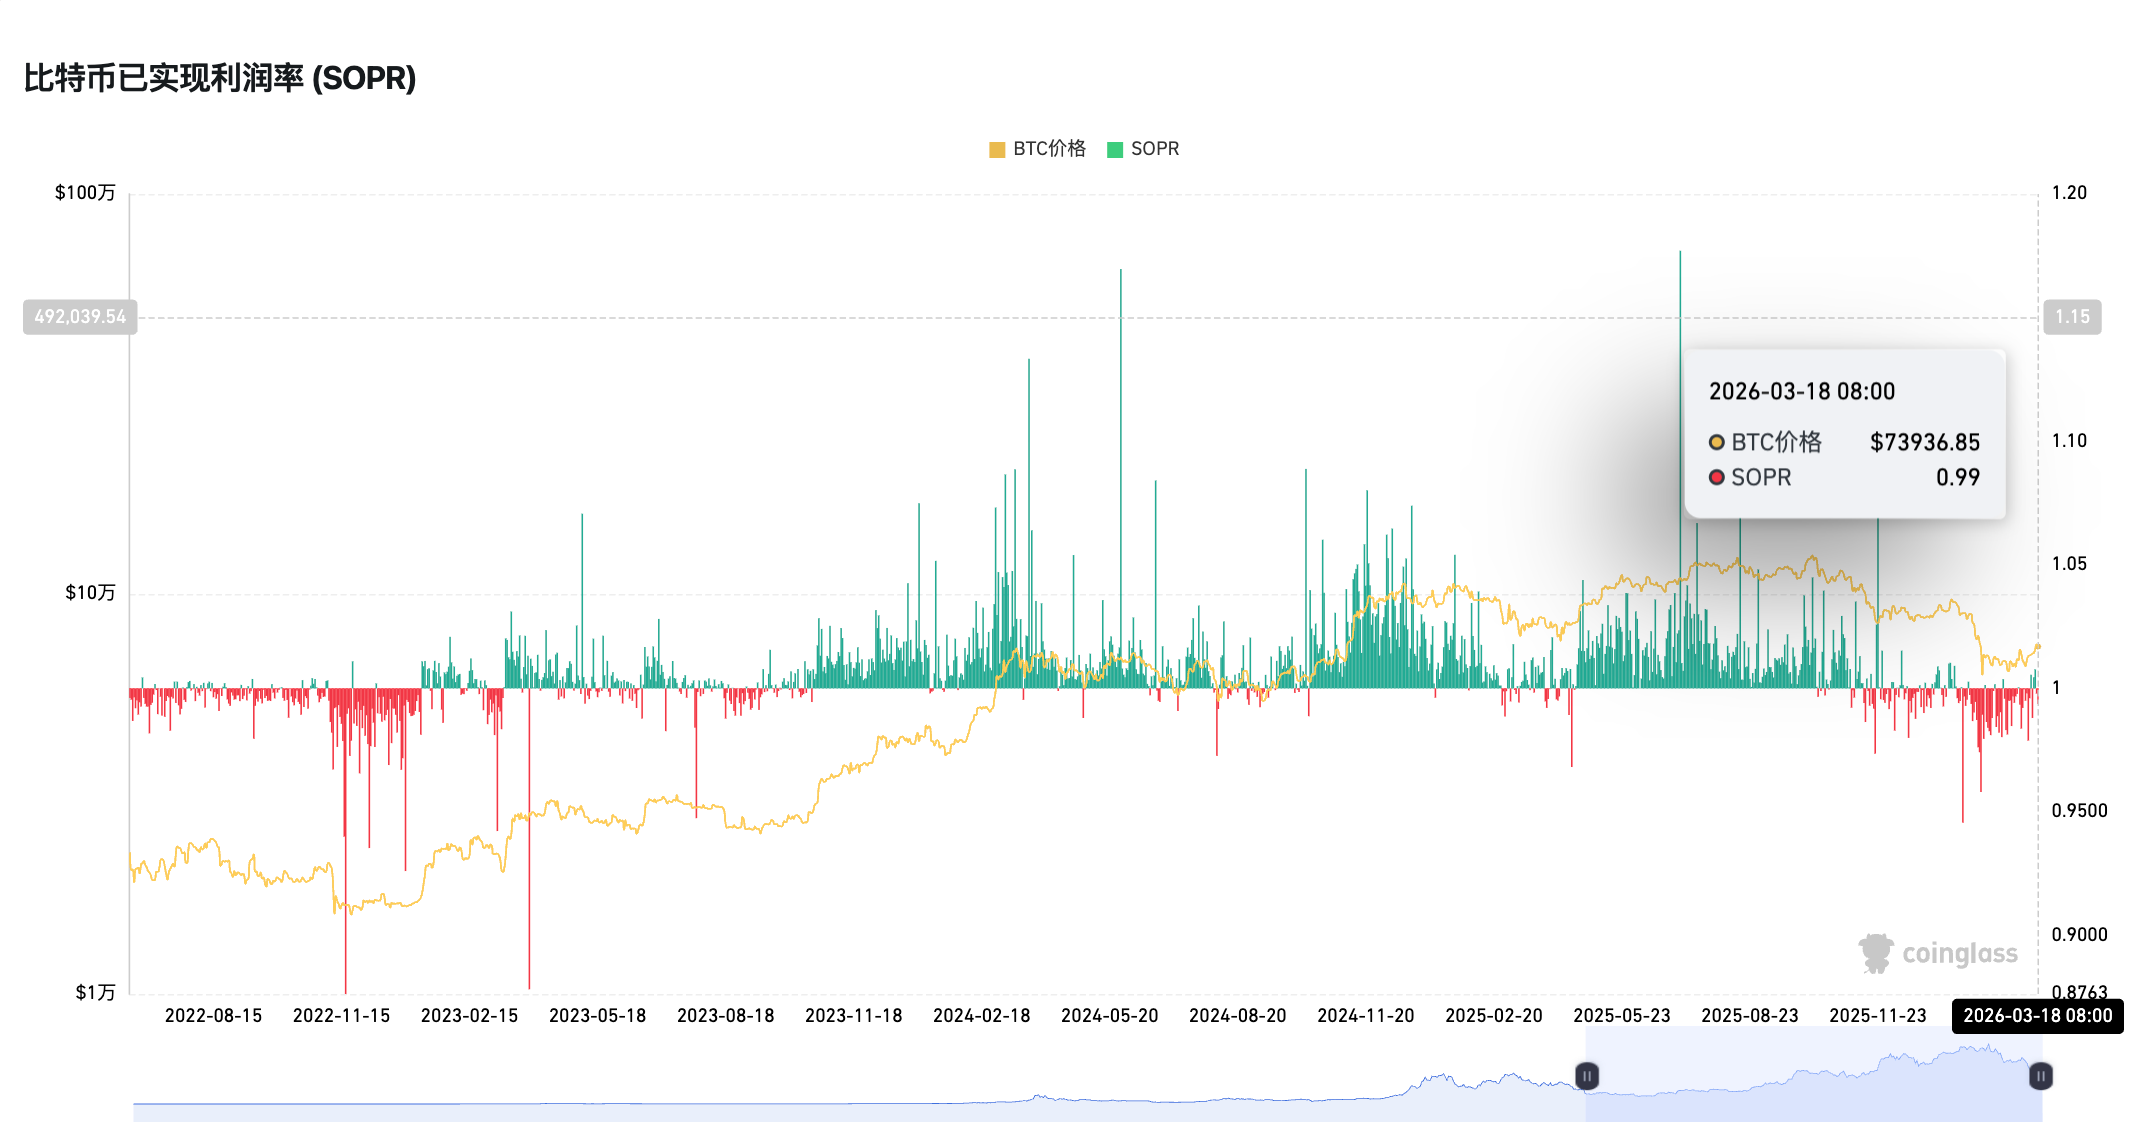
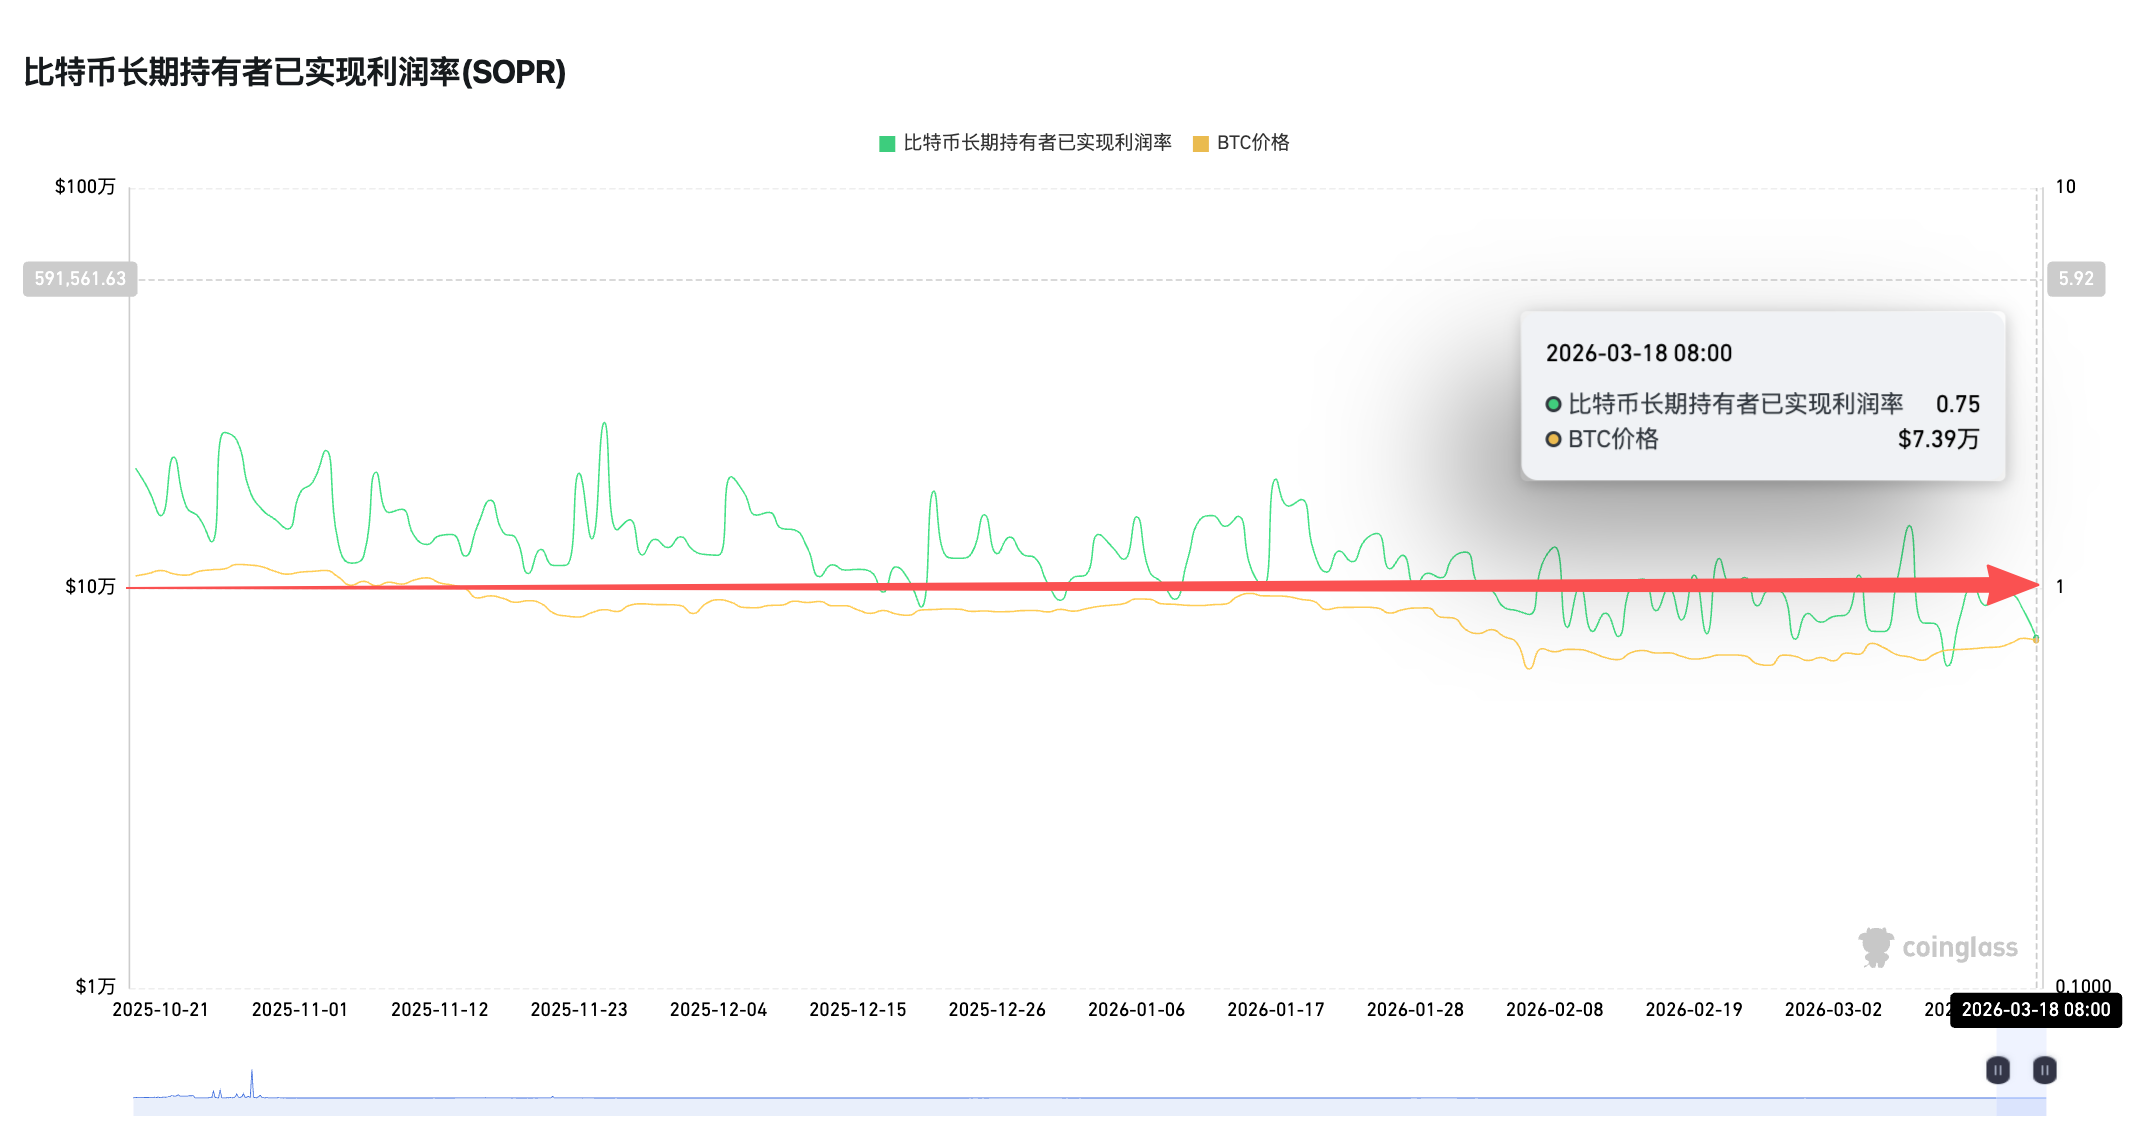
SOPR (Spent Output Profit Ratio) is commonly used to measure the average profit or loss of on-chain moved coins, with LTH-SOPR focusing on long-term holders who have held their coins for more than 155 days. When LTH-SOPR falls below 1, it typically indicates that long-term holders are beginning to sell at a loss, historically corresponding to the depths of a bear market bottom.
In February, Bitfinex released an analysis report noting that on-chain metrics showed the adjusted SOPR (Spent Output Profit Ratio) had fallen to the range of 0.92–0.94, indicating that most coins were being transferred at a loss, with structural pressure still present.
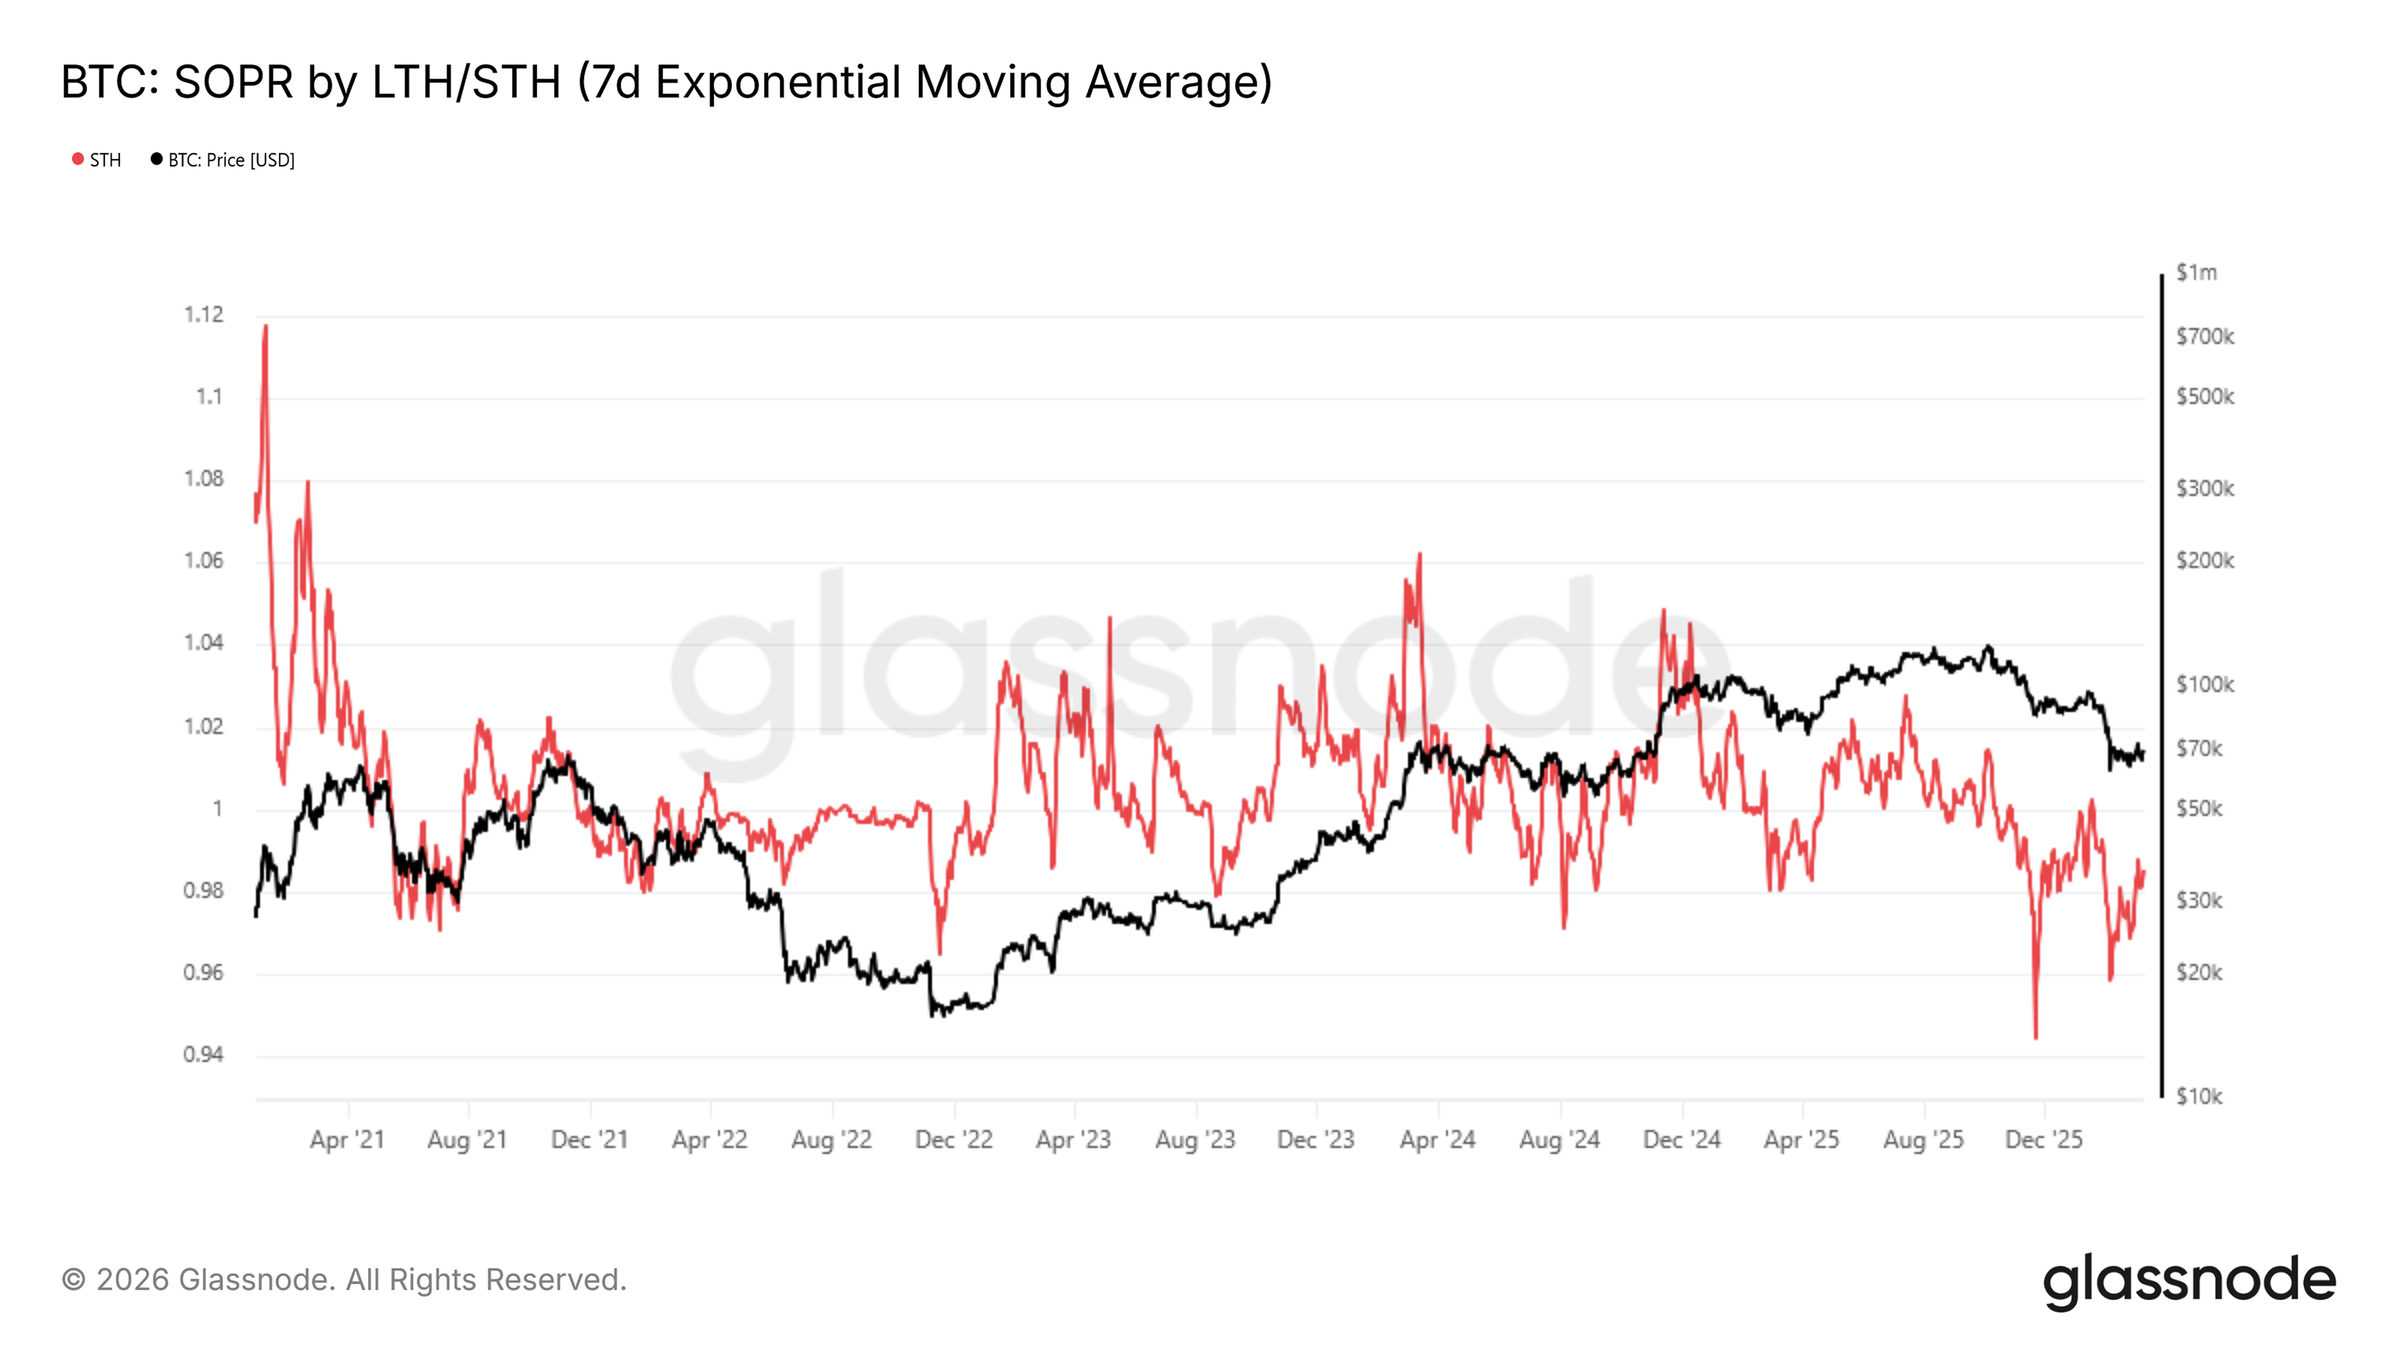
On March 14, Glassnode’s weekly report also noted that the 7-day moving average of STH-SOPR stood at 0.985, remaining below 1 for longer than at any point since October 2025—a classic hallmark of a bear market regime. This is a defining characteristic of a bear market cycle. Meanwhile, net position changes among LTHs show that long-term holders are still reducing their positions, but at a significantly slower pace, shifting from the aggressive distribution seen in Q3/Q4 2025 to a more moderate profit-taking pattern.
Failure signal: A decline without old coins surrendering does not constitute a traditional cycle bottom. STH-SOPR remaining below 1 confirms a bear market, but the turning point of LTH-SOPR is the true leading indicator of the bottom.
Indicator 4: The Bitcoin Mayer Multiple has been below 0.8 for nearly 50 days.
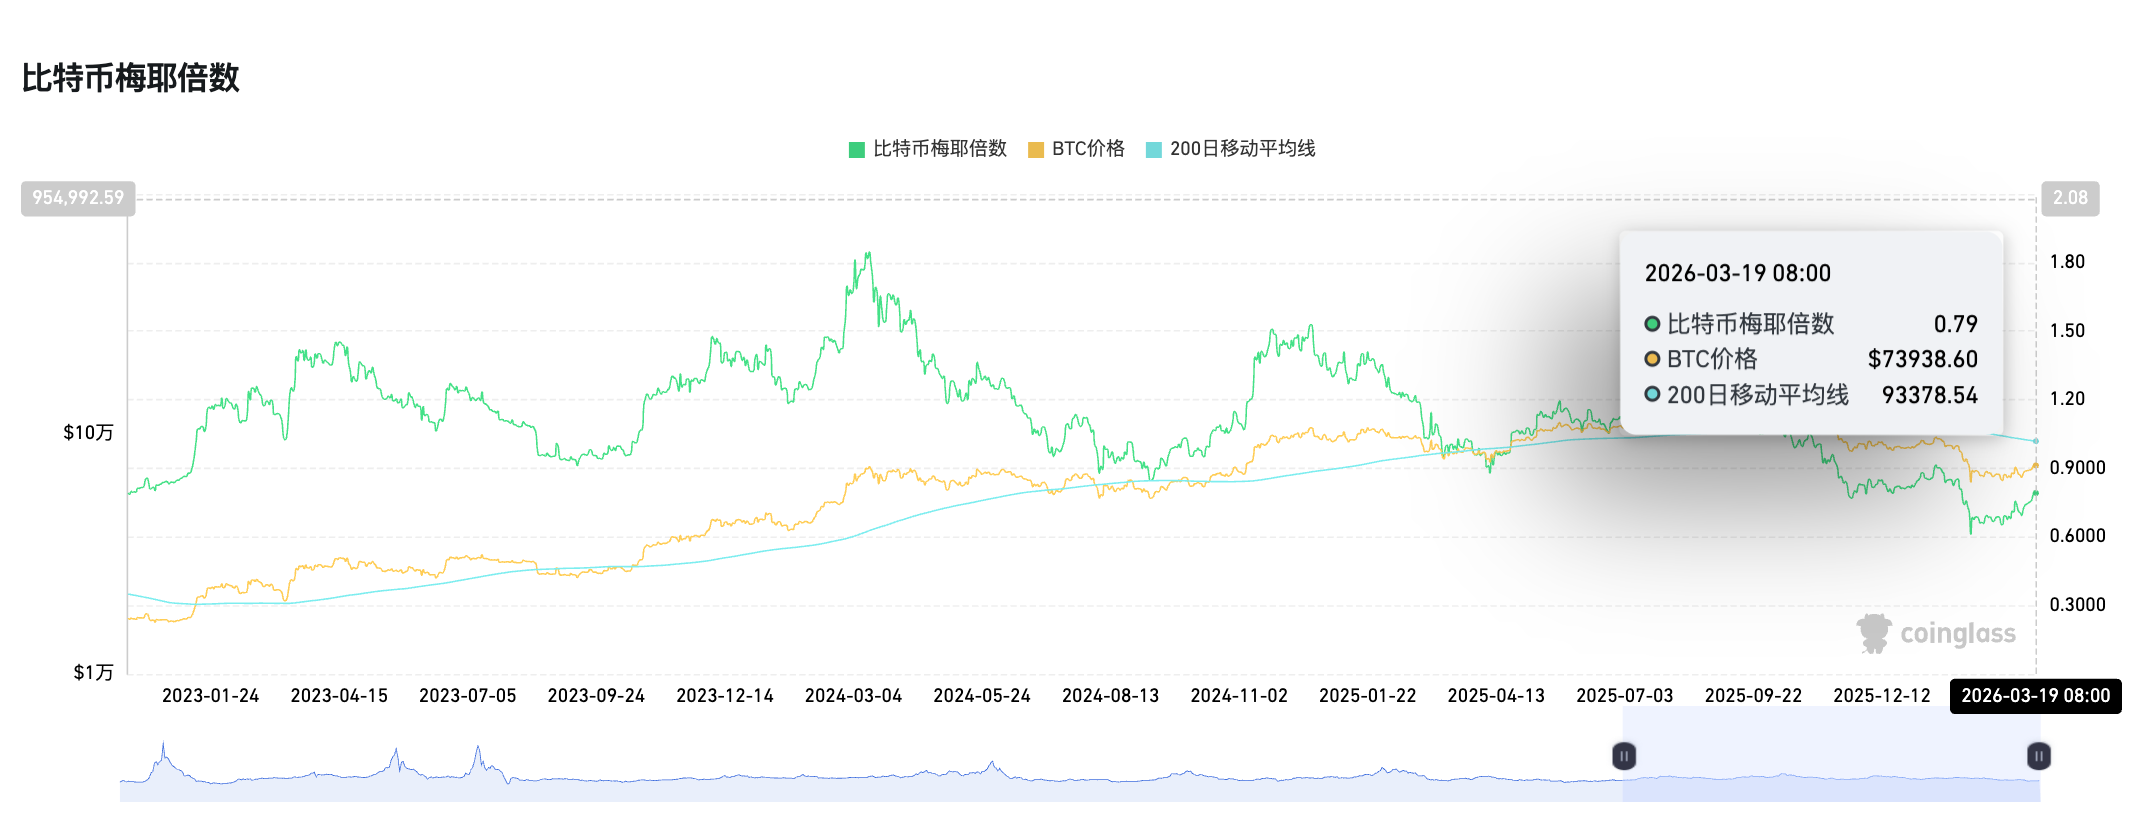
As an industry indicator derived solely from the comparison of BTC's current price to its 200-day moving average, the BTC Mayer Multiple, similar to the Nine Eleven Index, has remained below 0.8 for nearly 50 days. Historically, values below 0.8 have typically indicated a historically undervalued price range. Therefore, despite this indicator being based solely on a simple price moving average and not relying on on-chain transaction data, and being relatively less affected by institutionalization, it remains difficult to serve as a consistent buy-the-dip signal.
Three key indicators may reveal the bear market bottoming zone: CVDD floor, NUPL negative, and stablecoin inflows to exchanges
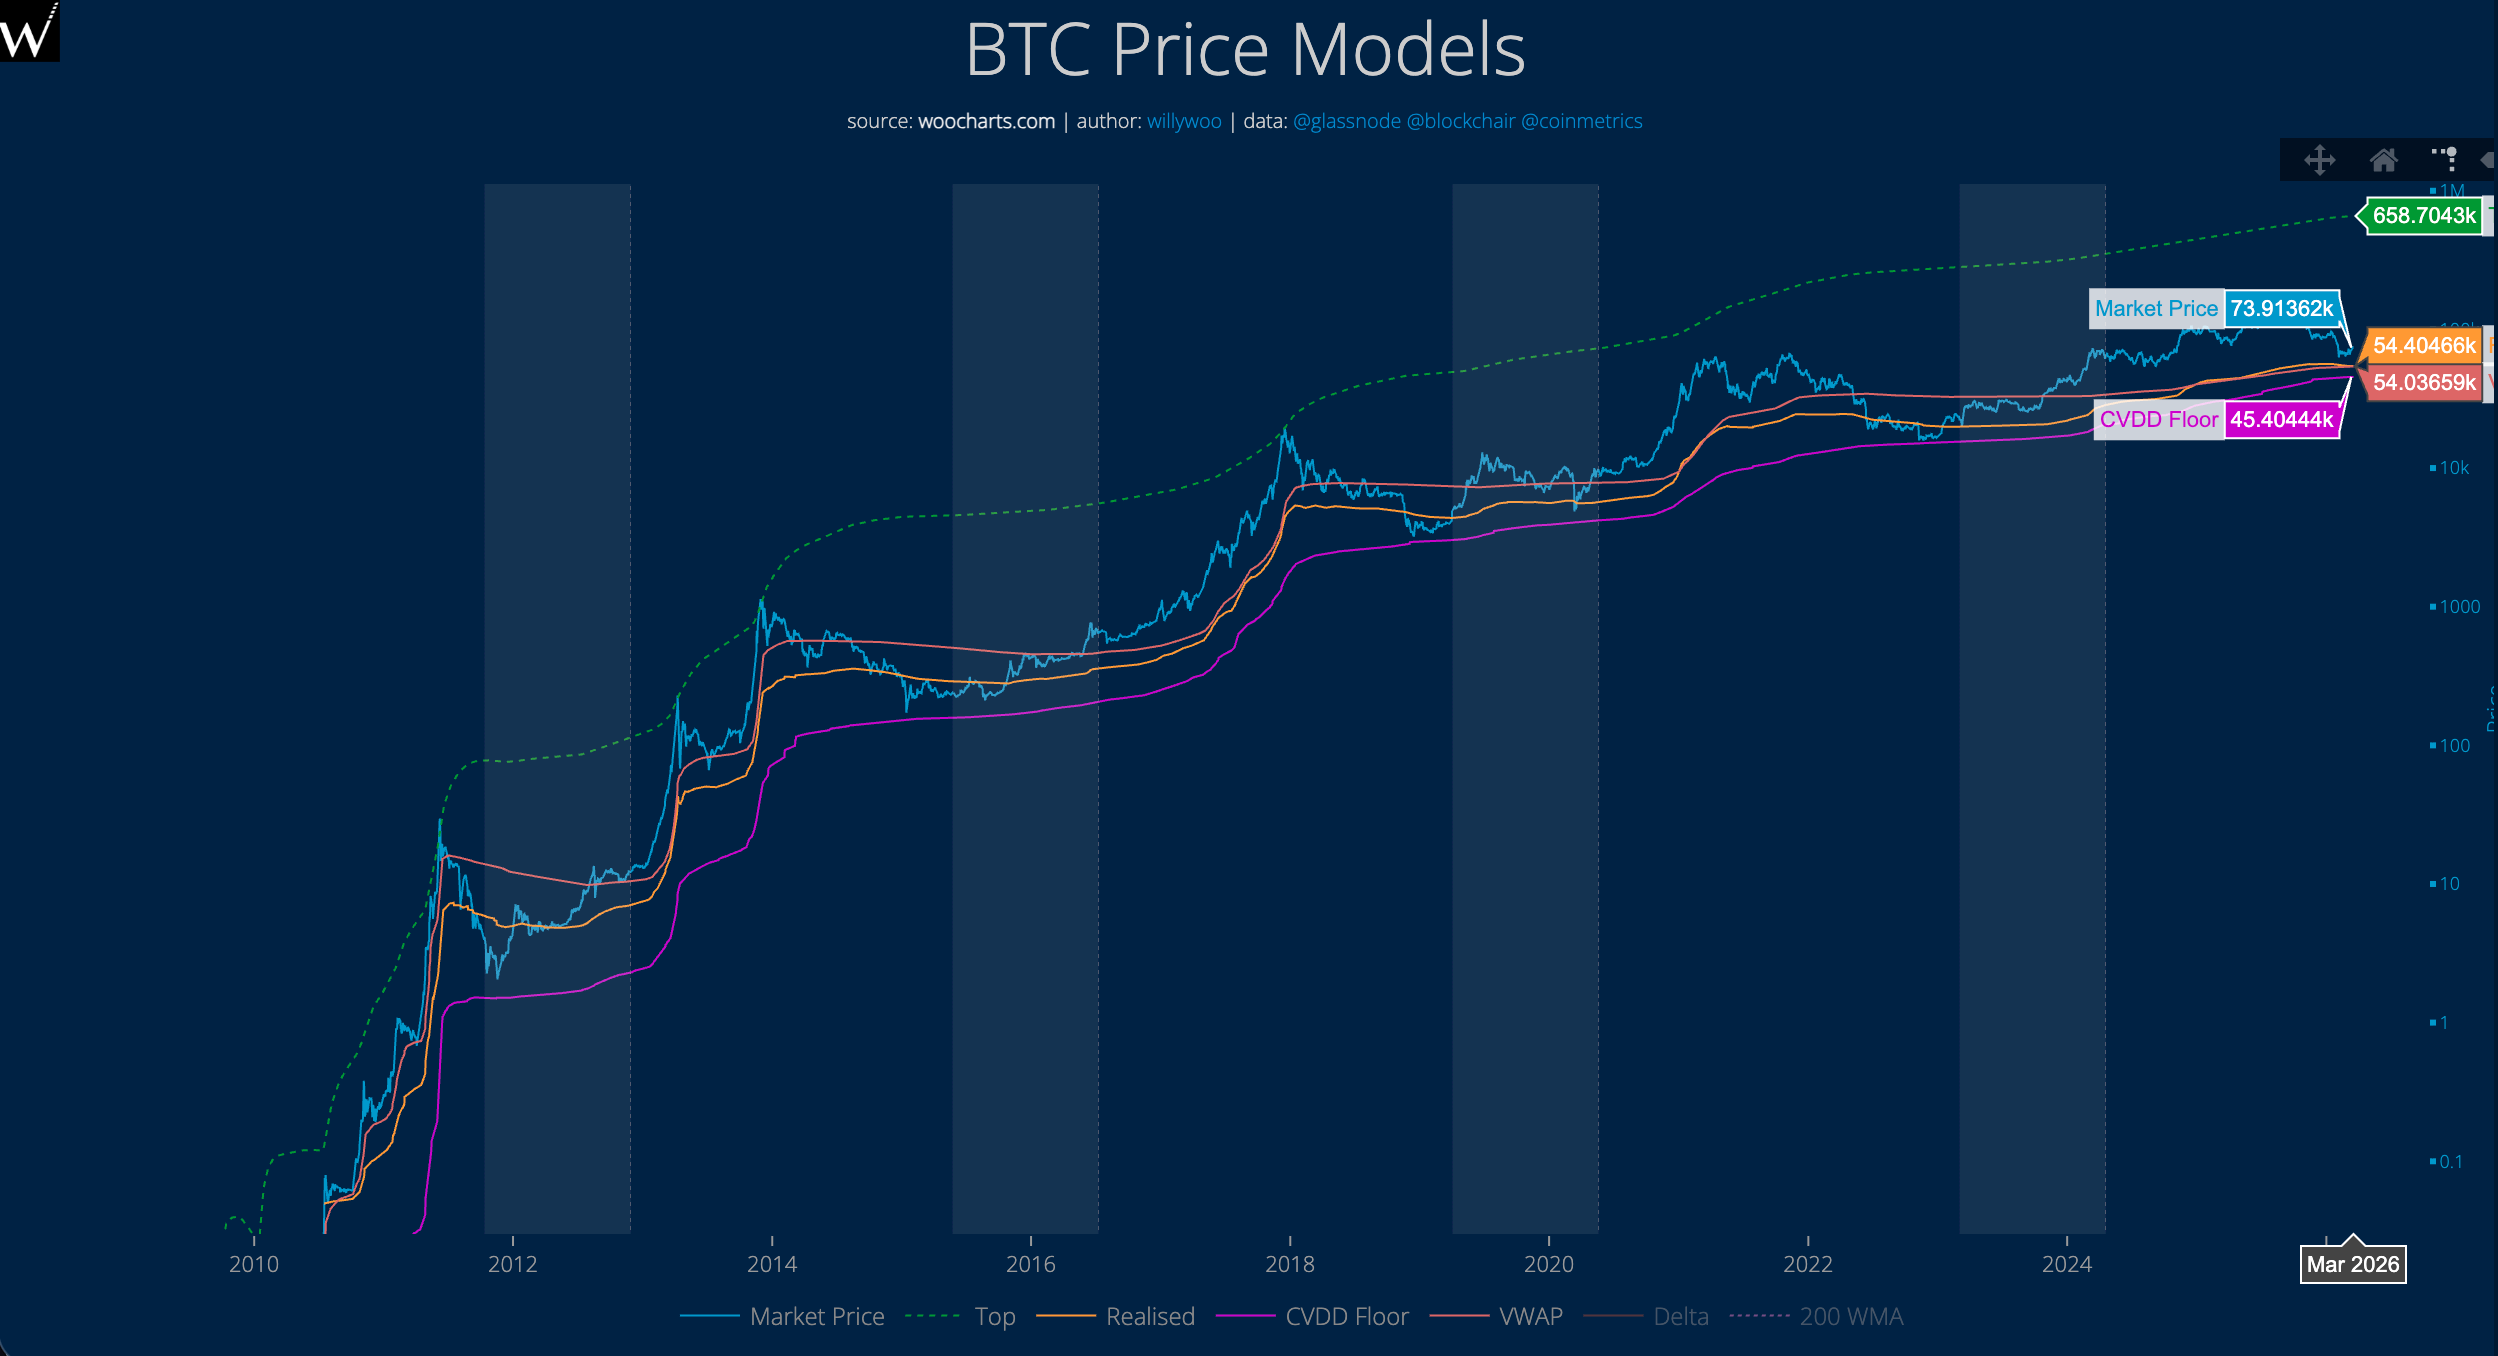
CVDD (Cumulative Value Days Destroyed): An analyst's personal iron bottom model
This indicator was developed by crypto analyst Willy Woo to track the accumulated holding weight of BTC across different price ranges, forming a "historical iron bottom" curve.
Notably, this curve approached the BTC market price twice—in December 2018 and November 2022—but has never fallen below it to date.
Currently, the CVDD model indicates that the current BTC iron bottom is around $45,000.
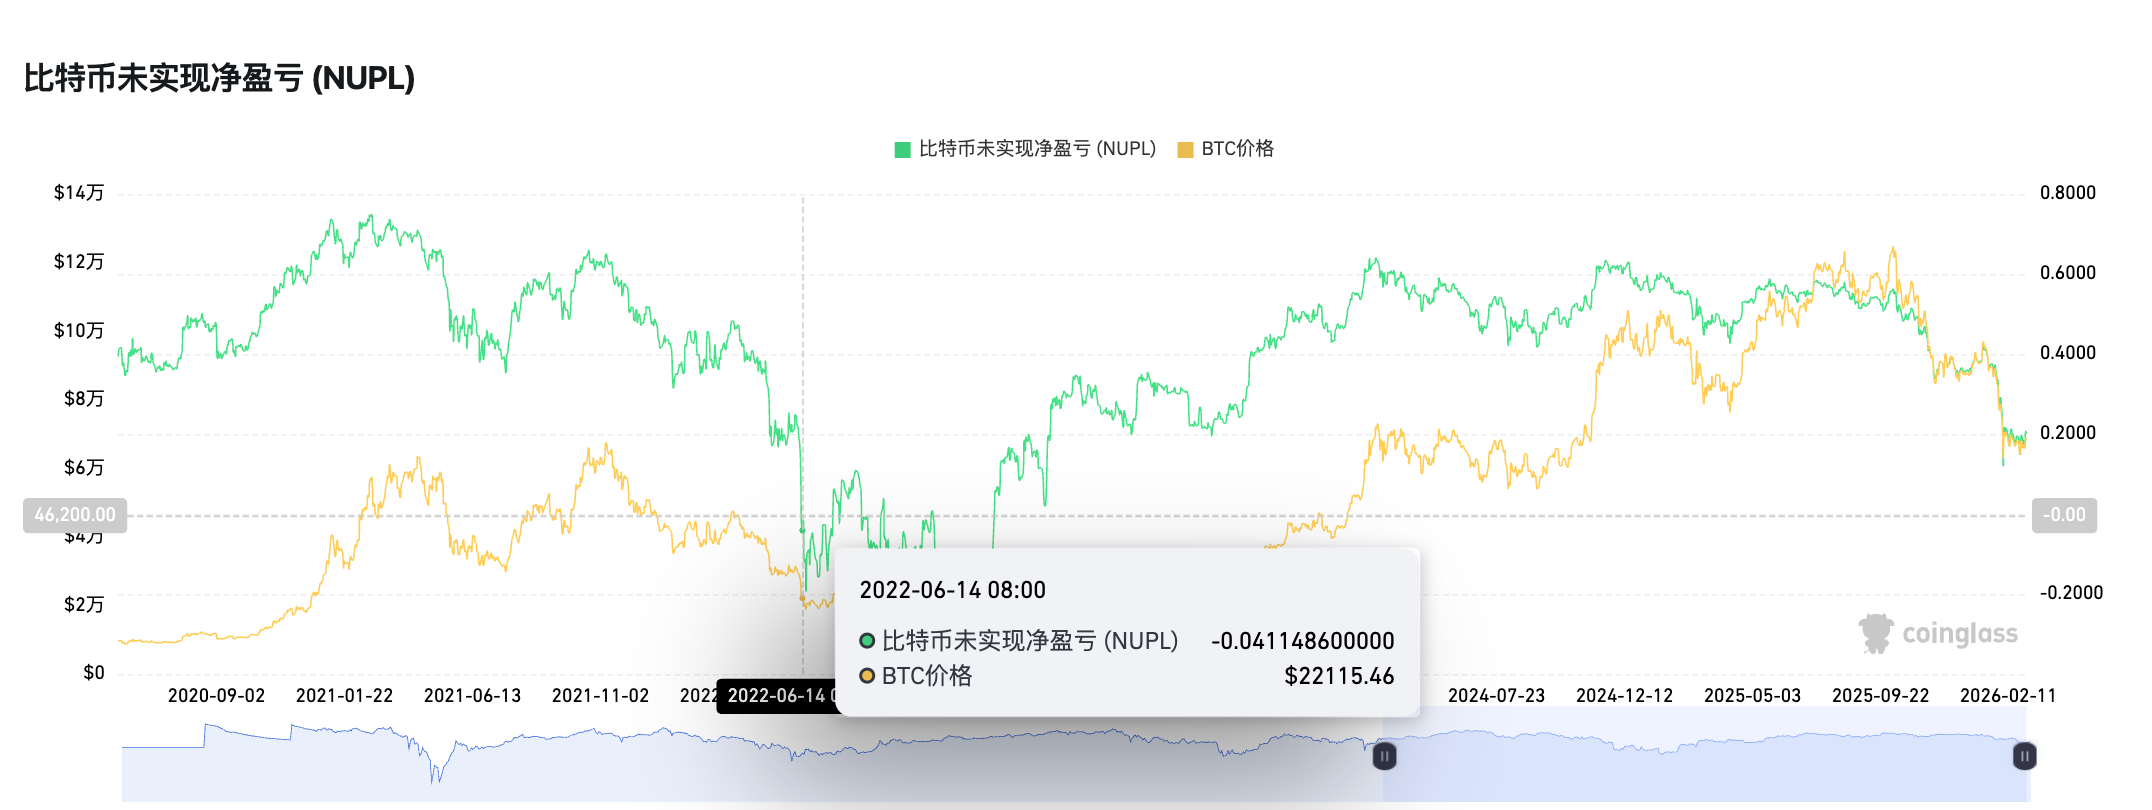
NUPL (Net Unrealized Profit/Loss): Net Unrealized Profit/Loss for BTC across the entire network
This indicator is primarily used to measure the net unrealized profit and loss across the network, with the following general criteria:
High NUPL (>50%): Greed-driven peak; ideal time for profit-taking.
Low NUPL (<0%): Fear or capitulation; potential bottom.
It is worth noting that the NUPL indicator last turned negative between June 2022 and January 2023.
Currently, the NUPL indicator remains around 0.2.
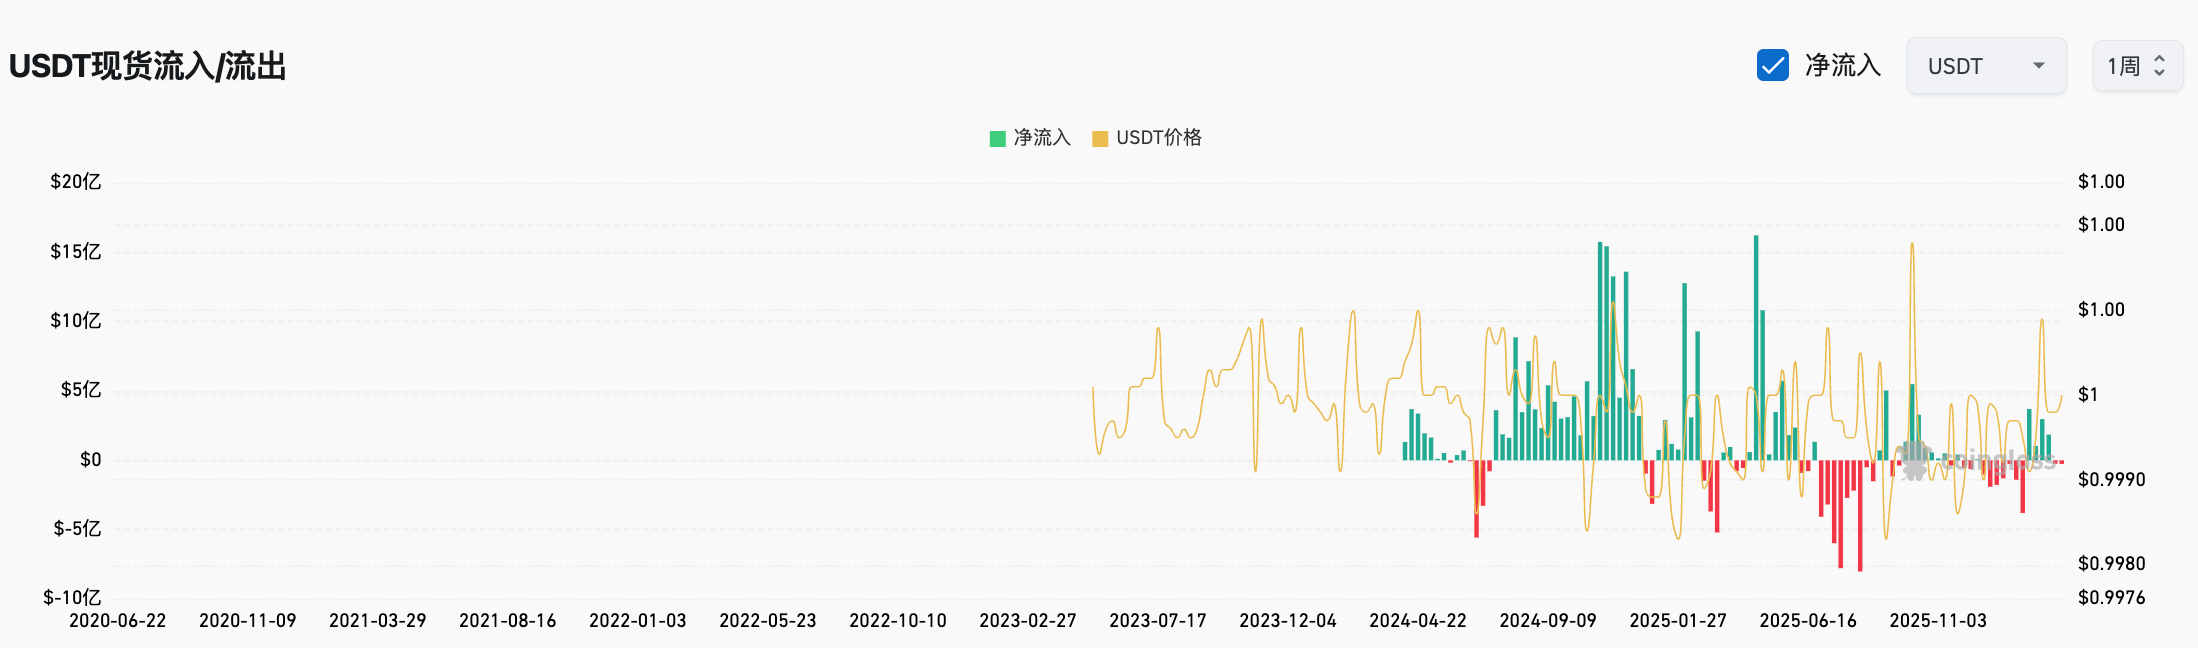
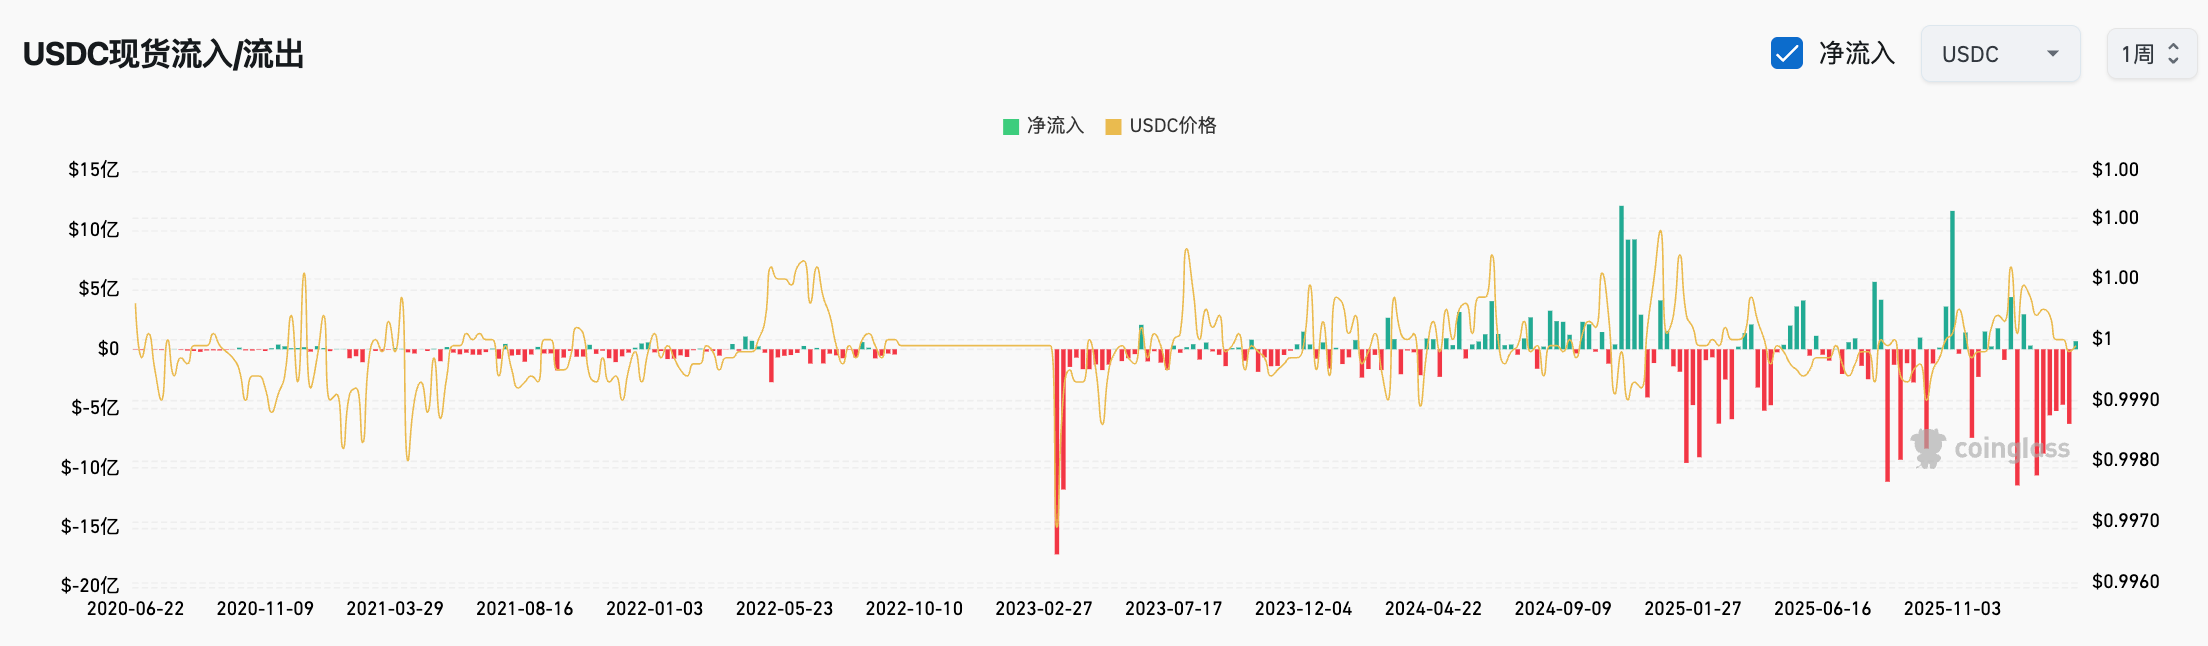
Stablecoin Exchange Netflow: Net inflow to stablecoin exchanges
This indicator is primarily used to determine whether stablecoins are flowing back into exchanges, serving as an early signal of impending market buying pressure. Historically, a sustained increase in net stablecoin inflows has often preceded actual BTC price rebounds by 2–4 weeks.
The logic behind this indicator is that without stablecoin inflows driving the price rebound, it is merely a leveraged, technical bounce with very low sustainability.
Currently, USDT and USDC, which together hold about 80% of the stablecoin market, continue to experience outflows, with significant distance remaining to reach BTC’s bottom.
Conclusion: Buy when no one is paying attention, sell when everyone is excited.
Finally, we must emphasize that the indicators mentioned above are for reference only; specific trading and investment strategies vary depending on each individual’s or institution’s risk tolerance, capital size, and holding period.
However, compared to bottom-fishing indicators, perhaps the top-selling indicators in the crypto industry are more flexible—just like gold and silver, which recently surged to the point of attracting everyone’s attention, when discussions about BTC begin spreading around you—whether it’s the grocery-shopping auntie on the subway or your barber Tony—when they all start asking you about investing in BTC, crypto, or cryptocurrencies, selling promptly may be the only best choice.
We all hope to one day witness the beginning of a "great withdrawal of our own."