What is RSI divergence in crypto?
In the fast-paced and often volatile world of digital assets, price trends can move with deceptive velocity. For a trader, the ultimate challenge isn't just following the trend, but knowing when that trend is running out of steam. RSI Divergence is a powerful technical signal used to detect these "invisible" shifts in momentum before they manifest as a full price reversal on the chart.
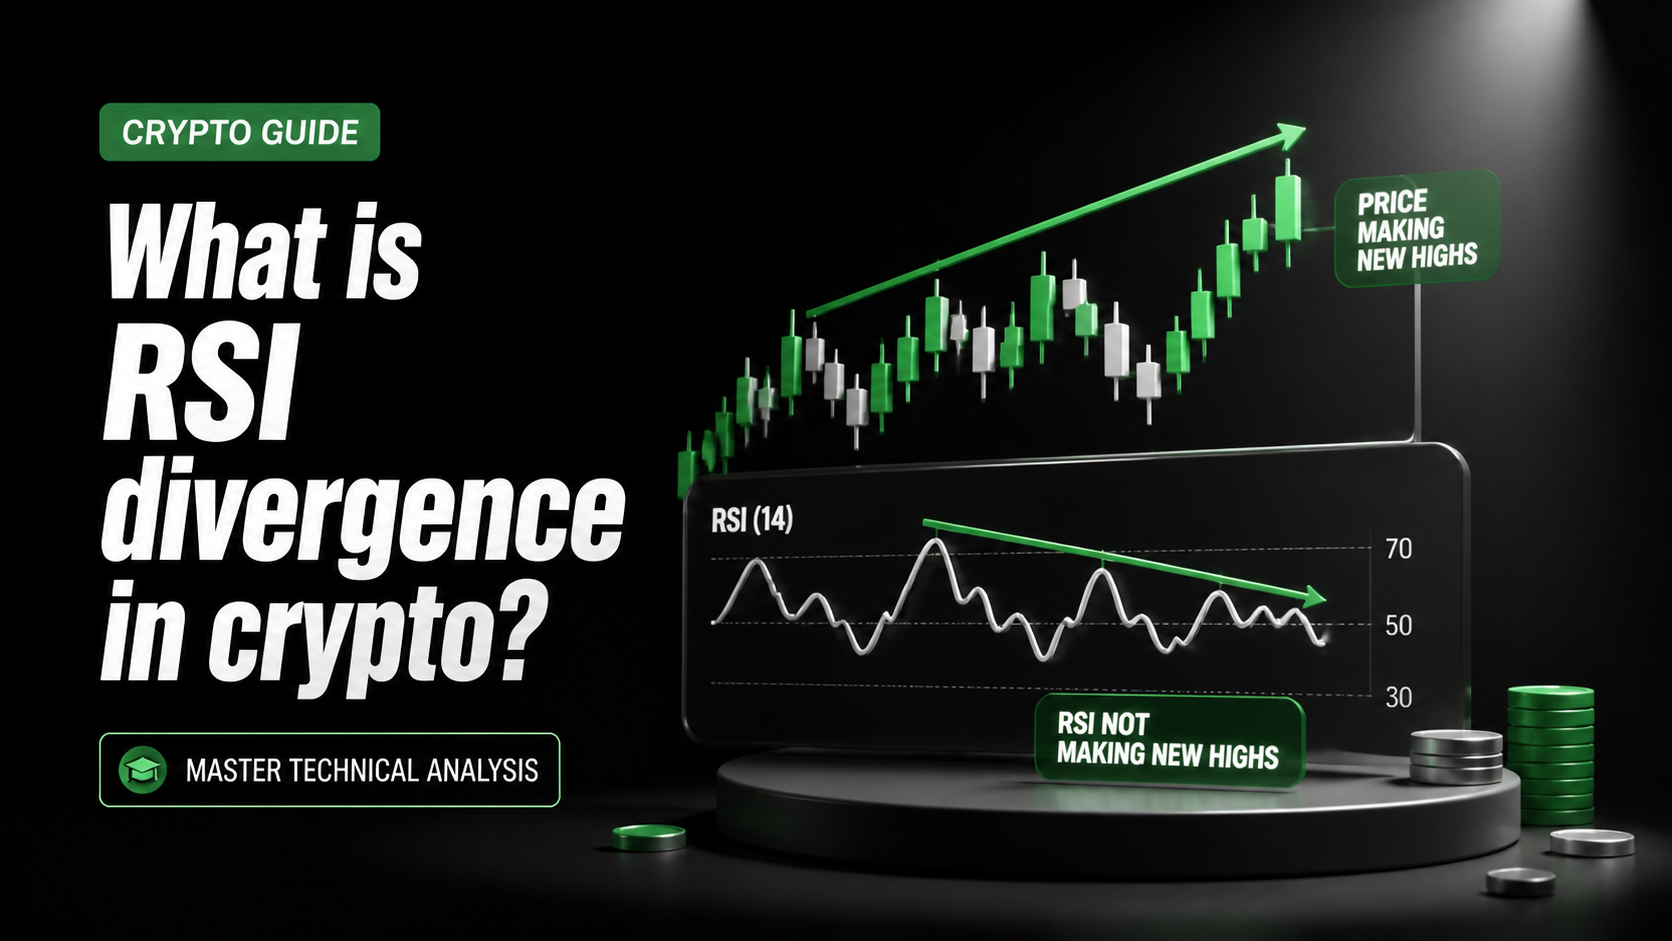
Understanding what RSI divergence is in crypto allows you to look behind the curtain of raw price action. It highlights a fundamental disagreement between what the price is doing and what the underlying momentum is measured by the Relative Strength Index (RSI)—suggests.
Key Takeaways
-
Momentum Mismatch: RSI Divergence occurs when the price of a crypto asset moves in the opposite direction of the Relative Strength Index, signaling a "disagreement" between price and momentum.
-
Reversal vs. Continuation: Regular Divergence typically warns of a potential trend reversal, while Hidden Divergence suggests the current trend is likely to continue after a brief pause.
-
Bullish vs. Bearish: A Bullish Divergence (Higher Lows on RSI while Price makes Lower Lows) hints at a price floor, whereas a Bearish Divergence (Lower Highs on RSI while Price makes Higher Highs) suggests a potential peak.
-
Confirmation is Key: Because RSI is a lagging indicator, traders often wait for a secondary signal—like a trendline break or a volume spike—before executing a trade based on a divergence.
What is RSI Divergence?
RSI Divergence occurs when the direction of an asset's price and the direction of its RSI indicator move in opposite ways. Under normal market conditions, the RSI follows the price: when the price makes a higher high, the RSI should also reach a higher peak. When they "diverge," it signals a mismatch between price action and momentum, often hinting that a trend change or pause is imminent.
The Relative Strength Index (RSI) is a momentum oscillator that scales from 0 to 100. It compares the average gains and losses over a specific period (typically 14 candles) to determine if an asset is overbought or oversold. To track these momentum shifts across hundreds of trading pairs, visit the KuCoin Markets page, which offers professional-grade charting tools.
How it Works?
Divergence is categorized into two main types: Regular (Classic) and Hidden. Each provides a different insight into the market's next potential move.
Regular Divergence: The Reversal Signal
Regular divergence is primarily used to spot potential trend reversals.
-
Regular Bullish Divergence: Occurs in a downtrend when the price makes a lower low, but the RSI forms a higher low. This suggests that selling pressure is weakening even though prices are still falling.
-
Regular Bearish Divergence: Occurs in an uptrend when the price makes a higher high, but the RSI makes a lower high. This indicates that buying momentum is fading, signaling a potential downward correction.
Hidden Divergence: The Continuation Signal
Hidden divergence suggests that the prevailing trend is likely to continue after a brief consolidation.
-
Hidden Bullish Divergence: Found in uptrends where the price makes a higher low, but the RSI makes a lower low. This acts as a subtle cue that the bulls are still in control despite a temporary pullback.
-
Hidden Bearish Divergence: Found in downtrends where the price makes a lower high, but the RSI makes a higher high. It suggests the downtrend is likely to resume after a brief relief rally.
For more technical strategies on how to combine these signals with other oscillators, the KuCoin Blog offers regular educational content for traders of all levels.
Risks and Considerations
While RSI divergence is a highly regarded tool, it is not infallible. Traders must be aware of its limitations:
-
Lagging Nature: Like all indicators based on historical data, RSI can lag. In parabolic markets, multiple divergences can form while the price continues to move aggressively in its current direction.
-
False Signals (Fakeouts): Divergences can occur in sideways markets where they lose their predictive power. Using them in a non-trending environment often leads to "whipsaws".
-
Confirmation Requirement: A divergence is a "caution signal," not a definitive "buy" or "sell" command. Professional traders always wait for price action confirmation—such as a trendline break or a candlestick reversal pattern—before entering a trade.
To stay updated on fundamental news or security upgrades that might override technical patterns, monitoring the official announcement feed is essential for risk management.
Use Cases
How do professional traders apply RSI divergence in the crypto market?
-
Exit Strategy: Many traders use regular bearish divergence to take profits on long positions, avoiding the sharp drop that often follows a momentum collapse.
-
Strategic Entry: Finding regular bullish divergence at a key support level or Fair Value Gap (FVG) provides a high-probability entry for long positions.
-
Trend Re-entry: Using hidden bullish divergence to "buy the dip" during a healthy uptrend, allowing traders to align with macro momentum.
-
Risk Mitigation: Identifying hidden bearish divergence helps traders avoid "buying the top" of a temporary relief rally during a bear market.
Comparison: Regular vs. Hidden Divergence
| Feature | Regular Divergence | Hidden Divergence |
| Market Signal | Potential Trend Reversal | Potential Trend Continuation |
| Price Action | Mismatch at Peaks/Troughs | Mismatch during Pullbacks |
| Sentiment | Momentum Exhaustion | Trend Reinforcement |
| Reliability | High at Market Extremes | High in Strong Trends |
For users looking for a streamlined experience to monitor these macro-trends without navigating complex professional interfaces, the KuCoin Lite Version provides a clean, user-friendly gateway to execute trades quickly.
FAQ
Is RSI divergence more accurate on higher timeframes?
Yes. Divergence spotted on the Daily (1D) or Weekly (1W) chart is significantly more reliable than signals found on the 5-minute chart, which are often distorted by market noise.
What is the best RSI period for finding divergence?
The standard is a 14-period RSI. While some day traders use shorter periods for faster signals, the 14-period setting offers the best balance between responsiveness and accuracy.
Can RSI divergence occur with other indicators?
Absolutely. Many traders look for confluence, such as seeing a divergence on both the RSI and the MACD simultaneously, which increases the conviction of the signal.
How do I confirm a Bullish Divergence?
A common method is to wait for the price to break above a recent "swing high" or for the RSI itself to break an internal trendline. Never trade the signal in isolation.
Does volume matter in RSI divergence?
Volume is an excellent secondary filter. A bullish divergence on rising buying volume or a bearish divergence on declining buying volume provides much stronger evidence of a coming shift.
Conclusion: The Early Warning System of Crypto
Understanding what RSI divergence is in crypto equips you with a sophisticated early warning system. By recognizing when price and momentum are out of sync, you can move away from reactive "chasing" and toward proactive, strategic trading. Whether the market is heading toward a cycle peak or finding its bottom, divergence remains one of the most reliable clues for identifying what comes next.
Create a free KuCoin account to discover the next crypto gems and trade over 1,000 global digital assets today. Create Now!


