

US Stocks Q4 2026: CTAs Unwind Longs as Buyback Authorizations Hit $1.3 Trillion
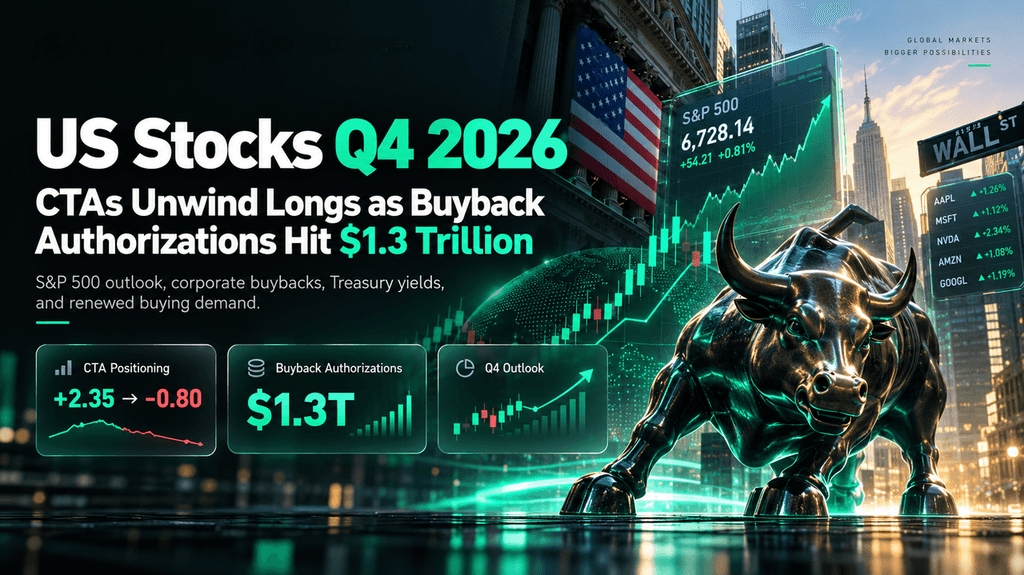
U.S. stocks entered the fourth quarter of 2026 with a significant shift in institutional positioning and a potential source of renewed buying demand. According to Citadel Securities strategist Scott Rubner, Commodity Trading Advisor (CTA) positioning fell sharply during September, moving from +2.35 to −0.80 standard deviations as systematic funds reduced their equity exposure. Meanwhile, U.S. corporations had authorized a record $1.3 trillion in share buybacks through September 29, with repurchase windows expected to begin reopening around October 15. These developments could provide support for the S&P 500 as corporate earnings season gets underway.
The outlook remains uncertain, however. Record buyback authorizations do not guarantee actual purchases, while rising Treasury yields, inflation concerns and uneven market performance could limit gains. Investors are now assessing whether corporate repurchases, improving earnings and renewed institutional demand can offset broader economic pressures and sustain a Q4 stock market recovery.
Key Takeaways
-
CTA positioning fell sharply: Citadel Securities reported that systematic equity positioning dropped from a Z-score of +2.35 to −0.80 by September 29, 2026, leaving trend-following funds with room to rebuild exposure if market conditions improve.
-
Corporate buyback authorizations reached $1.3 trillion: U.S. companies approved record share repurchases through September 29, approximately 8% above the comparable 2025 pace. The figure represents authorized programs, not guaranteed Q4 spending.
-
Corporate buying could strengthen from mid-October: Citadel Securities expects buyback activity to increase as earnings-related restrictions begin easing around October 15, with November historically seeing stronger executions. Reopening dates vary by company.
-
S&P 500 earnings expectations remain strong: LSEG data cited by Reuters on October 8 projected 30.6% year-over-year earnings growth for the third quarter, making corporate results and forward guidance important tests for equity valuations.
-
Higher Treasury yields threaten stock market gains: The U.S. 10-year yield reached approximately 5.34% on October 1, increasing pressure on equity valuations. Persistent inflation concerns could further limit a potential Q4 recovery.
-
Market concentration remains a concern: Citadel estimated that the ten largest S&P 500 companies represented approximately 41% of the index's weight. A sustainable rally would benefit from broader participation beyond major technology stocks.
CTA Funds Unwind US Stock Long Positions as Systematic Selling Reshapes Q4 Market Outlook
U.S. equity markets entered October 2026 with sharply reduced exposure from trend-following funds following a substantial unwind of long positions in September. According to Citadel Securities, CTA positioning fell from a Z-score of +2.35 at the end of August to −0.80 by September 29, a decline of 3.15 standard-deviation units. The reversal placed systematic equity positioning in the bottom 20% of its range since 2024, changing the potential balance of institutional buying and selling pressure heading into the fourth quarter.
CTA Positioning Falls Below Neutral After September's Systematic Selling
Commodity Trading Advisors (CTAs) commonly use quantitative strategies that adjust exposure based on price trends, volatility and other market signals. When equity momentum weakens, trend-following models may reduce existing long positions, adding selling pressure through index futures and related instruments. Citadel's September 18 research had already identified a decline in U.S. equity CTA positioning to approximately +1.1 standard deviations, indicating that the reduction was underway before the sharper month-end unwind.
The subsequent move to −0.80 indicates that systematic positioning fell below its historical average, but it does not establish that CTA funds became net short U.S. stocks. A negative Z-score measures positioning relative to its historical norm rather than the absolute value of short exposure. This distinction is important because the September adjustment primarily demonstrates reduced equity exposure, not necessarily a widespread shift toward outright bearish bets.
Lower CTA Exposure Could Support Renewed Buying in Q4 2026
The reduction in systematic long positions leaves CTA strategies with greater capacity to rebuild equity exposure if market trends improve. Citadel Securities strategist Scott Rubner identified this positioning reset as a potential source of additional demand during Q4. However, renewed CTA buying depends on favorable trading signals rather than the positioning decline alone. A sustained recovery could encourage trend-following funds to increase exposure, while renewed weakness could trigger further selling.
Several factors will determine how this positioning shift affects the S&P 500 and broader U.S. stock market:
-
Equity price momentum: Sustained upward trends could encourage systematic funds to rebuild long positions.
-
Market volatility: Elevated volatility may constrain risk exposure, even if stock prices begin recovering.
-
S&P 500 market breadth: Broader participation across sectors would provide stronger evidence of a market recovery than gains concentrated in a few large technology stocks.
-
Systematic trading flows: Renewed purchases could reinforce an existing rally, but reduced CTA exposure alone does not confirm an imminent short squeeze.
The distinction between potential buying capacity and actual capital inflows remains central to assessing the Q4 stock market outlook. Changes in futures positioning and market participation will provide more useful evidence of whether systematic funds are rebuilding exposure.
$1.3 Trillion in Corporate Buyback Authorizations Could Support US Stocks in Q4 2026
U.S. corporations entered the fourth quarter of 2026 with record share repurchase authorizations, creating a potential source of equity demand as earnings-related trading restrictions begin to ease. According to Citadel Securities, companies had authorized approximately $1.3 trillion in stock buybacks through September 29, the highest amount recorded at that point in any calendar year. Strategist Scott Rubner expects corporate repurchase activity to strengthen from mid-October into November, although the authorized total does not represent purchases guaranteed to occur during Q4.
-
US Corporate Buyback Authorizations Reach Record $1.3 Trillion
The $1.3 trillion figure, based on Russell 3000 repurchase authorizations compiled from EventVestor data, was approximately 8% above the comparable 2025 pace. The increase reflects companies' willingness to allocate capital toward repurchasing their shares despite economic uncertainty and changing market valuations. Large authorization programs can provide flexibility for future purchases, allowing companies to adjust their execution schedules according to available cash, financial priorities and market conditions. Nvidia's expanded share repurchase authorization provides an example of how a major company can establish a multiyear capital-return program.
However, buyback authorizations and executed repurchases are different financial measures. An authorization permits a company to purchase shares up to an approved amount, but management may delay, reduce or cancel those purchases. Actual repurchases can reduce shares outstanding and improve earnings per share when the reduction is not offset by new share issuance. Their effect on stock prices remains dependent on trading activity, company fundamentals and broader investor demand.
-
Corporate Buyback Windows Could Reopen From October 15 as Earnings Season Begins
Citadel Securities identified October 15, 2026, as the expected beginning of a broader reopening of corporate buyback windows following restrictions associated with third-quarter earnings. Many publicly traded companies limit discretionary share repurchases around financial reporting periods to manage insider-trading risks. These restrictions generally follow company-specific policies, meaning repurchases do not resume simultaneously across the entire U.S. stock market.
The U.S. Securities and Exchange Commission provides a voluntary safe harbor under Rule 10b-18 for qualifying issuer repurchases that satisfy conditions involving trading volume, timing, pricing and execution methods. The rule does not establish October 15 as a universal reopening date. Rubner expects corporate buying to increase as individual companies complete their earnings-related restrictions, with November historically representing the strongest month for buyback executions. The actual recovery in purchases will depend on how aggressively companies use their approved programs.
-
Corporate Repurchase Activity Could Strengthen S&P 500 Buying Demand
Corporate buybacks may provide an additional source of demand for U.S. equities when companies return to the market after earnings announcements. Unlike investment funds that primarily adjust exposure according to external market conditions, corporations can make repurchase decisions based on their own capital-allocation plans. Consistent execution may help absorb shares offered for sale, particularly during periods of weaker investor demand. Still, the impact on the S&P 500 and broader U.S. stock market will depend on several factors beyond the size of announced programs:
-
Actual repurchase spending: Quarterly corporate disclosures will help establish how much authorized capital companies have deployed rather than simply approved.
-
Sector participation: Citadel's August 10 research found that nearly 70% of the largest year-to-date buyback authorizations were outside the technology sector, suggesting potential corporate buying demand extends beyond major technology companies.
-
Capital allocation and cash flow: Companies balancing dividends, debt repayment and investment spending may execute fewer repurchases than their approved programs allow.
-
Share issuance and net supply: Repurchases that exceed new share issuance can reduce the number of shares outstanding, while stock-based compensation and other issuance may offset some of that reduction.
These factors will determine whether record corporate buyback authorizations translate into meaningful equity demand during the remainder of Q4 2026. The timing of company disclosures also means investors may not know the full extent of executed repurchases until quarterly financial reports become available.
S&P 500 Q4 Outlook Hinges on Corporate Earnings, Treasury Yields and Renewed Buying Demand
The S&P 500 Q4 2026 outlook remains closely tied to corporate earnings, U.S. Treasury yields and investors' willingness to increase equity exposure. After reaching a record high on October 6, the benchmark faced renewed selling pressure on October 8 as rising energy prices and interest-rate concerns weighed on market sentiment. Strong earnings expectations could help sustain demand for U.S. stocks, but investors must assess whether corporate profit growth can justify valuations while borrowing costs remain elevated. Understanding the composition of the S&P 500 index is also important because larger companies have a greater influence on benchmark performance.
S&P 500 Earnings Growth Could Support US Stock Market Valuations
Third-quarter corporate earnings are emerging as a major catalyst for U.S. equities. According to LSEG data cited by Reuters on October 8, S&P 500 companies were expected to report approximately 30.6% year-over-year earnings growth, with technology and energy among the strongest contributors. Citadel Securities also reported that the index traded at roughly 19 times forward earnings as of September 29, about 15% below its 2026 valuation peak. Stronger profits could help justify current stock prices, although investors will be comparing actual results against already elevated expectations.
The earnings calendar will provide an important test of that outlook. JPMorgan Chase, Goldman Sachs, Citigroup and Wells Fargo are scheduled to report on October 13, followed by Bank of America and Morgan Stanley on October 14. Investors will examine lending activity, financing costs and management guidance for signs of economic resilience. Attention will then shift toward major technology companies, where spending on artificial intelligence infrastructure and expectations for future revenue growth remain central to equity valuations.
Rising Treasury Yields and Federal Reserve Policy Could Limit S&P 500 Gains
Higher U.S. Treasury yields remain a significant obstacle to sustained stock market gains. The benchmark 10-year yield reached approximately 5.34% on October 1, its highest level in 24 years, according to Reuters. Elevated bond yields increase competition for investor capital because government securities offer higher returns, while also raising the discount rates used to value future corporate earnings. Growth-oriented companies can be particularly sensitive to these changes when investors expect a large share of their profits to arrive years into the future.
The October 8 market decline demonstrated how quickly inflation and monetary policy concerns can influence equity performance. A sharp increase in crude oil prices added pressure to inflation expectations, while investors continued assessing the possibility of further Federal Reserve tightening. The central bank's October 27–28 policy meeting will be closely watched for signals about interest rates and borrowing conditions. Even strong corporate earnings may struggle to support higher stock valuations if Treasury yields continue rising or investors begin anticipating a more restrictive policy path.
ETF Inflows and Investor Participation Could Shape the Next S&P 500 Rally
Beyond earnings and interest rates, the strength of any Q4 recovery will depend on whether investors continue committing capital to U.S. financial markets. Citadel Securities reported substantial exchange-traded fund inflows during 2026, alongside weaker retail trading activity in September. Although renewed participation could improve market liquidity and support equity demand, aggregate ETF inflows do not necessarily translate directly into S&P 500 purchases because they include investments across different asset classes.
Several developments could provide clearer evidence of sustained buying demand:
-
Record ETF investment flows: U.S. ETF net inflows reached approximately $1.9 trillion through September 29, according to Citadel Securities, running 43% ahead of the previous year's record pace. Third-quarter inflows totaled $771 billion, making the direction of subsequent equity-focused allocations particularly important.
-
Concentrated index exposure: Citadel estimated that the ten largest S&P 500 companies accounted for approximately 41% of the index's weight. Their earnings performance and institutional ownership trends could therefore have an outsized influence on benchmark returns.
-
Late-October earnings catalyst: Approximately 44% of S&P 500 index weight was scheduled to report earnings during the final week of October, according to Citadel's September 29 analysis. Those results could influence portfolio reallocations and expectations for corporate profitability heading into year-end.
The interaction between earnings performance, financing conditions and actual investment flows will determine whether renewed buying produces a broader market recovery or remains concentrated in a limited group of large-cap stocks. Sustained improvement across multiple industries would provide stronger confirmation of investor confidence than a rally driven primarily by a few heavily weighted companies.
Conclusion
The U.S. stock market enters Q4 2026 with a different positioning backdrop after September's substantial reduction in CTA long exposure. Combined with record corporate buyback authorizations, this creates the potential for renewed equity demand as earnings-related trading restrictions ease. However, the $1.3 trillion buyback figure reflects approved repurchase programs, not guaranteed fourth-quarter purchases, while systematic funds still need favorable market signals before rebuilding their positions.
For the S&P 500, the strength of any year-end recovery will depend on whether corporate earnings meet expectations, Treasury yields stabilize and buying activity extends beyond the largest technology stocks. Investors should pay particular attention to actual repurchase execution, earnings guidance and market breadth throughout October and November. These indicators will provide stronger evidence of a sustainable Q4 rally than positioning changes or historical seasonal patterns alone.
🔥 Beyond the Headlines: What KuCoin 5.0 Means for You
Market news moves fast — but where you act on it matters just as much. This October, KuCoin launches KuCoin 5.0, transforming KuCoin into a rebuilt platform. Here's what actually changes for you:
-
One account for everything. Older platforms split your money across separate "spot," "margin," and "futures" accounts and expected you to understand why. KuCoin 5.0's unified account removes that entirely — deposit once, and everything is simply there (only available to VIPs for now).
-
Stocks, indices, and commodities. KuCoin 5.0 expands beyond crypto into global markets. When crypto chops sideways and equities rally (or the reverse), you rotate in minutes instead of opening a brokerage account and waiting days for fiat rails.
-
Real-world assets (RWA). Tokenized exposure to traditional assets like commodities, right inside your crypto account. One of the fastest-growing segments in global finance is no longer reserved for institutions — you access it from the same balance you trade with.
-
Earn while you learn. Not ready to trade? KCUSD lets your stablecoins earn daily, auto-compounding interest. The lowest-stress way to put your idle deposit to work for 4% yield.
-
An AI assistant in plain language. Ask questions, get market context, understand what you're looking at — built into the platform, no jargon required.
-
An app that doesn't overwhelm. Faster, cleaner, and consistent — intuitive from the first tap, not after a tutorial.
-
Safety you can check, not just trust. A MiCAR-licensed EU entity, Proof of Reserves you can verify yourself, and internationally certified security (SOC 2 Type II, ISO 27001:2022).
Create your account in minutes — and start on the platform built for where crypto is going, not where it's been.
FAQs
How Can Investors Track Actual Corporate Stock Buybacks?
Investors can review quarterly 10-Q filings, annual 10-K reports and company earnings disclosures to track completed share repurchases. These documents typically report shares purchased, average prices paid and remaining authorization amounts. Actual repurchase spending provides stronger evidence of corporate buying activity than announcements of new programs. Comparing these figures across reporting periods can reveal whether a company is accelerating or reducing its repurchase activity.
Why Can the S&P 500 Rise While Most US Stocks Decline?
The S&P 500 is weighted by market capitalization, meaning larger companies have greater influence on index performance. Strong gains among a few major technology stocks can lift the benchmark even when smaller constituents decline. Comparing the capitalization-weighted S&P 500 with its equal-weight counterpart helps investors assess broader market participation. A persistent gap between the two indices may indicate that market gains are becoming increasingly concentrated.
Can US Stock Market Buying Pressure Affect Bitcoin and Crypto Prices?
Changes in U.S. equity market sentiment can influence Bitcoin and other cryptocurrencies through institutional risk appetite, liquidity conditions and portfolio allocation decisions. Stronger equity demand may coincide with greater interest in risk-sensitive digital assets, but the relationship is inconsistent. Corporate stock buybacks do not directly create buying demand for cryptocurrencies. Bitcoin and equity correlations can also weaken when cryptocurrency-specific developments become the primary drivers of market activity.
Which Market Indicators Can Confirm a Broader S&P 500 Recovery?
Investors can examine the equal-weight S&P 500, advance-decline data, small-cap performance and the percentage of stocks trading above their moving averages. Improving participation across industries would provide stronger evidence of a broad recovery than gains concentrated in a handful of large companies. No single indicator can confirm that a rally will continue. Combining market breadth measurements with earnings revisions and trading-volume trends can provide a more complete picture of underlying market strength.
Disclaimer
The information provided on this page may originate from third-party sources and does not necessarily represent the views or opinions of KuCoin. This content is intended solely for general informational purposes and should not be considered financial, investment, or professional advice. KuCoin does not guarantee the accuracy, completeness, or reliability of the information, and is not responsible for any errors, omissions, or outcomes resulting from its use. Investing in digital assets carries inherent risks. Please carefully evaluate your risk tolerance and financial situation before making any investment decisions. For further details, please consult KuCoin’s Terms of Use and Risk Disclosure.