

What Is the Pentagon Pizza Index?
Thesis Statement
The Pentagon Pizza Index serves as a cultural and data-driven lens for observing potential correlations between routine human behaviors in high-stakes environments and significant international developments, offering insights into operational tempo without relying on classified information.
Introduction
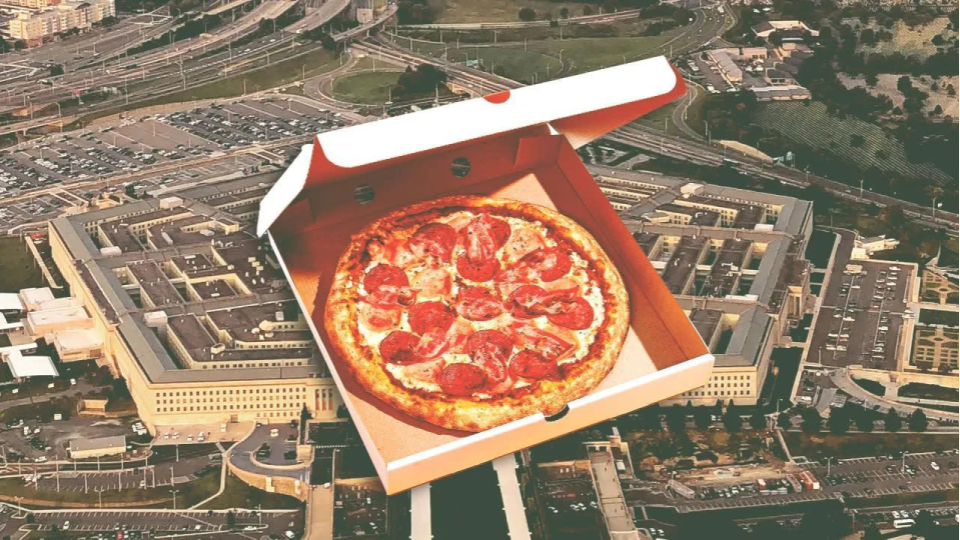
The Pentagon Pizza Index, often called the PizzINT or pizza meter, represents a distinctive form of open-source intelligence (OSINT) that observes patterns in food delivery and foot traffic at restaurants near the U.S. Department of Defense headquarters. This informal tracking method gained renewed attention through social media accounts and dedicated dashboards that monitor real-time activity using publicly available data like Google Maps popular times graphs. Proponents point to historical instances where increased late-night pizza orders coincided with major U.S. or allied military operations, suggesting that staff working extended hours on urgent matters turn to convenient meals.
Modern implementations rely on aggregated visit data rather than direct order volumes, providing a proxy for busyness at specific locations. While not an official intelligence tool, the index has become a topic of discussion among analysts, journalists, and online communities interested in geopolitical forecasting. Its appeal lies in accessibility; anyone can check public data sources, combined with anecdotal evidence spanning decades. Recent digital platforms have formalized this monitoring, offering visualizations that correlate activity levels with global events. This approach reflects broader trends in citizen OSINT, where everyday indicators help interpret complex security dynamics.
Origins of the Pentagon Pizza Observation in Cold War Intelligence Practices
The concept traces back to observations during the late Cold War period, when individuals noted unusual spikes in fast-food deliveries to government facilities in the Washington, D.C. area. In 1990, Domino's franchise owner Frank Meeks reported to the Los Angeles Times a record 21 pizzas ordered by the CIA on August 1, one day before Iraq's invasion of Kuwait. Similar patterns appeared in other periods of heightened activity, such as during the lead-up to the Gulf War and other operations. These accounts suggested that personnel engaged in extended briefings or planning sessions relied on quick, shareable meals like pizza, which could be delivered without disrupting work. The theory spread among journalists and observers, with CNN's Wolf Blitzer famously advising to monitor pizza activity for early signs of news. Over time, the idea evolved from an informal anecdote to a recognizable meme within defense-watching circles.
Unlike direct surveillance, it leverages indirect behavioral signals that emerge under pressure. Contemporary trackers build on this foundation by using digital tools to quantify what was once purely observational. This historical context highlights how simple consumer patterns can reflect broader institutional rhythms in national security settings. Data from that era remains limited to retrospective reports, yet it established a framework still referenced today. The persistence of the observation underscores its resonance with those seeking accessible entry points into complex geopolitical analysis. Sources like Wikipedia and contemporary reporting confirm these early instances as foundational to the modern index.
How Modern Dashboards Track Pizza Activity Near the Pentagon
Contemporary versions of the index utilize platforms such as pizzint.watch, which monitors multiple pizzerias in Arlington, Virginia, close to the Pentagon. These dashboards aggregate public data points, primarily Google Maps' "popular times" and busyness indicators, to detect deviations from normal patterns. Accounts like @PenPizzaReport on X post updates on surges, often noting percentage increases in activity at locations such as Papa John's or Domino's. For example, in June 2025, a reported surge preceded Israel's actions against Iran, drawing significant media coverage. The system does not access actual sales figures or delivery destinations but infers busyness from visit density and timing, especially during off-peak hours. This methodology allows for near real-time observation without invasive measures. Analysts cross-reference these signals with other open sources, including news wires and prediction markets, to assess relevance.
Limitations exist, as factors like local events or weather can influence traffic, requiring contextual interpretation. The expansion to related indicators, such as activity at nearby establishments, adds layers to the monitoring. As of May 2026, such tools continue to operate, providing visualizations that map activity levels against global tension metrics. This digital evolution has broadened participation in OSINT, enabling enthusiasts worldwide to engage with defense-related patterns through everyday data proxies. The approach emphasizes correlation over causation, positioning the index as one tool among many in informal intelligence gathering.
Documented Correlations Between Pizza Spikes and Major Geopolitical Events
Several high-profile cases illustrate the observed alignments. During the 1991 Gulf War preparations, delivery surges were noted ahead of key developments. More recently, in April 2024, elevated activity at a Papa John's coincided with Iran's drone launches toward Israel. In June 2025, reports of unusual busyness at District Pizza Palace preceded Israel's bombing campaign against Iran by a short margin. Another instance in June 2025 involved a Papa John's surge shortly before announcements of U.S. strikes on Iranian facilities. These examples, drawn from public timelines, show patterns where activity spikes occur in the hours or days leading up to escalations.
Trackers emphasize that such signals often appear during late-night periods when standard operations might otherwise be quiet. While perfect prediction remains elusive, the frequency of temporal proximity has fueled interest. Media outlets, including Newsweek and the Jerusalem Post, have covered these instances, noting the index's role in public discourse. The data relies on verified social media posts and dashboard captures cross-checked against event timelines from reputable sources. This body of cases provides a dataset for examining whether behavioral proxies hold explanatory value in fast-moving situations. Ongoing monitoring continues to test these associations across different contexts, contributing to discussions on informal indicators in security analysis.
Role of Open-Source Intelligence in Interpreting Pizza Data Signals
OSINT practitioners view the index as a supplementary data point within a larger ecosystem of publicly available information. By focusing on unclassified indicators, it democratizes aspects of monitoring that traditionally required insider access. Platforms combine pizza activity with other signals like flight tracking, social media sentiment, or market movements to build composite pictures. This multi-source approach mitigates the risk of over-reliance on any single metric. For instance, a pizza surge might gain significance when paired with elevated Polymarket odds on related events. The methodology encourages verification through multiple channels, aligning with best practices in open-source work.
Critics argue that correlation does not imply reliable prediction, yet supporters highlight its utility as an early alert mechanism. Digital tools have lowered barriers, allowing independent verification of claims. As geopolitical competition intensifies, such creative applications of public data reflect adaptive strategies in information environments. The index exemplifies how consumer-facing technologies inadvertently reveal operational patterns. Continued refinement of data collection could enhance its precision, though inherent noise from civilian factors persists.
Technical Methods Used to Measure Restaurant Busyness Levels
Data collection centers on Google Maps features that display relative popularity graphs for businesses. Trackers observe deviations from baseline "usually busy" levels, flagging anomalies like +400% spikes during atypical hours. Additional sources include delivery app estimates or aggregated foot traffic proxies when available. Dashboards update in near real-time, providing visual representations such as heat maps or trend lines. Accuracy depends on the completeness of Google's data sampling, which relies on user contributions via location services. This introduces potential biases toward busier periods or popular venues. Analysts apply statistical thresholds to distinguish meaningful signals from routine fluctuations. For example, sustained elevations across multiple nearby locations strengthen the observation. Integration with time-stamped event logs allows retrospective validation.
As of 2026, platforms like PizzINT have expanded monitored sites to eight or more, improving robustness. These technical foundations make the index reproducible and accessible, fostering wider scrutiny and discussion. Challenges include data gaps during low-usage periods and the indirect nature of the measurements. Refinements, such as incorporating weather adjustments or local event filters, could improve signal quality over time. The method remains grounded in observable, verifiable public information rather than speculation.
Limitations and Criticisms of Relying on Food Delivery Patterns
Skeptics, including analysts like Marcel Plichta, describe the index as a "nonsense indicator" due to weak causal links and confounding variables. Pentagon facilities offer extensive internal food options, potentially reducing external orders during crises. External factors such as promotions, sports events, or traffic patterns can mimic signals. The approach lacks rigorous statistical validation across comprehensive datasets, relying instead on selective historical matches. Public data sources provide proxies rather than direct evidence of orders to specific buildings. Overinterpretation risks confirmation bias, where only cases that align receive attention. Official responses from the Department of Defense have dismissed direct connections, stating no comment or emphasizing internal capabilities.
Media coverage sometimes amplifies anecdotal successes while downplaying misses. Despite these issues, the index persists as a conversation starter rather than a standalone forecasting tool. Responsible use involves treating it as one data point within a multifaceted analysis. Improvements might come from larger sample sizes or machine learning to filter noise, but fundamental constraints related to data granularity remain. The debate underscores the need for humility when using indirect behavioral metrics in high-stakes domains.
Comparisons With Other Informal Indicators in Security Analysis
The pizza index fits alongside other unconventional metrics, such as unusual parking patterns at government buildings or shifts in nightlife activity. Some trackers have extended monitoring to include quieter periods at nearby social venues as inverse signals. Prediction markets like Polymarket often move in tandem with reported surges, providing complementary price-based insights. Flight tracking of government aircraft or satellite imagery changes offers more technical parallels. Each method shares the advantage of public accessibility but faces similar validation challenges. The pizza approach stands out for its cultural familiarity and low barrier to entry.
In aggregate, these indicators contribute to a mosaic of situational awareness. Professional analysts incorporate them cautiously alongside traditional intelligence streams. The variety reflects innovation in an era of abundant open data. Cross-validation across different proxies strengthens overall confidence when patterns converge. This ecosystem encourages diverse perspectives on interpreting real-world signals without centralized control. The pizza index's prominence highlights public fascination with tangible, relatable markers of abstract processes.
Impact of Social Media on the Spread and Evolution of the Index
Platforms like X have accelerated the index's visibility, with accounts posting screenshots and commentary that reach thousands. Viral threads during tense periods amplify awareness, sometimes influencing market reactions or public sentiment. This rapid dissemination creates feedback loops where heightened attention itself generates discussion. Content creators blend humor with analysis, broadening appeal beyond specialist circles. The format suits short-form updates, enabling quick sharing of dashboard captures tied to news. However, speed can outpace verification, leading to premature conclusions.
Mainstream outlets often reference social media origins in their reporting, bridging online phenomena with traditional journalism. The evolution from niche observation to widely recognized meme demonstrates digital media's power to shape discourse. Engagement metrics, such as follower growth for tracking accounts, indicate sustained interest. This dynamic environment continually refreshes the index through user contributions and new data interpretations. Balancing entertainment value with substantive analysis remains an ongoing challenge for participants.
Pizza Industry Perspectives on Government Area Demand Fluctuations
Restaurant operators near the Pentagon experience variable demand influenced by the large workforce and visitor traffic. Chains like Papa John's and Domino's benefit from proximity to a 24/7 institution but face logistical demands during peak periods. Franchisees historically noted patterns without attributing them directly to specific events. Increased activity requires staffing adjustments and supply preparedness, though spikes may not always translate to proportional profit gains due to delivery focus. Industry data on Washington metro area sales remains aggregated and not publicly broken down by client type.
Operators prioritize operational efficiency over speculation on customer motivations. Some view the publicity as neutral or positive for brand recognition. Challenges include managing expectations during reported high-tempo periods when actual causality stays unconfirmed. The phenomenon underscores the interconnectedness of local businesses with regional economic and security dynamics. Practical responses involve standard inventory and scheduling practices rather than specialized crisis protocols. This ground-level view complements broader analytical discussions.
Broader Implications for Understanding Operational Tempo in Defense
The index offers a window into how institutional demands affect human routines within large bureaucracies. Extended hours necessitate adaptations in sustenance that become visible externally. This visibility provides indirect evidence of workload intensity without breaching security protocols. For researchers studying organizational behavior, it exemplifies how collective actions create detectable patterns. In defense contexts, it highlights the human element persisting amid advanced technology. Policymakers and observers gain another avenue for gauging readiness levels through non-traditional means.
The concept encourages thinking about everyday indicators as reflections of systemic states. Applications extend beyond the U.S. to similar observations near other government centers globally. Limitations in precision do not negate the value in pattern recognition training. As data tools advance, such metrics may integrate into more sophisticated monitoring frameworks. The index thus contributes to discussions on transparency, accountability, and the interplay between public life and security functions.
Integration With Prediction Markets and Financial Analysis
Activity signals have appeared alongside movements in platforms like Polymarket, where bets on geopolitical outcomes shift during reported spikes. Traders sometimes reference the index when assessing probabilities for events like military actions. This intersection creates a hybrid analysis combining behavioral data with financial incentives. Market efficiency theories suggest that public signals, even unconventional ones, get incorporated into pricing. However, causal direction remains unclear; events may drive both pizza activity and market moves. Investors monitor multiple inputs for an edge in volatile periods.
Oil prices and defense stocks have shown reactions following aligned signals in past cases. The phenomenon adds a layer of narrative to quantitative trading strategies. Caution prevails, as single indicators rarely suffice for decisions. The combination illustrates how diverse data streams converge in modern information markets. Ongoing developments may strengthen these linkages through improved timing and correlation studies.
Potential for Refining Behavioral Intelligence Indicators
Advancements in data analytics could enhance the index through machine learning models that account for more variables. Integration with additional public datasets, such as traffic or utility usage proxies, might yield richer insights. Global expansion to monitor similar patterns near other capitals could provide comparative perspectives. Ethical considerations around privacy and interpretation accuracy will grow in importance. Collaboration between technologists, journalists, and analysts may professionalize aspects of the practice.
While remaining informal, structured validation frameworks could elevate credibility. Public interest suggests sustained evolution rather than decline. The core appeal, connecting observable routines to larger outcomes, likely endures as long as accessible data exists. Future iterations may balance accessibility with methodological rigor. This trajectory positions the index within evolving landscapes of open information and citizen analysis.
Public Perception and Cultural Significance of the Pizza Index
The concept resonates due to its blend of seriousness and relatability, turning policy abstractions into something tangible, like food choices. Memes and commentary humanize defense activities, fostering engagement across demographics. Cultural references appear in podcasts, videos, and articles, extending reach. It reflects societal interest in decoding power structures through accessible means. Perception varies from lighthearted curiosity to serious tools depending on context.
Educational value lies in illustrating OSINT principles to broader audiences. The index has entered the popular lexicon during tense news cycles, influencing how events are discussed. This cultural embedding ensures periodic revivals with new developments. It demonstrates the power of shared narratives in interpreting world affairs. Long-term, it may inspire similar creative approaches to other domains.
FAQ
1. How accurate has the Pentagon Pizza Index proven in anticipating specific military actions over recent years?
The index has shown temporal correlations in several documented cases from 2024 through 2026, such as activity surges preceding announcements related to Iran, yet it functions best as a contextual signal rather than a precise predictor. Analysts recommend combining it with multiple sources for meaningful interpretation, acknowledging that not every spike leads to immediate events and external variables can influence readings.
2. What data sources do platforms like PizzINT primarily rely upon for their real-time monitoring?
These platforms use publicly available Google Maps busyness data and similar aggregated foot traffic indicators from restaurants near the Pentagon, avoiding any private order information. This approach ensures transparency while limiting granularity, with updates reflecting relative changes from historical baselines at monitored locations.
3. Can individuals outside professional circles effectively use the Pentagon Pizza Index for personal geopolitical awareness?
Yes, the accessible nature of the dashboards and social media trackers allows anyone to observe patterns and cross-reference with news, though proper context and verification against established sources remain essential to avoid misinterpretation of routine fluctuations.
4. How has social media changed the way the Pentagon Pizza Index is discussed and applied?
Social media has accelerated its visibility through rapid sharing of observations, turning it into both an analytical tool and cultural meme, while also increasing the speed at which signals reach global audiences during developing situations.
5. What are some practical limitations when trying to conclude pizza activity data alone?
Key limitations include potential influences from non-military factors like local promotions or events, the indirect measurement method, and the absence of direct links to specific Pentagon activities, necessitating cautious, multi-source analysis.
6. Are there similar informal indicators used for monitoring activity in other government or military contexts?
Yes, extensions include observations of other venues or patterns, such as parking or alternative delivery services, reflecting a wider interest in behavioral proxies across various sensitive locations worldwide.