
ETH/BTC Technical Breakdown: Why Ethereum Could Still Fall Another 40% Against Bitcoin
2026/05/11 14:03:01
Introduction
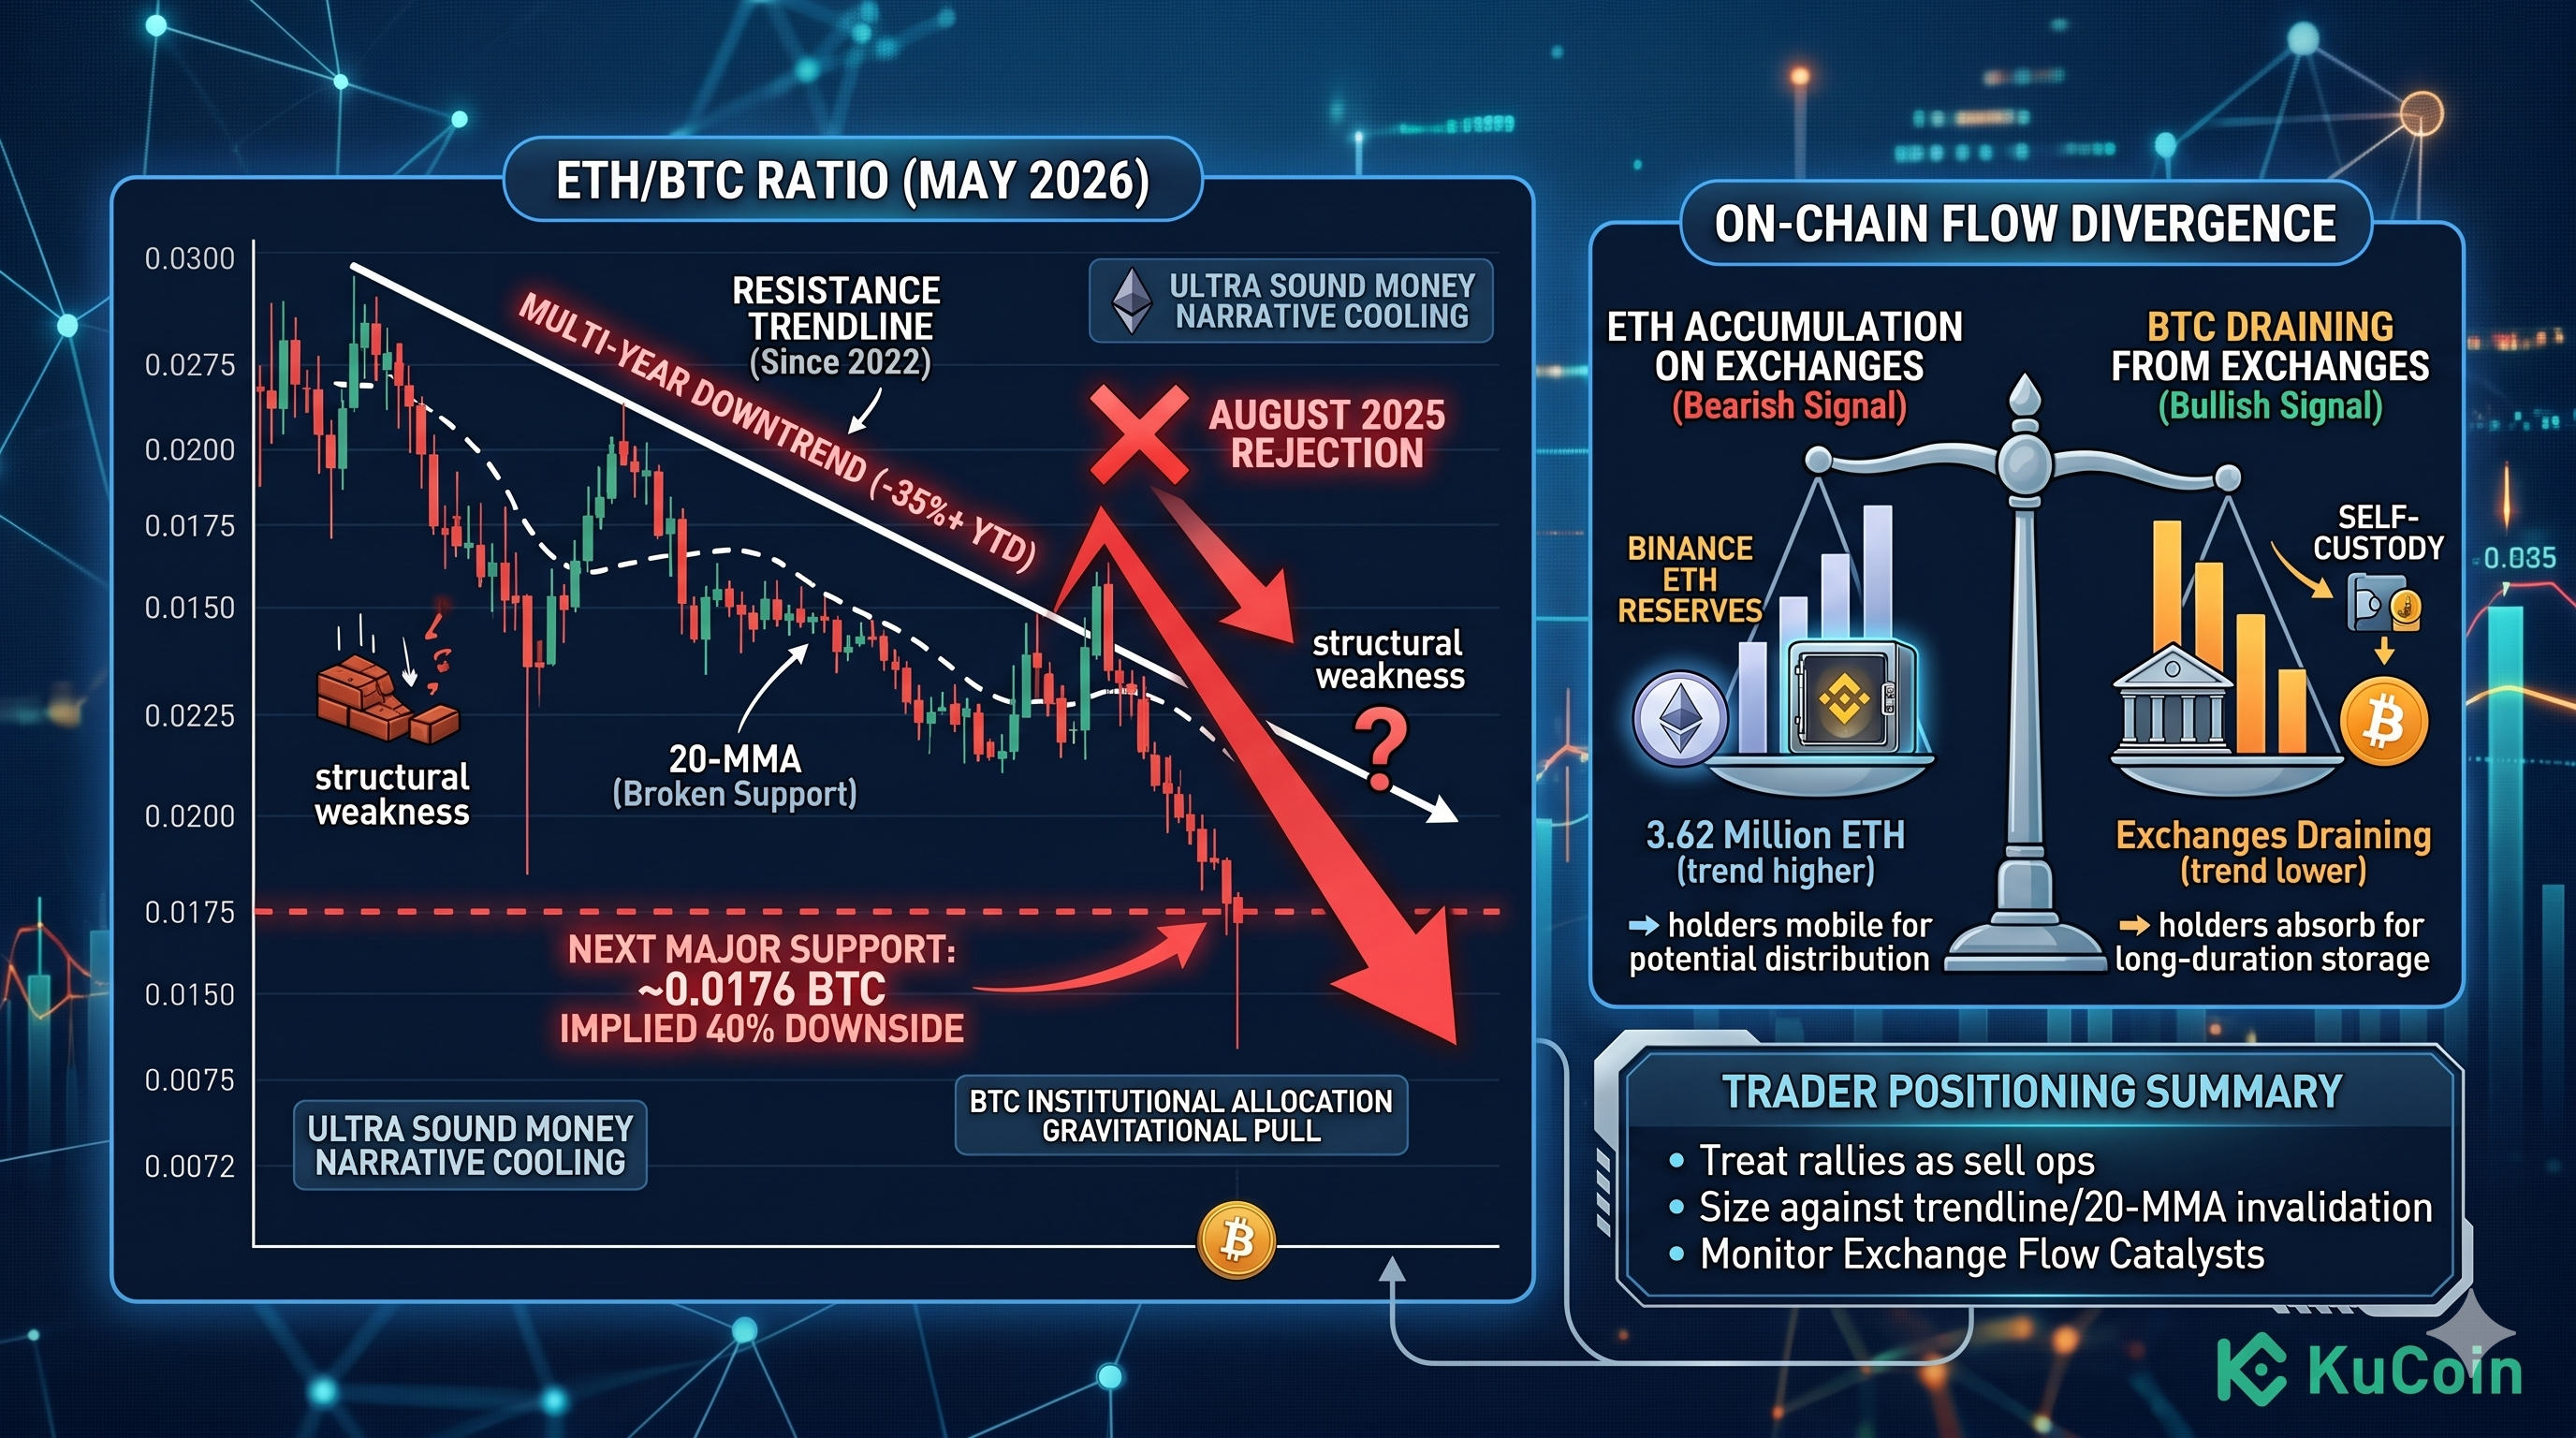
Ethereum has lost more than 35% of its value against Bitcoin over the past twelve months — and the chart suggests the pain may not be over. The ETH/BTC ratio remains capped by a multi-year descending trendline that has rejected every meaningful rally since 2022, and the latest rejection in August 2025 has now broken below the 20-month moving average support. If the prevailing weakness extends, the next major technical target sits near 0.0176 BTC, which implies roughly another 40% downside from current levels and would retest the 2020 cycle low zone. The setup is reinforced by diverging on-chain flows: ETH reserves on Binance climbed to about 3.62 million by May 2026 while Bitcoin exchange balances continued to drain. For traders, the message is that ETH’s relative weakness is structural, not noise.
What Is the Current State of the ETH/BTC Ratio?
The ETH/BTC ratio is in a confirmed multi-year downtrend, with price action sitting below a descending trendline that has acted as resistance since late 2022. Each successful rally back toward that trendline has produced a rejection followed by a deeper retracement, a pattern that has now repeated across multiple cycles without resolution to the upside.
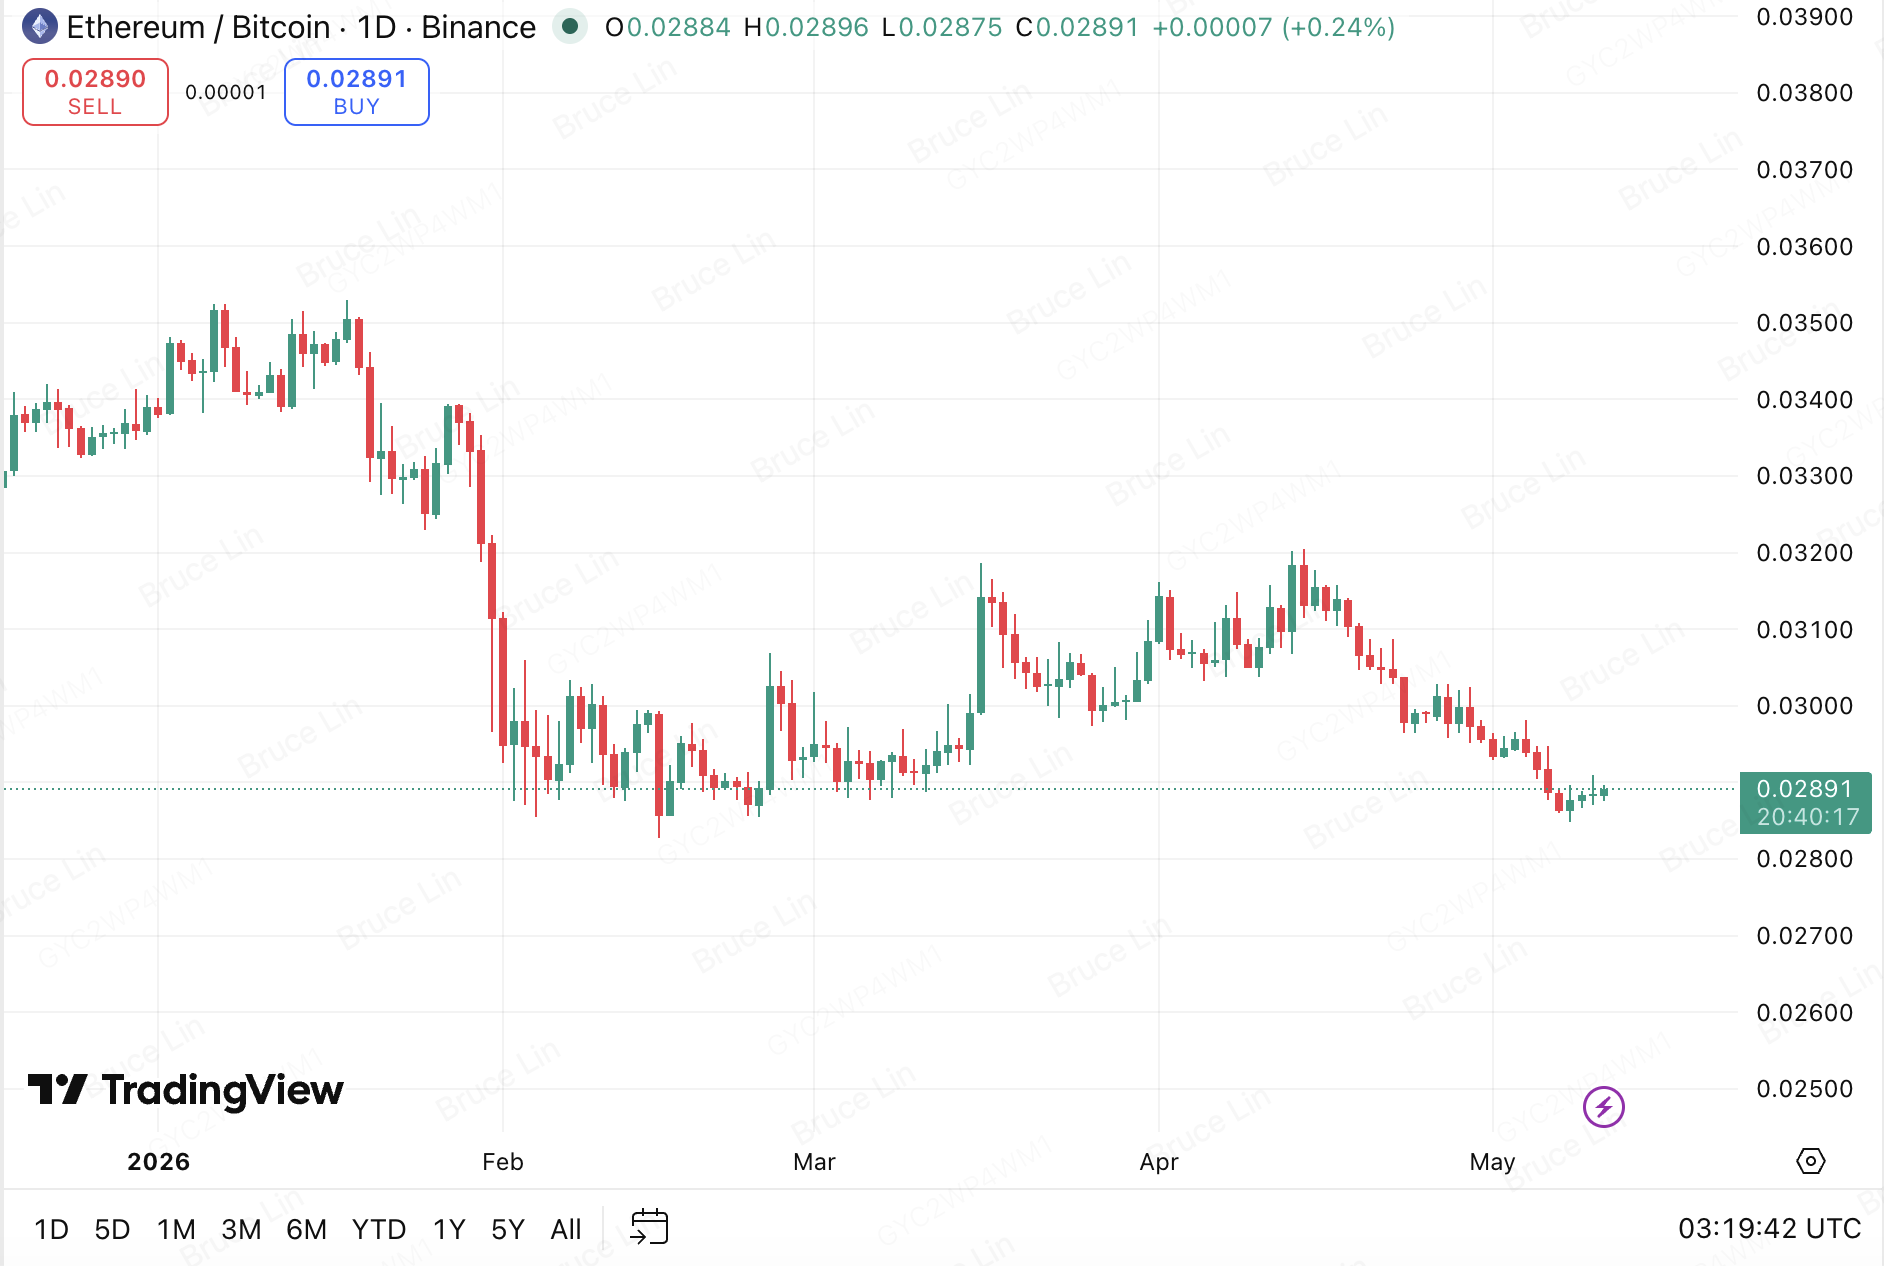
Over the past year, the ratio has shed more than 35%, according to commonly tracked ETH/BTC chart data referenced across major market data providers in Q2 2026. That decline has come despite multiple macro tailwinds for risk assets and continued growth in Ethereum’s underlying network activity, which makes the relative underperformance particularly notable.
How Did the August 2025 Rejection Reshape the Setup?
The August 2025 rejection was the defining technical event of the current cycle. ETH/BTC rallied into a confluence zone where the 0.382 Fibonacci retracement of the prior major decline overlapped with the 50-month moving average — a high-probability resistance area where institutional sellers historically reload positioning.
The ratio failed at that confluence and reversed sharply lower, subsequently breaking below the 20-month moving average that had served as intermediate support throughout the prior consolidation phase. That break is the technical trigger underpinning the bearish case for further downside.
Why Does the 2024–2025 Pullback Pattern Matter?
The 2024–2025 pullback pattern matters because it produced a roughly 70% drawdown in ETH/BTC from local highs to lows, establishing the template that bears expect to repeat. Each prior trendline rejection in this regime has been followed by a multi-month decline that exceeded most consensus expectations, and the current structure mirrors that setup with uncomfortable precision.
Where Is the Next Major Support Level for ETH/BTC?
The next major support sits around 0.0176 BTC, implying roughly 40% additional downside from current levels and a retest of the 2020 cycle low zone. That level is derived from a combination of horizontal price memory, Fibonacci extension targets from the descending channel, and the historical reaction zone that capped ETH’s underperformance during the previous cycle bottom.
If sellers maintain control and the 20-month moving average flips from former support to confirmed resistance, the 0.0176 area becomes the magnetic target for any sustained downside continuation.
What Technical Indicators Support the 40% Downside Target?
Three technical indicators reinforce the 0.0176 BTC target zone:
-
Descending channel projection — extending the multi-year channel forward intersects the 0.0176 region within the expected timeframe.
-
Monthly RSI structure — the indicator remains below its mid-line on the monthly timeframe with no bullish divergence forming, consistent with continued downside.
-
Volume profile — visible range volume nodes thin out meaningfully below current support, allowing for accelerated price discovery once nearby levels break.
Are There Any Bullish Invalidation Levels?
The bearish thesis is invalidated by a sustained monthly close back above the descending trendline and the 50-month moving average — currently the same confluence that rejected price in August 2025. A reclaim of the 20-month moving average on convincing volume would serve as the earlier warning signal that the downtrend is losing momentum.
Until one of those reclaim levels prints, the path of least resistance remains lower, and rallies should be treated as countertrend within a dominant downtrend.
What Do On-Chain Flows Say About ETH vs. BTC?
On-chain flow data shows a clear and persistent divergence: ETH is accumulating on exchanges while BTC is leaving them. That asymmetry is one of the cleanest signals supporting the bearish ETH/BTC structure, because it reflects opposite real-world holder behavior across the two assets.
How Much ETH Sits on Binance Now?
Binance ETH reserves have climbed to approximately 3.62 million ETH as of May 2026, representing about 24.6% of total ETH held across centralized exchanges, based on widely tracked on-chain dashboards. That figure has trended higher across the past several months rather than declining, indicating that holders are moving ETH onto exchanges — a behavior typically associated with intent to sell or actively trade rather than long-term hold.
The concentration on a single venue also creates a structural overhang. When more than one quarter of exchange-held ETH sits on one platform, liquidation cascades or large single-venue sell programs can disproportionately influence price action across the broader market.
How Are Bitcoin Exchange Reserves Trending?
Bitcoin exchange reserves continue to decline across major venues, extending a multi-year trend of BTC migrating off exchanges and into self-custody, ETF custodians, and corporate treasuries. That outflow pattern tightens available BTC liquidity and reflects stronger conviction to hold rather than transact.
The contrast is the key point. ETH is being mobilized for distribution while BTC is being absorbed into long-duration storage. That divergence directly maps to relative weakness in the ETH/BTC pair and is unlikely to reverse without a meaningful shift in flows.
Why Is the Narrative Environment Weighing on Ethereum?
The narrative environment has shifted decisively against Ethereum’s relative strength, with the “ultra sound money” framing losing momentum while Bitcoin captures the institutional allocation story. Narratives matter because they drive marginal flows from non-crypto-native capital, and Bitcoin currently owns the dominant institutional pitch.
Has the "Ultra Sound Money" Narrative Cooled?
The ultra sound money narrative has cooled materially. The framing depended on sustained net deflation in ETH supply driven by transaction-fee burning under EIP-1559, but periods of lower base fees and the migration of activity to Layer-2 networks have shifted the net issuance picture closer to neutral or slightly inflationary on certain stretches.
That dynamic does not invalidate Ethereum’s long-term value proposition, but it removes one of the cleanest talking points that previously supported ETH outperformance versus BTC during prior cycles.
What Is Driving Bitcoin's Institutional Bid?
Bitcoin’s institutional bid is driven by a combination of spot ETF inflows, corporate treasury adoption, and a clear regulatory framework that treats BTC distinctly from broader crypto-asset complexity. Capital allocators looking for crypto exposure with the simplest compliance and accounting profile default to Bitcoin, which compounds the flow asymmetry visible in exchange reserve data.
Ethereum’s spot ETF complex has grown, but inflow magnitudes and the lack of staking yield passthrough in the U.S. wrappers have limited its ability to match Bitcoin’s institutional gravitational pull.
How Should Traders Position Around the ETH/BTC Setup?
Traders should treat the ETH/BTC setup as a confirmed downtrend until price proves otherwise, sizing positions and selecting strikes around the assumption that rallies into resistance are sell opportunities rather than breakout setups. That posture aligns with the dominant technical structure and the underlying flow data.
What Strategies Fit a Bearish ETH/BTC View?
Several strategies fit the bearish view:
-
Short ETH/BTC pair trades via perpetual futures or by holding BTC against a short ETH leg.
-
Underweighting ETH relative to BTC in a multi-asset crypto portfolio.
-
Selling ETH-denominated call premium at resistance levels near the descending trendline and 20-month moving average.
-
Hedging long ETH spot exposure with short ETH/USD or short ETH/BTC perpetuals during anticipated rejection zones.
What Catalysts Could Flip the Trend?
Several catalysts could flip the trend and force a reassessment:
-
A spot Ethereum ETF structural upgrade that includes staking yield passthrough.
-
A major Layer-1 fee regime shift that restores sustained net deflation in ETH supply.
-
A clean monthly close above the descending trendline and 50-month moving average on convincing volume.
-
A sharp reversal in exchange reserve flows, with ETH leaving Binance and BTC re-accumulating on exchanges.
None of these catalysts is currently in play, which is precisely why the technical and flow setup continues to favor further downside.
How Does the Current ETH/BTC Setup Compare to Prior Cycles?
The current setup shares meaningful similarities with the late-stage downtrend phases of prior cycles, particularly the multi-month grind that preceded the 2019–2020 ETH/BTC cycle low. The table below summarizes the key structural parallels and differences.
|
Cycle Phase
|
Trendline Structure
|
Exchange Flow Profile
|
Narrative Backdrop
|
|
2018–2020 (prior cycle low)
|
Multi-year descending trendline rejection
|
ETH accumulating on exchanges
|
ICO unwind, ETH utility uncertainty
|
|
2022–2023 (mid-cycle)
|
Trendline retest and rejection
|
Mixed flows
|
Merge anticipation, EIP-1559 optimism
|
|
2025–2026 (current)
|
Confluence rejection, 20-MMA broken
|
ETH building on Binance, BTC draining
|
Ultra sound money cooling, BTC institutional dominance
|
The comparison underscores that the current phase combines the worst elements of prior bearish setups — a confirmed technical breakdown alongside divergent flow data and a weakening narrative — without the corresponding bullish offsets that historically marked cycle inflection points.
Conclusion
The ETH/BTC ratio is in a confirmed multi-year downtrend, and the technical structure points to further downside before a meaningful reversal becomes credible. The August 2025 rejection at the 0.382 Fibonacci and 50-month moving average confluence, combined with the subsequent break below the 20-month moving average, sets up 0.0176 BTC as the next major support — implying roughly 40% additional downside and a retest of the 2020 cycle low zone.
The technical case is reinforced by flow data showing ETH accumulating on Binance to approximately 3.62 million by May 2026 while Bitcoin exchange reserves continue to drain, and by a narrative environment where Bitcoin captures the institutional allocation story while Ethereum’s ultra sound money framing loses ground.
For traders, the implication is to treat ETH/BTC rallies as countertrend opportunities, size positions against well-defined invalidation levels at the trendline and moving average confluence, and remain alert to the catalysts — staking-enabled ETH ETFs, sustained supply deflation, or a clean technical reclaim — that could eventually force a reassessment. Until then, the path of least resistance remains lower.
FAQs
1. What does the ETH/BTC ratio actually measure?
The ETH/BTC ratio measures how many BTC one ETH is worth, expressed as a single number on the chart. A falling ratio means Ethereum is underperforming Bitcoin regardless of either asset’s individual U.S. dollar price, making it the cleanest measure of relative strength between the two largest crypto assets.
2. Can ETH outperform BTC in dollar terms even if ETH/BTC keeps falling?
Yes. ETH and BTC can both rise in U.S. dollar terms while ETH/BTC declines, as long as BTC rises faster than ETH. Traders should distinguish between absolute price performance and relative performance when constructing portfolios or pair trades.
3. Does Ethereum staking yield change the ETH/BTC trade?
Staking yield can offset some of the relative underperformance for long-term ETH holders who stake natively, but it does not change the technical structure of the ETH/BTC chart. A roughly 3% to 4% staking yield does not compensate for a 40% potential price decline against BTC over a comparable horizon.
4. How long do ETH/BTC downtrends typically last?
Historical ETH/BTC downtrends have lasted anywhere from several quarters to multiple years, with the deepest drawdowns coinciding with institutional rotation toward Bitcoin and weakening relative narratives for Ethereum. The current downtrend is consistent with the longer end of that range.
5. What is the simplest way to express a bearish ETH/BTC view?
The simplest expression is to hold BTC instead of ETH, or to trade the ETH/BTC spot pair directly by selling ETH for BTC at resistance levels. More active traders can use perpetual futures to construct leveraged pair trades, but the spot rotation remains the cleanest and lowest-complexity approach.