

"White-Haired Stock Guru" Serenity Highlights a 16.6% S&P 500 Rally Pattern Ahead of the 2026 Midterms
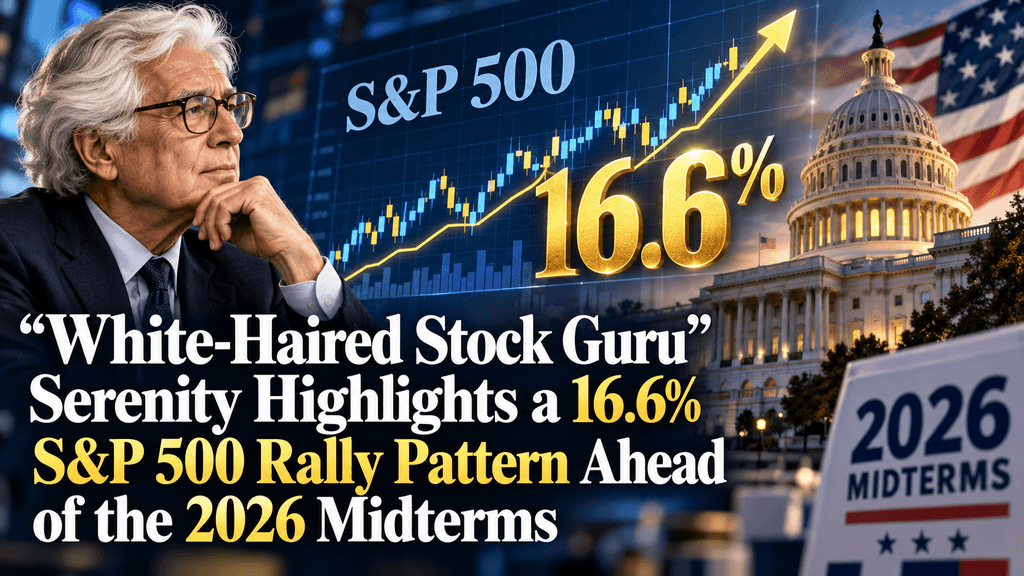
The S&P 500 has historically delivered strong returns following U.S. midterm elections, and market commentator Serenity has highlighted a particularly consistent pattern ahead of the November 3, 2026, vote. In an October 27 post, Serenity reported that the benchmark index gained an average of 16.6% across 21 historical midterm-election cycles, measured from November through the following June, with every examined period ending positively. The observation has renewed attention to potential stock market gains heading into 2027. However, independent research uses different return periods and calculation methods, while Federal Reserve policy, inflation, corporate earnings, and market valuations remain important factors influencing the outlook for U.S. equities.
Serenity Highlights 16.6% Average S&P 500 Rally Across 21 Historical Midterm Election Cycles
Market commentator Serenity, known as the "White-Haired Stock Guru," highlighted a historical S&P 500 rally pattern ahead of the 2026 U.S. midterm elections. In an October 27 social media post, Serenity reported that the benchmark index had generated positive returns in all 21 examined midterm-election cycles, averaging a 16.6% gain from November of the election year through the following June. With the next U.S. midterm elections scheduled for November 3, the observation has renewed interest in the stock market's historical performance during this period and whether the pattern could continue into 2027.
What Serenity's 21-Cycle S&P 500 Rally Record Shows
The historical analysis covers 21 midterm-election cycles from 1942 through 2022, focusing on S&P 500 performance during the November–June period following each election. Serenity's reported 16.6% figure represents the average return across these observations, rather than a consistent gain recorded in every cycle. Although all 21 periods reportedly ended with positive returns, individual years experienced different market conditions and levels of volatility. The pattern describes the index's performance between selected dates, not an uninterrupted upward movement throughout those months.
U.S. midterm elections occur halfway through a president's four-year term, when voters elect all 435 members of the House of Representatives and approximately one-third of the Senate. Changes in congressional representation can influence market expectations surrounding taxation, government spending, and future economic policy. However, the historical gains cannot be attributed solely to election outcomes, as corporate earnings, interest rates, economic growth, and investor sentiment also affect equity prices. The relationship between midterm elections and stock market performance therefore reflects a historical association rather than a proven cause-and-effect relationship.
Serenity Highlights Stronger Historical Performance Among High-Beta Stocks
Serenity also suggested that high-beta stocks historically outperformed the broader S&P 500 during comparable post-midterm periods. Market beta measures how sensitively a stock's returns move relative to a benchmark index. Stocks with a beta above 1 generally exhibit greater sensitivity to broad market fluctuations, potentially delivering larger gains when equities advance but also experiencing steeper losses during market declines. This characteristic makes the historical observation relevant to investors examining differences between individual stocks and the overall index.
However, Serenity's post did not provide a detailed dataset identifying the high-beta stocks examined, their average returns, or the methodology used to measure their outperformance. Without those details, the claim remains an attributed observation rather than an independently established finding. Serenity also raised the possibility that the 2026 election cycle could break the historical pattern, acknowledging uncertainty surrounding future performance. The reported record offers useful historical context, but it does not establish that the S&P 500 or more volatile equities will deliver similar returns in the months ahead.
Historical S&P 500 Returns After Midterms Reveal Key Differences in Rally Patterns and Calculations
Historical S&P 500 returns following U.S. midterm elections show a generally positive pattern, but the reported average gains vary depending on the measurement period, historical sample, and calculation method. Research from BNY Investments, J.P. Morgan Asset Management, and BlackRock supports stronger equity performance after past midterms, although their findings range from approximately 14% to 17%. Understanding these differences is essential when evaluating Serenity's reported 16.6% rally pattern, particularly because six-month returns, 12-month gains, and dividend-inclusive performance measure different outcomes.
Comparing Historical S&P 500 Returns Across Midterm Election Studies
In research published in May 2026, BNY Investments reported that the S&P 500 generated an average 16.6% price return during the 12 months following U.S. midterm elections since the 1950s. Similarly, J.P. Morgan Asset Management's October 2026 analysis found positive 12-month returns after every midterm election from 1950 through 2022, averaging approximately 15%. J.P. Morgan also identified a 6.6% average fourth-quarter return during midterm election years. These findings support the historical strength of post-election equity performance, but they use different observation periods from Serenity's November–June comparison. The matching 16.6% figure in BNY's research therefore should not be interpreted as independent confirmation of Serenity's exact calculation.
A separate BlackRock analysis, published in October 2026, found that the S&P 500 delivered an average 14.1% total return during the six months following midterm elections since 1970, compared with 5.7% over equivalent periods in non-midterm years. BlackRock also observed that market recoveries historically began around 22 trading days before election day, suggesting that changes in political uncertainty and investor expectations may influence stock prices before official results become available. However, these averages do not establish elections as the direct cause of subsequent gains. Economic growth, corporate profitability, monetary policy, and prevailing valuations can affect returns throughout the same period.
How Return Windows, Dividends, and Historical Samples Change the Results
The calculation method can materially change the reported strength of a post-midterm S&P 500 rally. For example, an independent historical analysis by SV News found an average 16.5% price gain across 21 midterm cycles from 1942 through 2022, measuring returns from the final October trading close to the following June's closing level. This differs slightly from Serenity's reported 16.6% average and illustrates how starting dates, ending dates, and data sources can produce different results. Price returns measure changes in the index level, while total returns also account for reinvested dividends, making direct comparisons inappropriate without consistent definitions. Historical sample selection matters as well: the same SV News analysis identified negative October–June returns following the 1930 and 1938 midterms, demonstrating that the positive record depends partly on its starting year. Another important qualification comes from S&P Dow Jones Indices, which identifies March 4, 1957, as the S&P 500's official launch date and classifies earlier index performance as hypothetical back-tested history. These distinctions explain why historical election-cycle statistics should be evaluated using clearly defined timeframes, comparable return measures, and transparent datasets rather than treating a single average as a universal market rule.
2026 Midterm Elections: Federal Reserve Policy, Inflation, and Market Catalysts Shaping the S&P 500
The S&P 500's performance surrounding the 2026 U.S. midterm elections will depend heavily on Federal Reserve policy, inflation trends, corporate earnings, and changing economic expectations. With the November 3 elections approaching, investors are assessing whether resilient economic growth can support stock valuations despite elevated borrowing costs and persistent price pressures. The benchmark index closed at 7,743.98 on October 28, 2026, gaining 0.28% after the Federal Reserve maintained interest rates. These developments provide important context for evaluating U.S. stock market conditions beyond historical election-cycle patterns. Investors are also examining how monetary policy and corporate profitability could influence equity market performance heading into 2027.
Federal Reserve Holds Interest Rates at 3.75%–4.00%
The Federal Reserve maintained its federal funds target range at 3.75%–4.00% on October 28, 2026, following a 25-basis-point increase in September. The Federal Open Market Committee approved the decision in a 10–2 vote, with two policymakers favoring another quarter-point increase. The central bank described economic activity as expanding at a strong pace, supported by resilient domestic spending, productivity growth, and robust capital investment. However, policymakers also acknowledged that inflation remained elevated, leaving the direction of future interest-rate decisions dependent on incoming economic data. The divided vote also reflected differences among policymakers over the appropriate response to persistent inflation and the strength of economic activity.
Interest-rate policy directly influences S&P 500 valuations through corporate financing costs, Treasury yields, and expectations for future earnings. Higher borrowing costs can discourage business investment and reduce the present value of projected profits, particularly for growth companies whose valuations depend heavily on earnings expected further into the future. Conversely, stable borrowing conditions can help businesses plan spending and manage debt obligations. The October rate hold provided continuity in monetary policy, but it did not signal an imminent shift toward lower rates. Investors therefore remain focused on whether economic growth can sustain corporate profitability while financial conditions stay relatively restrictive. Changes in bond yields and expectations for future Federal Reserve decisions could also influence equity valuations even when the policy rate remains unchanged.
September Inflation Data Highlights Persistent Price Pressures
The U.S. Bureau of Labor Statistics reported that the Consumer Price Index increased 3.7% year over year in September 2026, compared with 3.4% in August. Consumer prices rose 0.6% during September, while core inflation, which excludes food and energy, reached 2.6% annually. Energy was a significant contributor, with energy prices increasing 20.4% over the preceding 12 months and gasoline prices rising 9.1% during September alone. These figures indicate that inflationary pressures remained uneven across spending categories, complicating the outlook for household purchasing power and corporate operating costs. Differences between headline and core inflation also highlight how volatile energy prices can affect overall consumer price trends without reflecting equivalent increases across every category.
Inflation affects the S&P 500 through several channels, including consumer demand, profit margins, and expectations for monetary policy. Businesses facing higher transportation, energy, and production expenses may experience reduced profitability unless they can pass additional costs to customers. At the same time, persistent inflation can keep Treasury yields elevated, increasing competition between equities and fixed-income investments. Companies with stronger pricing power may be better positioned to protect margins than businesses operating with limited flexibility. The Federal Reserve's 2% inflation objective is based on the Personal Consumption Expenditures price index rather than CPI, making the distinction important when evaluating how consumer inflation figures may influence future policy decisions. These indicators differ in their expenditure weights and calculation methods, so investors typically examine both when assessing underlying inflation trends and the outlook for interest rates.
Corporate Earnings, Stock Valuations, and Election-Related Market Expectations
Corporate earnings provide another important measure of whether the S&P 500 can maintain its performance around the 2026 midterms. FactSet's October 23 earnings update showed that 24% of S&P 500 companies had reported third-quarter results, with 83% exceeding earnings-per-share estimates. However, aggregate earnings exceeded expectations by only 2.1%, below the five-year average positive earnings surprise of 7.5%. The index's forward 12-month price-to-earnings ratio stood at 18.7, compared with its five-year average of 19.8. These figures suggest that earnings expectations remained important to market valuations, while the smaller-than-usual earnings surprises highlighted the need to assess the strength of results beyond the percentage of companies beating forecasts. An earnings beat also reflects performance relative to analyst estimates and does not necessarily indicate stronger year-over-year profit growth, making revenue trends and management guidance equally important.
The November 3 midterm elections add another source of uncertainty through potential changes in congressional representation and legislative priorities. Investors may reassess expectations for taxation, federal spending, industry regulation, and fiscal policy as election results become available. However, proposed policy changes do not necessarily become law, and market reactions can reflect expectations long before implementation. Meanwhile, technology-sector earnings, artificial intelligence infrastructure spending, and broader corporate investment remain relevant drivers of equity performance. The interaction between these business fundamentals, monetary policy, and fiscal expectations will help determine how the S&P 500 responds to developments surrounding the 2026 elections, rather than any single political event determining the market's direction. Changes in congressional control could influence the legislative agenda, although the timing and economic impact of future policies would depend on negotiations, implementation, and prevailing business conditions.
S&P 500 Outlook After the 2026 Midterms: High-Beta Stocks, Rally Potential, and Investment Risks
The S&P 500 outlook following the 2026 U.S. midterm elections presents opportunities for further gains alongside significant market risks. Investors are watching whether corporate profit growth, technology investment, and improving market participation can sustain equity performance into 2027. Higher-beta stocks could benefit disproportionately from stronger risk appetite, although their sensitivity to market declines creates additional exposure. The direction of the next stock market rally will depend on earnings expectations, financial conditions, and investor confidence rather than historical election patterns alone.
Corporate Earnings Growth and Market Breadth Could Support Further Gains
Stronger corporate profitability could provide an important foundation for an S&P 500 rally after the midterm elections. FactSet's October 23, 2026, earnings report showed that analysts expected fourth-quarter S&P 500 earnings to grow 29.2% year over year, reflecting continued optimism about business performance. However, these projections remain subject to revisions as companies release financial results and update their guidance. A more sustainable market advance would also benefit from broader participation across sectors such as industrials, financials, healthcare, and consumer discretionary stocks, rather than relying primarily on large technology companies. Improving market breadth, which measures how many stocks participate in an advance, can indicate that positive earnings expectations extend across more businesses. Conversely, weakening earnings forecasts or gains concentrated in a small number of companies could make the broader index more vulnerable to corrections.
High-Beta Stocks and Growth Sectors Face Greater Volatility
Higher-beta equities could experience larger price movements if investor confidence strengthens following the 2026 midterms. Growth-oriented technology companies, semiconductor manufacturers, and economically sensitive businesses may benefit from stronger demand, expanding investment, and improving earnings expectations. However, individual stocks within these sectors have different market sensitivities, and high beta alone does not guarantee superior returns. Greater exposure to market fluctuations can magnify losses when borrowing costs increase, earnings disappoint, or investors reduce their willingness to take risks. Company fundamentals, debt levels, cash flow, and valuations therefore remain important when assessing potential opportunities. Investors comparing high-beta stocks with the broader S&P 500 should distinguish between the possibility of higher returns and the additional volatility required to pursue them.
Market Concentration and Valuation Risks Could Challenge the Rally
The S&P 500's concentration in a relatively small group of large companies introduces another important consideration for its post-election outlook. S&P Dow Jones Indices data showed that the ten largest constituents represented approximately 37.8% of the index's weight as of August 31, 2026. This concentration means that changes in the share prices or earnings expectations of major technology companies can materially influence the index even when many other stocks perform differently. Artificial intelligence infrastructure spending remains a significant growth opportunity, but questions surrounding investment returns, rising capital expenditure, and future profitability could influence valuations. Additional risks include higher Treasury yields, geopolitical tensions, energy price volatility, and weaker consumer demand. A market rally supported by improving earnings across multiple sectors would have different underlying characteristics from one driven mainly by valuation increases in a handful of heavily weighted stocks.
Key Market Indicators to Watch Through June 2027
The period following the November 2026 midterms will provide several opportunities to assess whether market conditions support further S&P 500 gains. Fourth-quarter earnings releases, updated 2027 profit forecasts, Treasury yield movements, and future Federal Reserve decisions will help investors evaluate the strength of the economic outlook. Market breadth, earnings estimate revisions, and performance differences between growth and defensive sectors can also indicate whether risk appetite is strengthening or weakening. Positive earnings revisions alongside stable financial conditions could support equity valuations, while disappointing profits or renewed inflation pressures could increase downside risks. The June 2027 endpoint highlighted in historical post-midterm analysis provides a useful comparison period, but it is not a deadline for a rally or a reliable price target. Investors should assess incoming economic and corporate data throughout this period rather than assume that historical market behavior will determine future returns.
Conclusion
Serenity's reported 16.6% average S&P 500 gain across 21 historical midterm-election cycles highlights a notable pattern in U.S. equity market performance. Independent financial research supports a broader tendency toward positive post-midterm returns, although differences in historical samples, measurement periods, and dividend treatment produce varying results. These findings provide useful context for the 2026 elections but cannot establish whether the same pattern will continue. Looking ahead, the S&P 500's performance will depend on corporate earnings, Federal Reserve policy, inflation, stock valuations, and investor confidence. Stronger profitability and broader market participation could support further gains, while persistent price pressures, higher borrowing costs, and market concentration may increase volatility. The historical record offers a valuable reference point, but developments in the economy and financial markets will ultimately shape the index's performance through 2027.
FAQs
Are historical S&P 500 returns after midterm elections adjusted for inflation?
Not necessarily. Most historical S&P 500 studies report nominal returns, which measure investment gains without accounting for changes in purchasing power. Inflation-adjusted, or real, returns show how much an investment's value increased after considering rising consumer prices. Investors should check whether historical performance figures include inflation adjustments before comparing returns across different decades.
How does the equal-weight S&P 500 differ from the traditional index?
The traditional S&P 500 uses market-capitalization weighting, giving larger companies greater influence over index performance. The S&P 500 Equal Weight Index assigns approximately 0.2% to each constituent at quarterly rebalancing. Comparing the two helps investors assess whether market gains are concentrated in major companies or distributed more broadly across U.S. large-cap stocks.
Why might an S&P 500 ETF deliver different returns from the index?
An S&P 500 exchange-traded fund aims to track the benchmark's performance, but its returns may differ because of management fees, trading expenses, tracking error, and dividend treatment. ETF market prices can also temporarily differ from their underlying net asset values. Investors should compare equivalent return measures and periods when evaluating an ETF against historical index performance.
Do U.S. midterm election results immediately change tax and economic policies?
No. Midterm elections determine congressional representation, but most changes to federal tax and spending laws require legislation to pass both chambers of Congress and receive presidential approval, unless enacted through a constitutional alternative. Political expectations can influence financial markets before legislation takes effect, meaning stock prices may respond to anticipated policies that are later modified or never implemented.
What does maximum drawdown reveal about historical S&P 500 rallies?
Maximum drawdown measures the largest percentage decline from a peak to a subsequent low during a specified period. It helps investors understand the downside experienced within a historical market cycle, even when the final return is positive. Comparing drawdowns alongside average gains offers a more complete assessment of market risk than examining the ending return alone.
Can the S&P 500 rise even when U.S. economic growth slows?
Yes. Stock prices reflect expectations about future company earnings, discount rates, and financial conditions rather than economic growth alone. The S&P 500 can advance during slower economic growth if investors anticipate improving profitability or more supportive conditions ahead. However, a sustained deterioration in business earnings or financial stability can weaken those expectations and increase volatility.
Disclaimer: This general market information, possibly from third-party, commercial, or sponsored sources, is provided for reference and educational purposes only and does not constitute financial or investment advice, an offer, solicitation, or guarantee. We disclaim liability for its accuracy, completeness, reliability, and any resulting losses. Investments/trading are risky; past performance doesn’t guarantee future results. Users should research, judge prudently, and take full responsibility. For further details, please consult KuCoin’s Terms of Use and Risk Disclosure.