
KuCoin Ventures Weekly Report: Decoding Strategy's Preferred Stock Depegging and Liquidity Divergence Under Macro Rate Repricing
2026/06/23 10:55:00

1. Weekly Market Highlights
Strategy's Capital Flywheel Faces a Stress Test: The Long-Short Battle and Market Divergence Behind STRC's Depegging
Recently, Strategy's (MSTR) core financing tool, the Stretch (STRC) preferred stock, has been facing a severe market pricing test.
By design, STRC is an income-generating preferred stock intended to trade long-term around its $100 par value. Its mechanism aims to stabilize the price near par by dynamically adjusting the dividend rate; the effective dividend rate even reached around 12.9% at one point, making it highly attractive to the market. Over the past few weeks, however, this peg has begun to loosen. STRC first dropped to around $89, then dipped further intraday to $85, and even momentarily fell below $83, deviating significantly from the $100 par value it was supposed to maintain.
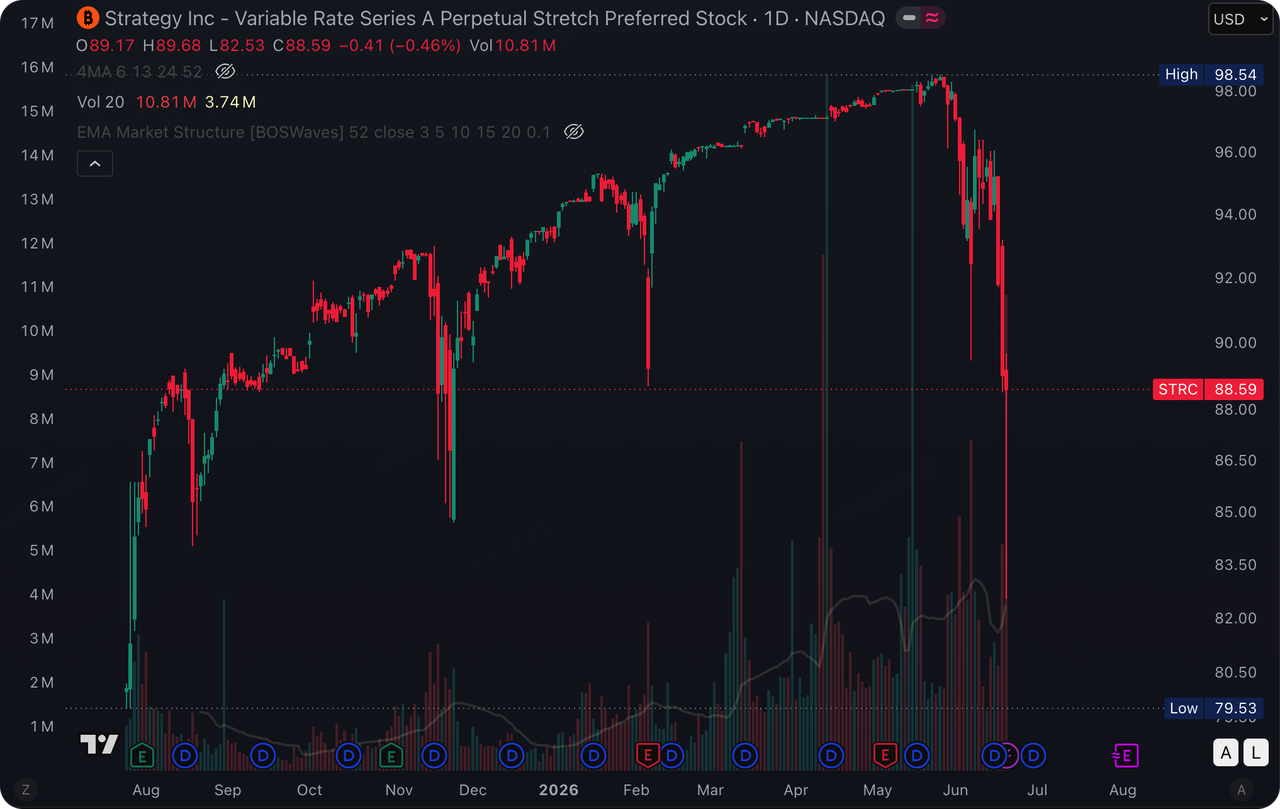
Data Source: TradingView
The depegging of STRC has a very direct impact on Strategy: its financing flywheel has started to stall. In the past, as long as STRC traded near or above its $100 par value, Strategy could continue to sell STRC through its at-the-market (ATM) offering and use the raised funds to buy Bitcoin. The core of this mechanism is simple: the market is willing to buy high-yield preferred stocks at a price close to par, and after receiving the cash, Strategy continues to accumulate BTC, further reinforcing the narrative of "continuously buying Bitcoin reserves."
The market's primary concern is Strategy's cash flow pressure. STRC's dividend rate is dynamically adjusted based on its market price. The weaker the price, the higher the yield compensation demanded by the market. Currently, STRC's nominal dividend rate has risen to 11.5%, and the market is discussing whether it might be further raised to around 11.75% or 12% in the future. For investors, this means higher returns; for Strategy, it means a heavier burden of cash distributions.
What has made the market even more sensitive recently is that Strategy, which once touted "never selling Bitcoin," sold 32 Bitcoins for the first time in late May of this year, raising about $2.5 million to pay for preferred stock distributions. Therefore, the market's further concern is that if the financing environment continues to tighten and the pressure for preferred stock distributions continues to rise, Strategy might be forced to sell more Bitcoin. This could cause Bitcoin's price to drop further, potentially turning into a death spiral.
Granted, Strategy's financing model does not solely rely on STRC. The common stock premium, convertible bonds, cash reserves, and other preferred stock tools all jointly support this financing structure. The problem is that these channels are highly correlated. A drop in Bitcoin will depress the net asset value; a drop in MSTR's stock price will weaken its common stock financing ability; STRC falling below par will raise the financing cost of preferred stocks; and once cash reserves are used to repurchase debt or pay dividends, the safety cushion becomes thinner.
However, there is another explanation in the market: this round of STRC's decline may have clear characteristics of a leverage liquidation cascade. Over the past few months, STRC maintained a tight range of $97 to $100 for a long time, giving some investors the illusion that it was a "low-volatility, high-yield" wealth management product. To amplify returns, some capital may have piled high leverage onto this seemingly stable asset. As long as the price remains stable, this trade feels very comfortable; but once it falls below the stable range, the leverage structure quickly bites back.
Facing the current depegging situation, market analysis points out that Strategy has a diverse potential toolkit to cope with this stress test and is not entirely helpless:
-
Adjusting the dividend rate to attract capital: The company may further increase the dividend rate in the upcoming window (e.g., June 30)—market expectations suggest an increase to 11.75% or even 12%—to boost STRC's effective yield. This would attract long-term allocation funds buying the dip, forming price support for STRC.
-
Market buybacks and arbitrage: Given that its common stock MSTR still trades at a premium to its net asset value, Strategy could also choose to issue common stock or bring in traditional debt financing to buy back STRC at a discount on the secondary market. Once the price returns toward the $100 mark in the future, it can be reissued, and the difference can be used directly to accumulate more Bitcoin, creating an accretive effect for common stockholders. Will arbitrage capital be willing to re-enter? If STRC's discount is deep enough, but the market believes it will eventually return to par, arbitrage capital could become a significant force in repairing the price.
-
Risk mitigation at the rule level: According to the design of STRC's terms, Strategy is allowed to gradually lower the dividend rate to ease cash flow pressure in extremely unfavorable situations.
STRC's price volatility has also further educated the market: it shouldn't simply be seen as a substitute for high-yield short-term debt, much less a "stablecoin." STRC is closer to a digital credit product embedded with complex terms, tied to four variables: Strategy's financing capability, MSTR's premium relative to its Bitcoin net asset value, the price of Bitcoin, and the market's trust in Saylor's narrative. With a tailwind, it can serve as an efficient financing tool for Strategy to accumulate Bitcoin; facing headwinds, it will conversely amplify the pressure within the capital structure.
Going forward regarding Strategy, there are four key variables worth our attention: whether STRC can return to around $100; whether the company will continue to sell Bitcoin; how long the cash reserves can cover preferred stock and debt distributions; and whether MSTR's common stock can maintain its premium relative to its Bitcoin net asset value.
If these variables gradually recover, this current event will look more like a stress test following a leverage liquidation cascade; if they continue to deteriorate, the market will re-evaluate the sustainability of Strategy's entire capital flywheel.
2. Weekly Selected Market Signals
U.S.–Iran Talks Ease Risk Premiums, the Fed’s Hawkish Debut Reprices Rate Path, AI and Crypto Markets Diverge
Last week, the key variables for global markets were the shift in U.S.–Iran tensions from “war and energy shock” toward a ceasefire/nuclear negotiation framework, and the stronger anti-inflation signal delivered by the Federal Reserve’s June meeting under new Chair Kevin Warsh. At the beginning of last week, expectations around a U.S.–Iran peace agreement and the reopening of the Strait of Hormuz prompted markets to quickly price down the risk of energy supply disruptions, leading to lower oil prices and a rebound in risk assets. However, after the FOMC kept rates unchanged in the middle of last week, the dot plot and Warsh’s communication style led markets to reprice medium- to long-term rate-hike risks. By the end of last week, although U.S.–Iran negotiations had made some progress under the mediation of Qatar and Pakistan, with all parties agreeing to work toward a final agreement within 60 days, the process still saw repeated setbacks, including threatening remarks from Trump and the temporary walkout of Iranian representatives. This suggests that geopolitical risk has not fully disappeared, but has shifted from an immediate war shock to a longer-term source of negotiation uncertainty.
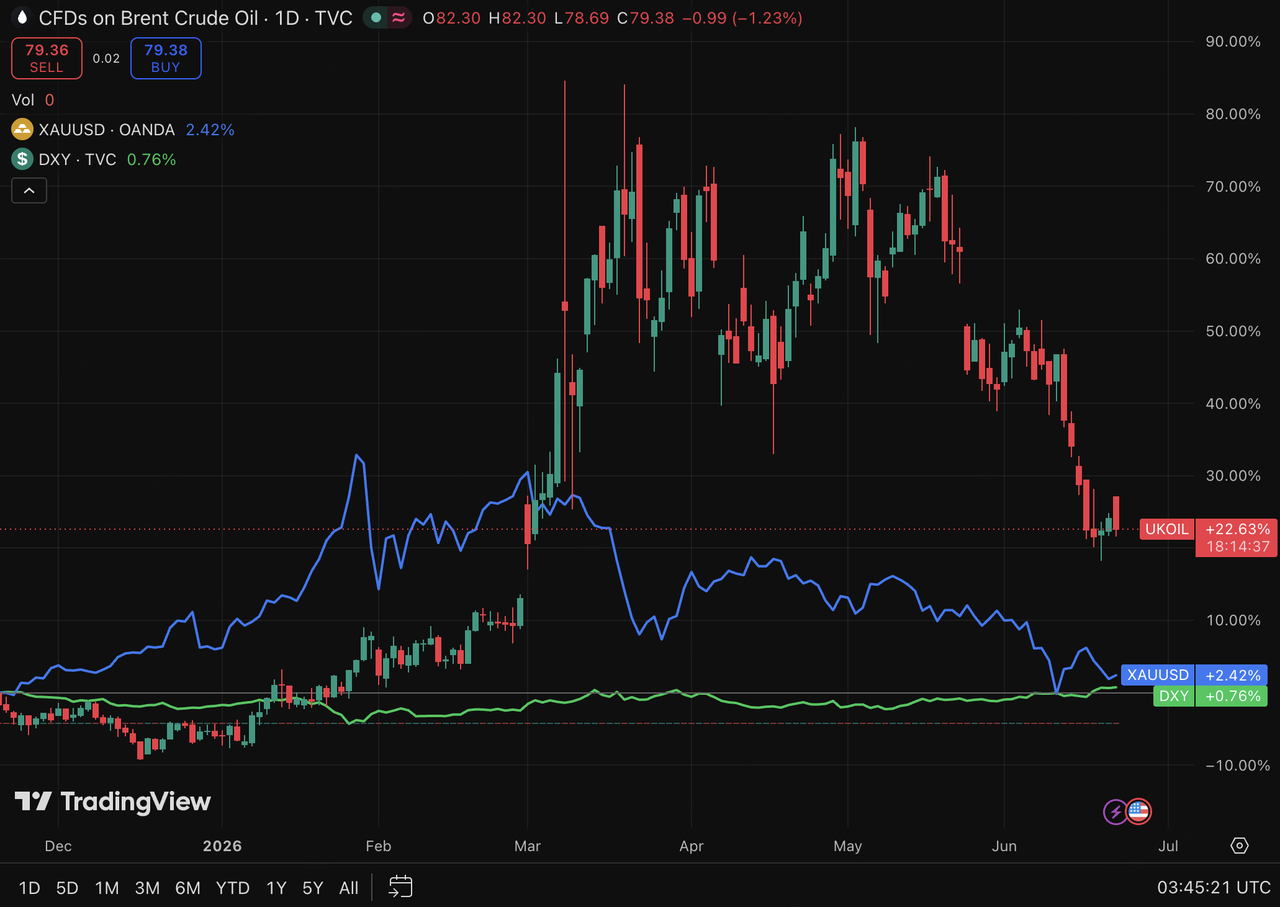
This shift was first reflected in energy, gold, and the U.S. dollar. Driven by expectations of a U.S.–Iran agreement, oil prices fell sharply from previous highs last week. WTI crude dropped around 10.6% on the week to the USD 75–76 per barrel range, while Brent crude retreated to around USD 80 per barrel. Lower oil prices helped ease near-term energy inflation pressure and provided a recovery window for risk assets. However, as of the end of last week, uncertainty around the Strait of Hormuz had not fully cleared, indicating that the energy risk premium has not completely disappeared. In gold, marginal safe-haven demand faded, while a stronger U.S. dollar and higher Treasury yields reduced the appeal of non-yielding assets, sending gold down around 1% last week. Overall, commodity markets were not simply shifting back toward risk appetite; rather, they were rebalancing between fading war premiums and renewed policy-rate repricing.
A stronger U.S. dollar and higher Treasury yields formed another important market theme last week. The FOMC kept the target rate range unchanged at 3.50%–3.75%, in line with market expectations. However, new Fed Chair Warsh deliberately reduced forward guidance, did not submit his own dot-plot projection, and announced the creation of multiple reform working groups, increasing uncertainty around the Fed’s future communication and policy path. The dot plot showed that the 2026 median rate projection corresponds to one rate hike, while policymakers remain clearly divided: some officials support a rate hike this year, while others prefer to stay on hold or even cut rates. As a result, the market discussion shifted from “whether rates will be cut in the near term” to “whether a preventive rate hike could evolve into a more persistent tightening cycle.” For risk assets, although lower oil prices eased short-term inflation pressure, Warsh’s first meeting reinforced market pricing around higher-for-longer rates and a possible upward shift in the far-end rate path.
In equities, U.S. stocks broadly recovered last week, but gains were concentrated in AI, semiconductors, and selected high-growth sectors, with clear internal divergence across the market. Supported by optimism around a U.S.–Iran agreement, major indices rallied strongly last Monday, with the Nasdaq rising more than 3% and the S&P 500 gaining around 1.7%. The market then pulled back and traded sideways around the FOMC meeting. On a weekly basis, the Nasdaq rose around 2.4%, while the S&P 500 and the Dow also gained close to 1%. However, the advance was mainly driven by chips, AI infrastructure, biotech, and a small number of strong growth stocks. In other words, U.S. equities did not re-enter a broad risk-appetite expansion phase. Instead, they staged a partial recovery from earlier geopolitical shocks and rate pressure, while investors continued to screen for AI earnings delivery, post-FOMC rate-path resilience, and valuation durability.
Japanese and Korean markets also reflected the coexistence of AI supply-chain strength and macro pressure. In Japan, AI and semiconductor investment expectations continued to provide support, with the Nikkei 225 remaining in a high-level consolidation range last week as capital continued to chase Japanese semiconductor equipment, industrial automation, and AI-related supply-chain exposure. However, yen weakness and expectations for Bank of Japan rate hikes also made the market more sensitive to valuation and foreign capital flows. In South Korea, the KOSPI remained near elevated levels after previous large swings, with semiconductors and memory chips still acting as the main support. However, KRW weakness, foreign flows, and global tech-factor rotation could continue to amplify short-term volatility. Overall, the industrial logic behind Japanese and Korean markets has not been broken, but the trading environment has shifted from a simple AI supply-chain uptrend to a high-level consolidation phase that is more sensitive to FX, rates, and foreign investor behavior.
In crypto markets, BTC did not meaningfully benefit from the recovery in U.S. technology stocks last week. Instead, it remained under pressure amid ETF outflows, macro rate pressure, and relatively weak crypto-native liquidity.
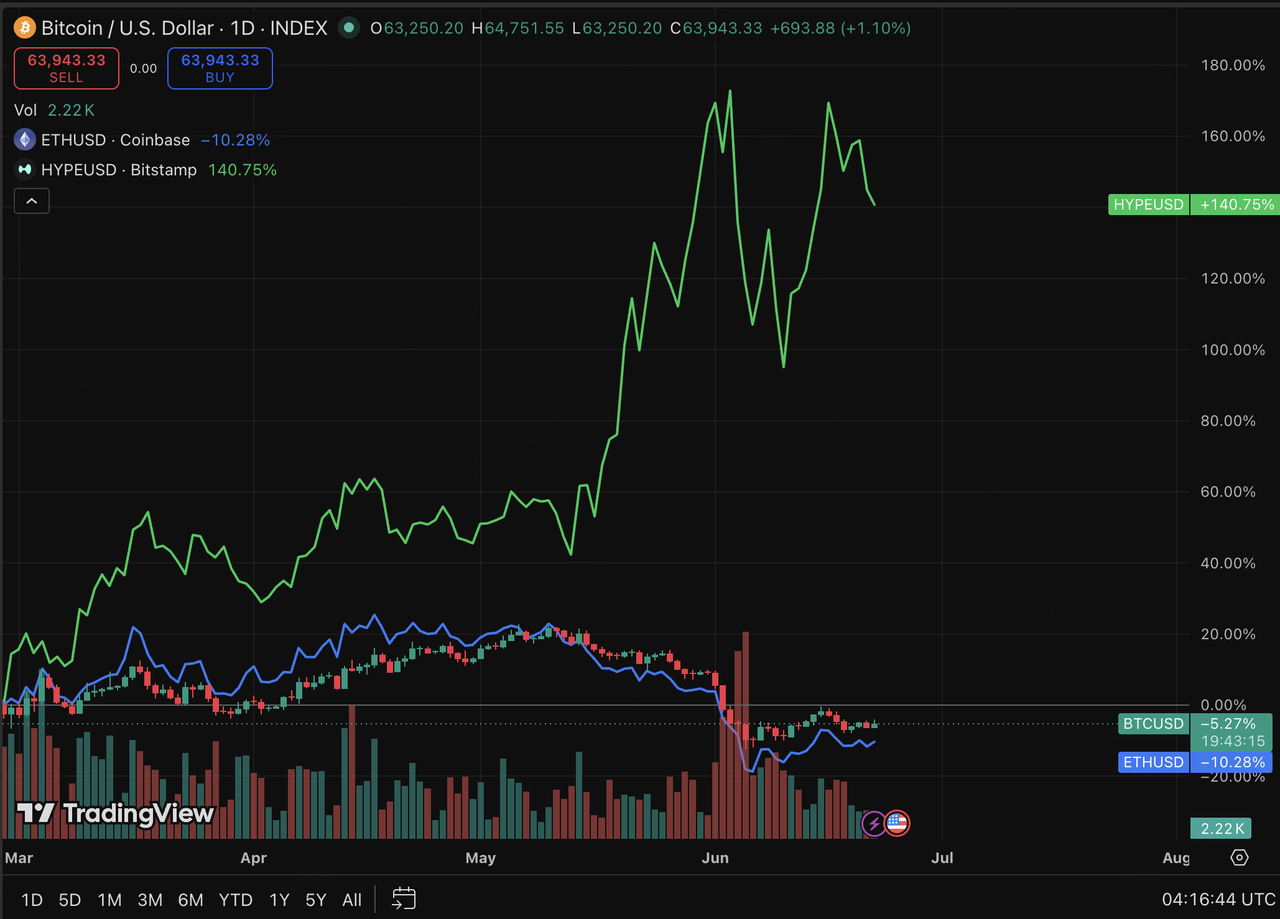
BTC traded in the USD 62,000–65,000 range last week and fell around 4% on the week, underperforming the Nasdaq and selected AI-related assets. ETH stayed around USD 1,700, with similarly limited rebound momentum. BTC still has institutional allocation attributes, but in an environment where ETF flows have not returned to sustained inflows, stablecoin supply has only slightly stabilized, and the far-end rate path has been repriced higher, it is more likely to behave as a high-beta risk asset in the short term rather than an independent safe-haven asset.
It is worth noting that pressure on major crypto assets does not mean all crypto assets moved lower at the same pace. HYPE remained notably stronger than BTC and ETH last week, supported by Hyperliquid’s trading activity, protocol revenue, and continued market attention. BNB, by contrast, did not form a clear independent trend and mostly moved in line with the broader market. Therefore, the current crypto market is better described as “major assets still constrained by ETF flows and macro funding conditions, while a small number of assets with revenue, trading-volume growth, or ecosystem catalysts maintain local strength,” rather than a broad recovery in overall crypto risk appetite.
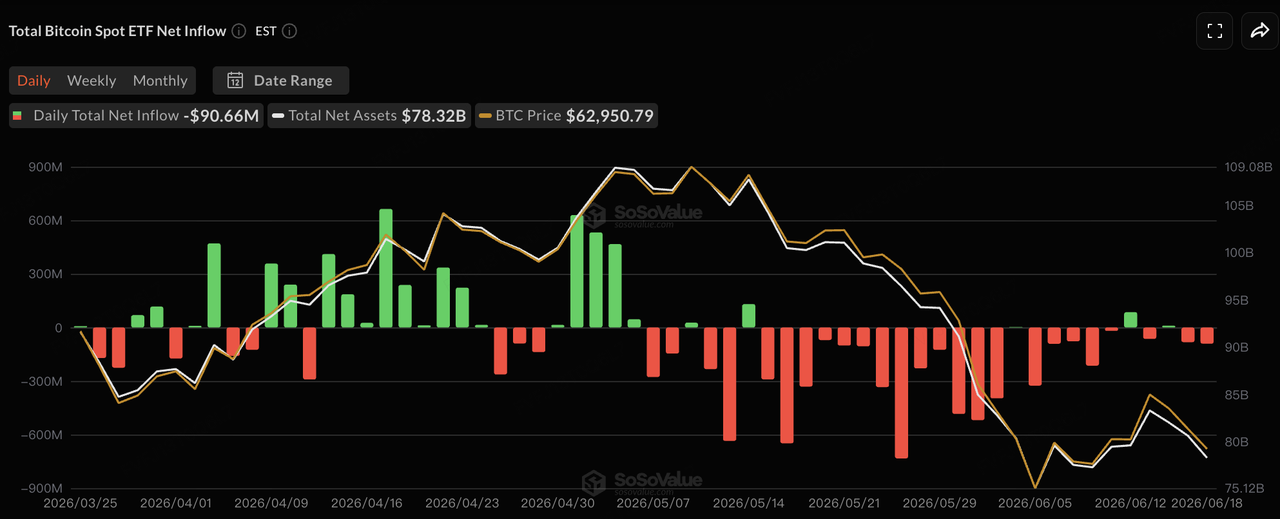
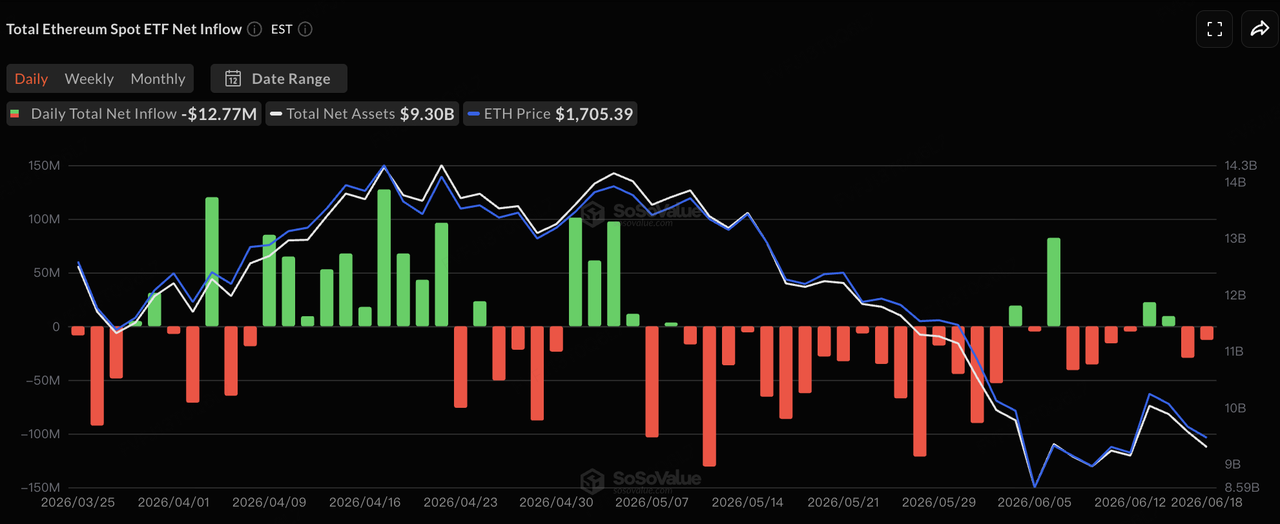
Data Source: SoSoValue
In terms of ETF flows, based on SoSoValue data, U.S. spot BTC ETF flows remained weak last week, while ETH ETF flows were closer to neutral. Based on disclosed trading-day data, BTC ETFs saw a net outflow of around USD 64.09 million on June 15, a small net inflow of around USD 10.06 million on June 16, and net outflows of around USD 82.16 million and USD 90.66 million on June 17 and 18, respectively. Since U.S. markets were closed on June 19 for Juneteenth, BTC ETFs recorded around USD 230 million in net outflows on a weekly basis. This suggests that selling pressure has eased compared with the large outflows of the previous week, but institutional capital has not yet resumed sustained buying.
For ETH ETFs, June 15 and 16 still saw small net inflows, but flows turned negative again from June 17 to 18, leaving the week roughly around a small net outflow. Overall, BTC and ETH ETFs remain important institutional gateways into crypto assets, but their marginal flow conditions have not returned to a strong inflow phase. Compared with the previous period of consecutive large outflows, ETF pressure eased last week. However, compared with the renewed capital rotation into U.S. AI and semiconductor stocks, crypto ETFs have yet to show a clear capital-attraction effect. In the short term, whether BTC can recover will still depend on whether ETF buying regains consistency, whether stablecoin supply returns to expansion, and whether macro rate pressure eases.
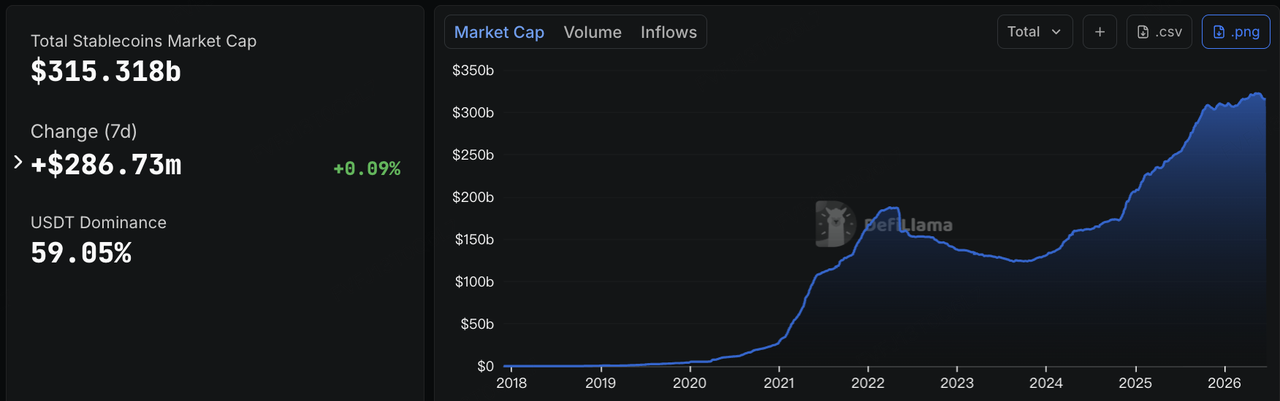
Data Source: DeFiLlama
On stablecoins, DeFiLlama data shows that as of June 22, total stablecoin market capitalization was around USD 315.3 billion, up approximately USD 287 million over seven days, or about 0.09%. USDT’s market share was around 59.05%. Unlike the clear contraction in stablecoin supply during the previous week, on-chain dollar liquidity broadly stabilized last week. However, incremental growth remained weak, indicating that on-chain capital has not continued to exit aggressively, but has not yet meaningfully rebuilt risk exposure either.
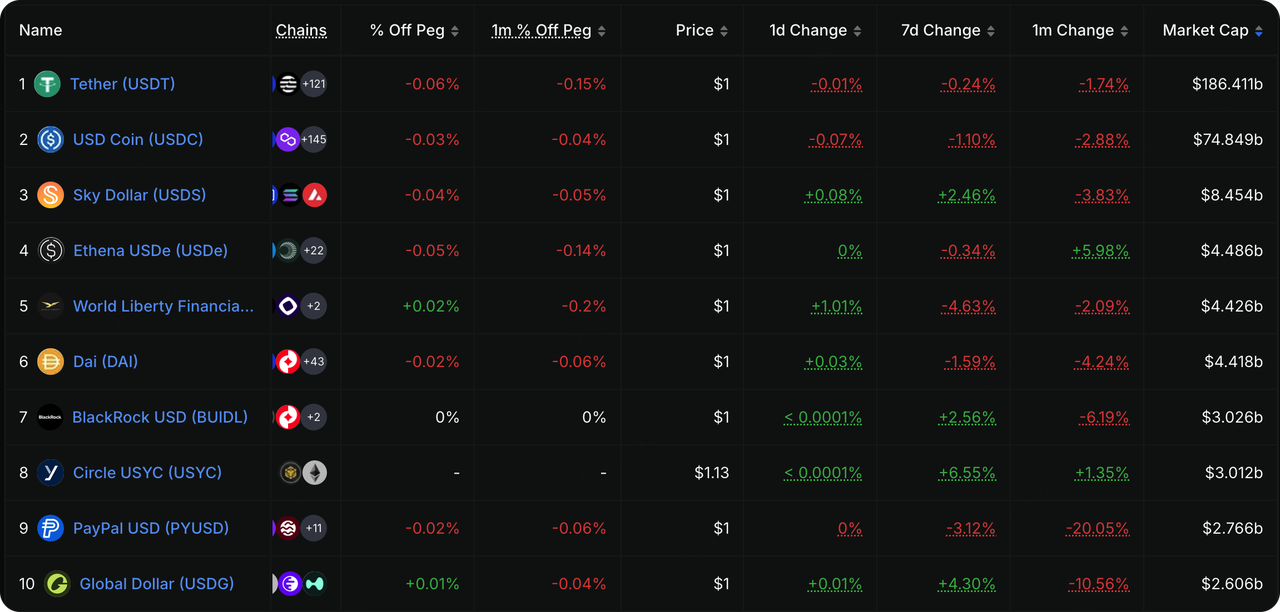
Structurally, USDT fell slightly by around 0.12% over seven days, while USDC rose slightly by around 0.06%, suggesting that mainstream trading and settlement liquidity remained broadly stable. USDS fell around 3.47% over seven days, continuing the pattern that ecosystem-oriented stablecoins tend to contract more easily during volatile market conditions. USD1 and USDG rose around 9.27% and 6.74%, respectively, reflecting continued expansion in compliance-oriented stablecoins and channel-driven distribution networks. USDe was broadly flat over seven days, suggesting that the expansion of yield-bearing stablecoins has slowed, but without meaningful redemption pressure. BUIDL and USYC maintained modest growth, reflecting continued resilience in institutional on-chain cash management and tokenized money market fund demand. Overall, the stablecoin market shifted from the previous week’s “total supply contraction” to “total supply stabilization with structural divergence.” However, capital remains biased toward high-certainty dollar instruments and has not yet fully flowed back into high-beta crypto assets.
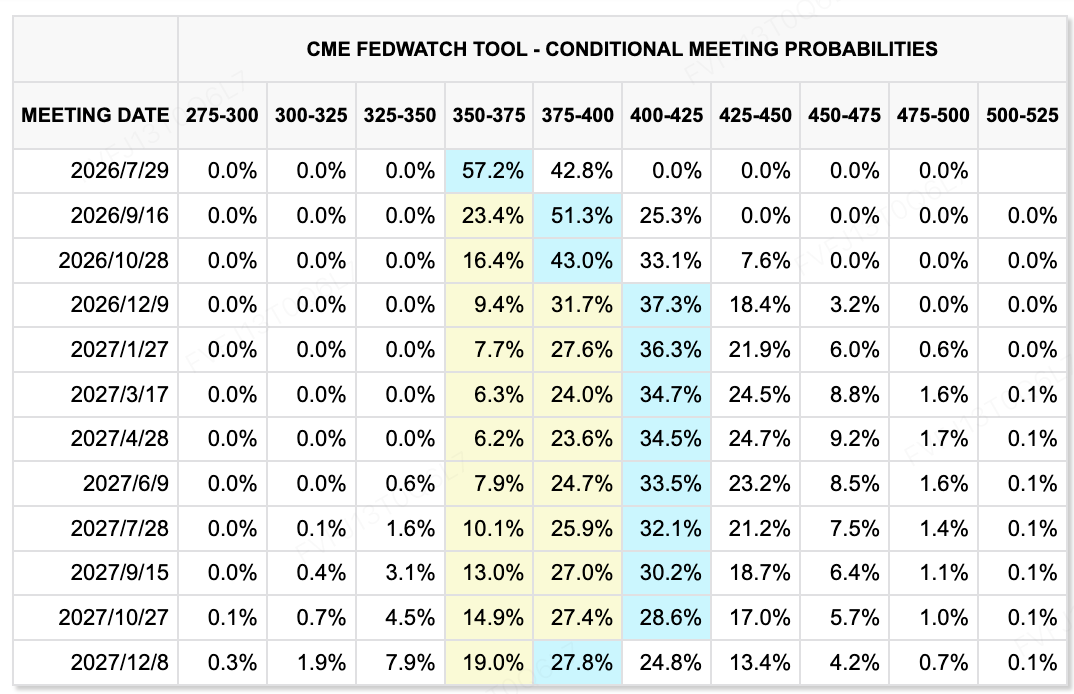
Data Source: CME FedWatch Tool
On rate expectations, the CME FedWatch Tool shows that markets still assign a high probability to the Fed keeping the current rate range unchanged at the July meeting, but the far-end rate path has clearly moved higher. The June FOMC meeting kept the federal funds target range unchanged at 3.50%–3.75%, but the median dot-plot projection suggested one possible rate hike in 2026, and nine officials supported at least one hike. This indicates that the Fed has shifted from its previous easing bias toward a more clearly anti-inflation stance. After his first policy meeting, Warsh reduced forward guidance, did not submit his own dot plot, and emphasized that policy would be more data-dependent and focused on price stability. Markets therefore need to adjust to a Fed that offers fewer commitments and introduces higher policy uncertainty.
For risk assets, the key change is that the “rate-cut trade” is still difficult to restart in the near term. Although lower oil prices and progress in U.S.–Iran talks help ease short-term inflation pressure, if AI investment, labor-market resilience, and services inflation continue to support economic momentum, the Fed may not rush to pivot toward easing. Market attention has shifted from “whether rates will be cut in June” to “whether high rates will last longer, and whether a preventive hike could evolve into actual tightening.” Against this backdrop, technology stocks and crypto assets may still offer structural opportunities, but valuation expansion will remain constrained by long-term yields and policy uncertainty.
Major Events to Watch This Week:
-
June 23: U.S. June preliminary PMI. PMI data will help markets assess whether high interest rates and energy-price volatility have started to affect business activity. If both services and manufacturing remain resilient, it may further reinforce the “economy is not weak, and there is no urgency to cut rates” narrative.
-
June 24: U.S. May new home sales and FedEx earnings. Housing data will show the impact of high rates on households and the property chain, while FedEx earnings will serve as an important window into global trade, logistics demand, and fuel-cost pass-through.
-
June 25: Micron earnings. Micron will be the most important earnings test this week for the AI and semiconductor chain. Markets will focus on HBM, data-center storage demand, margins, and capital expenditure guidance. The results could directly influence sentiment toward AI hardware and memory-chip stocks.
-
June 26: U.S. Q1 GDP final reading, durable goods orders, initial jobless claims, personal income and spending. These data points will jointly test the resilience of the U.S. economy, corporate investment, and marginal changes in the labor market. After the hawkish signal from the FOMC, markets will be especially sensitive to any evidence of either “overheating growth” or “slowing growth.”
-
June 25–26: U.S. May PCE inflation data. PCE is the Fed’s preferred inflation gauge. If core PCE remains elevated, it will strengthen the higher-for-longer rate narrative. If the data cools, it could ease market concerns over far-end rate hikes following Warsh’s first FOMC meeting.
-
Geopolitical and energy risks: U.S.–Iran technical negotiations and the status of the Strait of Hormuz. Although U.S.–Iran negotiations have formed a 60-day roadmap, Trump’s threatening remarks, the temporary walkout by Iranian representatives, and security arrangements around the Strait of Hormuz remain key market concerns. If negotiations continue to advance, the oil risk premium may fall further. If new military threats or disruptions around the Strait emerge, energy prices and inflation expectations could rise again.
Primary Market Financing Observations:
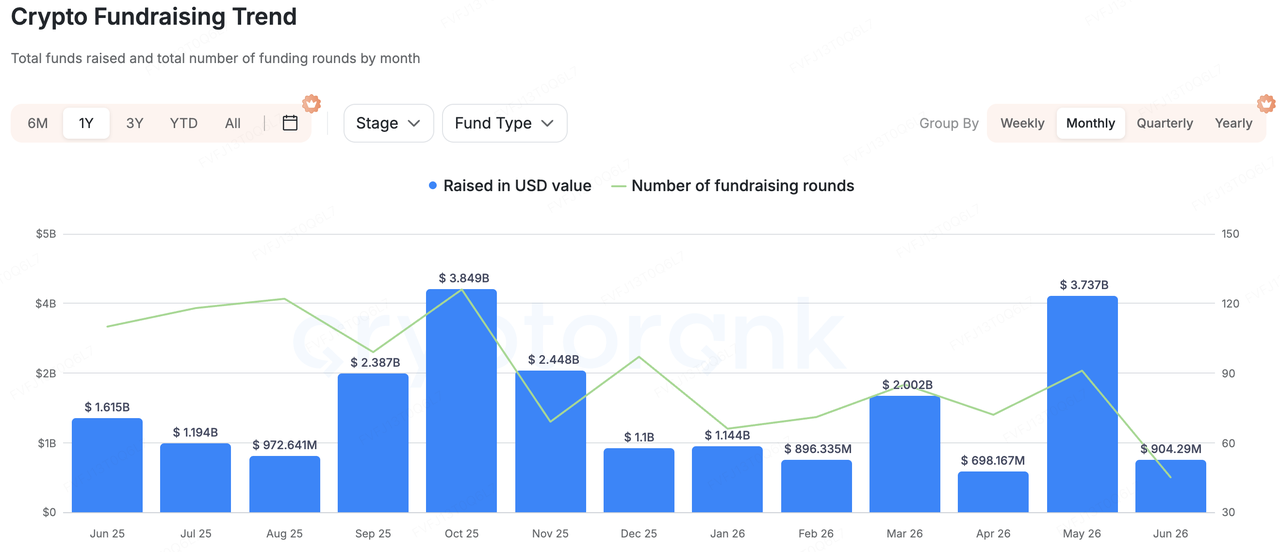
Data Source: CryptoRank
Based on CryptoRank’s broad statistical coverage and publicly available funding databases, crypto primary-market financing did not see a broad recovery last week. However, capital allocation became clearer, with funding mainly concentrated in stablecoin/fiat financial infrastructure, real-user verification, AI and ad fraud prevention, and on-chain application distribution—areas closer to real business use cases. Compared with purely narrative-driven financing, representative projects last week generally had clearer B2B or payment scenarios, suggesting that primary-market capital still prefers projects that are explainable, monetizable, and able to serve institutions or real users.
Among representative projects, Range completed an USD 8.3 million Series A round, with investors including TX Ventures, SixThirty, Maven 11 Capital, and Onigiri Capital. Range is positioned as a unified stablecoin and fiat financial operations platform for institutions, covering treasury management, risk control, and compliance needs. The investment logic behind this type of project is that stablecoins are entering enterprise payments, cross-border settlement, and treasury management. What institutions truly need is not merely issuance or wallet access, but a control, compliance, and operating layer that connects stablecoins with traditional financial accounts.
EarnOS was another consumer-application case worth noting last week. The project completed a USD 6 million Pre-Series A round led by 1kx, with participation from Coinbase Ventures, Circle Ventures, and Social Graph Ventures. It also received USD 12.5 million in non-dilutive strategic funding from Verona. EarnOS’s core logic is to help brands verify real user behavior and reduce advertising waste caused by AI bots and fake traffic through identity verification and stablecoin rewards. This direction shows that Web3 applications are shifting from “users paying for interactions” toward “brands paying for verified user behavior,” while attempting to embed stablecoin incentives into advertising, tasks, and user data authorization scenarios.
Overall, primary-market capital did not clearly chase high-beta asset issuance or pure front-end trading applications last week. Instead, it continued to concentrate in stablecoin financial operating systems, real-user verification, AI-era ad fraud prevention, and embeddable application scenarios. In a secondary market still affected by rates and ETF-flow volatility, primary-market investors continue to prefer infrastructure projects with clear revenue paths, real-world demand, and institutional or enterprise customers.