

Solana Price Drops Toward $100: Is the SOL Rally Over or Just a Healthy Pullback?
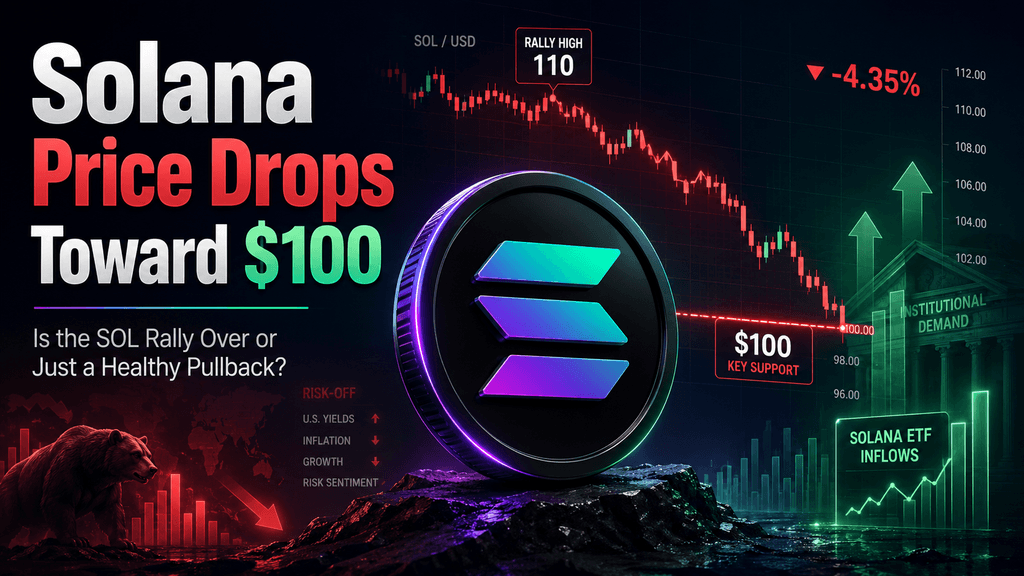
Solana entered September under renewed selling pressure after one of its strongest months in recent memory. SOL gained roughly 46% in August 2026, ending a ten-month streak of monthly declines and reaching a high near $110.38 on August 27. But the momentum faded quickly as the token retreated toward the psychologically important $100 level. On September 2, SOL fell more than 3%, substantially underperforming Bitcoin as investors reduced exposure to higher-risk crypto assets.
The decline raises an important question for traders: is Solana's rally already losing momentum, or is the move toward $100 simply a normal correction after a rapid advance? The answer is more complicated than one daily price move suggests. Macroeconomic pressure has increased, yet institutional demand through Solana ETFs remains strong, while the network continues to advance technically. Understanding whether SOL is experiencing a healthy pullback therefore requires looking at price structure, macro conditions, ETF flows, leverage and Solana's underlying fundamentals together.
Why Is Solana Price Falling?
Solana's latest decline appears to be driven by several forces rather than one major negative development involving the network itself. The first is straightforward profit-taking. After gaining approximately 46% in August and briefly trading above $110, SOL had delivered substantial short-term gains. A rapid rally often creates a larger pool of investors willing to lock in profits, particularly when an asset approaches a widely watched resistance area.
The second factor is a broader shift toward risk aversion. On September 2, Solana and Tron both fell more than 3%, while Ether and XRP lost close to 2%. Bitcoin, by comparison, declined roughly 1%. The sell-off followed renewed U.S. strikes on Iran, a jump in oil prices and rising global bond yields. Brent crude moved above $95 while the U.S. 10-year Treasury yield touched roughly 4.81%, creating a difficult environment for speculative assets.
This distinction matters. The decline did not coincide with a major Solana network failure or a sudden collapse in institutional interest. Instead, the move looked more like a combination of profit-taking, macro pressure and investors reducing high-beta exposure. That does not guarantee the correction will remain shallow, but it changes how the sell-off should be interpreted.
Why $100 Matters for SOL
The $100 area has become one of the most important short-term levels for Solana because it combines technical and psychological significance. Round numbers frequently attract more attention from traders, and $100 became especially relevant after SOL reclaimed triple-digit territory during its August recovery. After touching $110.38 on August 27 and closing August near $103–$106 depending on the market snapshot, the return toward $100 represents the first major test of whether buyers are prepared to defend the breakout.
The important point is not whether SOL briefly trades at $99, $100 or $101. Markets rarely respect support levels to the exact cent. What matters is whether the region attracts sustained buying and allows SOL to rebuild a structure of higher lows. A recovery back through the recent trading range would strengthen the case for consolidation, while persistent trading below $100 combined with heavier selling could shift attention toward lower support zones.
Encouragingly for bulls, SOL was back around $100.9 during Asian trading on September 3 and had gained about 2% over the preceding 24 hours in CoinDesk's market snapshot. That early rebound does not confirm that the correction is over, but it shows that buyers have so far responded around the $100 area.
Is This a Healthy Pullback or a Trend Reversal?
A sharp decline after a strong rally does not automatically mean that the broader trend has reversed. SOL's August rise was unusually fast: the token gained roughly 46% in one month after ten consecutive monthly declines. After that kind of move, some consolidation is normal because earlier buyers take profits while new investors decide whether higher prices are sustainable.
A healthy pullback would generally involve SOL stabilizing around an important support region, selling pressure gradually weakening and spot demand returning without excessive leverage. Continued institutional inflows would provide another constructive signal. A deeper reversal would look different: important support would fail repeatedly, rebound attempts would become weaker, selling volume would increase and institutional demand could begin to deteriorate alongside the price.
For that reason, one session in which Solana falls more than 3% is not sufficient evidence that the rally has ended. The more important question is what happens after the initial decline. Price structure, trading activity, ETF flows and the wider macro environment need to confirm one another before a more durable trend conclusion can be made.
Why SOL Can Fall Faster Than Bitcoin
Solana often behaves as a higher-beta crypto asset relative to Bitcoin. In simple terms, that means SOL can amplify broader market moves. During strong risk-on periods, investors may move farther out on the risk curve from Bitcoin into assets such as Solana, allowing SOL to outperform. When risk appetite deteriorates, the same process can work in reverse as traders reduce more volatile positions first.
The September 2 sell-off provides a clear example. SOL fell more than 3% while Bitcoin lost roughly 1%, meaning Solana's decline was about three times as large in percentage terms. CoinDesk interpreted the divergence as evidence that traders were cutting faster-moving positions first as geopolitical and macro risks increased.
Solana's exposure to DeFi, decentralized exchanges, memecoin activity and leveraged crypto trading can contribute to that higher sensitivity. Higher beta does not mean Solana is fundamentally weaker than Bitcoin. It means investors should expect SOL to show larger swings when market liquidity and sentiment change quickly.
How Fed Policy Is Pressuring Solana
Solana has no central-bank interest rate, but Federal Reserve policy can still have a major effect on SOL price. Higher U.S. interest rates raise returns available on lower-risk assets and can tighten financial conditions throughout global markets. That makes speculative assets less attractive at the margin, especially those with higher volatility.
This pressure became more visible after Federal Reserve Chair Kevin Warsh's Jackson Hole comments shifted market expectations toward another rate increase. On September 2, markets were pricing roughly a 66% probability of a quarter-point September hike, up sharply from about 40% a week earlier. By September 3, the probability had eased to just above 62%, but remained substantially above the roughly 37% level seen a week earlier.
For SOL, the transmission mechanism is straightforward: higher rate expectations can push Treasury yields higher, strengthen the dollar and reduce liquidity available for risk-taking. Because Solana often trades as a high-beta growth asset within crypto, those conditions can affect it more severely than Bitcoin. Upcoming employment, inflation and Fed policy signals can therefore matter almost as much to short-term SOL performance as crypto-specific news.
Are Solana ETF Inflows Still Bullish?
One of the most interesting features of the current Solana market is the divergence between short-term price weakness and strong ETF demand. U.S. spot Solana ETFs recorded approximately $60.91 million in net inflows on August 27, their strongest daily result of 2026. The nine products held around $1.49 billion in combined assets at that point, while cumulative net inflows had reached approximately $1.32 billion. Bitwise's Solana Staking ETF also became the first SOL ETF to surpass $1 billion in assets under management.
The flow remained positive into the start of September. SolanaFloor's ETF tracker recorded another $10.2 million in combined net inflows on September 1 after positive flows on August 28 and August 31. These figures suggest that at least part of the institutional market has continued adding Solana exposure despite the token's pullback.
ETF inflows do not guarantee that SOL price will rise immediately. Selling by existing holders, derivatives positioning and a broad macro risk-off move can overwhelm ETF demand over shorter periods. Still, persistent inflows during a correction create an important question for the medium-term outlook: if institutional capital continues entering while short-term traders sell, the decline may reflect a change in positioning rather than a complete collapse in demand.
Does Solana's Fundamental Story Still Hold?
Price corrections become more concerning when they are accompanied by deteriorating fundamentals. So far, the recent decline has not coincided with a major deterioration in Solana's network operations. Solana's status page showed 100% Mainnet Beta uptime over the previous 90 days as of September 3, with no reported incidents across the final days of August or the opening days of September.
Development has also continued. During August, Solana activated progressively shorter slot times on mainnet, reaching a 300-millisecond feature gate by late August. Work on V1 Transactions, validator clients and additional network improvements also continued. Solana's official site says more than $4.7 trillion in stablecoin value moved across the network over the past year, highlighting how payments and tokenized finance have become part of the ecosystem alongside DeFi and trading.
That does not remove price risk. Network activity can slow, speculative demand can fade and competing blockchains can capture users or liquidity. But when evaluating whether a price correction represents a fundamental breakdown, it is important to distinguish weaker market sentiment from weaker network performance. At present, the latest sell-off appears more clearly linked to financial-market conditions than to an obvious Solana-specific operational shock.
Is Leverage Making the SOL Sell-Off Worse?
Leverage can turn an ordinary pullback into a much faster decline. Solana is actively traded through perpetual futures and other derivatives that allow investors to control positions larger than their initial capital. When too many traders become positioned in the same direction, relatively small price moves can trigger forced liquidation.
Suppose SOL rises rapidly and traders aggressively open leveraged long positions. If the price then begins to fall, some positions eventually reach liquidation thresholds. Their forced closure creates additional selling, which can push SOL lower and liquidate another group of traders. The same mechanism works in reverse during a short squeeze.
This is why open interest, funding rates and liquidation data can be useful alongside the spot price. If SOL falls while open interest declines substantially, the move may partly represent leverage being flushed from the market. If price declines while open interest expands, new bearish positioning may be entering. In either case, a sharp price move does not always mean investors have discovered fundamentally new information about Solana.
What Could Help Solana Recover?
A more durable SOL recovery would probably require improvement across several areas rather than one isolated catalyst. The macro environment is particularly important. Lower expectations for additional Fed tightening, softer Treasury yields or reduced geopolitical pressure could improve demand for high-beta assets. A renewed Bitcoin rally would also help because stronger BTC conditions often improve risk appetite across the broader altcoin market
.
Institutional flows provide another potential support. Continued Solana ETF inflows would strengthen the argument that traditional investors are using price weakness to maintain or increase exposure. At the same time, healthier derivatives positioning would reduce the danger that a rebound is being built mainly on excessive leverage.
Finally, the price itself needs to confirm the story. Stabilization around $100 followed by a sustained recovery through the recent range would be more constructive than a brief intraday bounce. SOL does not need every factor to turn bullish simultaneously, but a rally becomes more convincing when price, capital flows, market liquidity and fundamentals begin moving in the same direction.
What Could Push SOL Lower?
The downside case would become stronger if macro pressure intensifies while Solana's internal market structure weakens. A more hawkish Federal Reserve, persistently elevated Treasury yields, rising oil prices or further geopolitical escalation could keep investors defensive. If Bitcoin also begins losing important support, altcoins such as SOL could face disproportionately greater pressure.
ETF flows are another variable worth watching. Strong inflows have helped distinguish the current correction from a broader institutional retreat. If those flows reverse at the same time that SOL remains below $100 and spot selling accelerates, the bearish interpretation would become more credible. Excessive leveraged longs could further amplify the move through liquidations.
The key concept is confirmation. A temporary break below one round-number price is less significant than several bearish developments arriving together. Persistent price weakness combined with ETF outflows, higher yields, weakening Bitcoin and deteriorating on-chain activity would represent a much stronger warning than a single 3% down day.
What Should SOL Traders Watch Next?
Rather than relying on one technical indicator or headline, traders can monitor a combination of price, institutional flows, macro signals and network conditions.
| Indicator | What to Watch | Why It Matters |
| SOL price | Behavior around $100 | Tests an important psychological and recent trading area |
| Bitcoin | Direction of the broader BTC market | Influences crypto-wide risk appetite |
| Solana ETF flows | Persistent inflows or a reversal to outflows | Measures institutional demand |
| Fed expectations | Probability of further rate hikes | Affects financial conditions |
| Treasury yields | Whether U.S. yields rise or retreat | Influences demand for high-risk assets |
| Trading volume | Strength behind rebounds or declines | Helps confirm market conviction |
| Futures open interest | Whether leverage is building or being reduced | Highlights liquidation risk |
| Network activity | Usage, reliability and ecosystem development | Helps assess fundamental health |
The most useful signals usually appear when several indicators agree. For example, SOL holding $100 while ETF inflows remain positive, leverage cools and Treasury yields retreat would create a different setup from SOL losing support while Bitcoin weakens and institutional flows turn negative. Solana's market is increasingly influenced by both crypto-native fundamentals and global financial conditions, making a multi-factor approach more useful than watching the chart alone.
Is the Solana Rally Really Over?
There is not yet enough evidence to conclude that Solana's rally has ended simply because SOL fell more than 3% and returned toward $100. The correction came after an unusually strong 46% monthly gain, institutional ETF demand remains substantial and the latest decline occurred during a broader macro-driven risk sell-off rather than a major Solana-specific failure.
At the same time, the risks are real. The rejection around $110 shows that sellers remain active at higher prices, while rising bond yields and expectations for tighter Federal Reserve policy can continue pressuring high-beta cryptocurrencies. A failure to establish durable support around the current region would increase the probability of a deeper correction.
For now, the more balanced interpretation is that SOL is undergoing a critical test of its August recovery. Whether that turns into a healthy pullback or a broader reversal will depend on what happens next to price structure, ETF demand, leverage and the macro environment.
Conclusion: $100 Is a Test, Not the Whole Story
Solana's drop toward $100 has understandably put short-term traders on alert, but a single trading session does not define the broader trend. The current correction sits at the intersection of three competing forces: profit-taking after a powerful August rally, macro pressure from higher yields and Fed expectations, and continued institutional demand through Solana ETFs.
The $100 area provides a useful reference point, but it should not be viewed in isolation. SOL's next meaningful move will depend on whether buyers continue defending important support, ETF demand remains resilient, leverage stays under control and broader financial conditions improve. Those factors together will determine whether the recent decline ultimately looks like a healthy reset or the beginning of a deeper reversal.
FAQs
Why is Solana more volatile than Bitcoin?
Solana generally has a smaller market size and greater exposure to DeFi, trading and speculative activity than Bitcoin, so SOL often experiences larger percentage moves in both directions.
Does Solana have a maximum supply like Bitcoin?
No. Bitcoin has a fixed maximum supply of 21 million BTC, while Solana uses an inflation-based issuance model that gradually changes over time.
How does staking affect SOL price?
Staking can reduce the amount of SOL immediately available for trading while allowing holders to earn rewards. Changes in staking and unstaking activity can therefore influence liquid supply.
Can Solana rise while Bitcoin is falling?
Yes. Strong ETF inflows, network upgrades or Solana-specific demand can occasionally push SOL higher even when Bitcoin is weak, although broader crypto trends still matter.
What is the difference between buying SOL and a Solana ETF?
Buying SOL provides direct ownership of the token and allows on-chain use or staking. A Solana ETF provides price exposure through a traditional investment product without direct token custody.
Why does Solana trade on weekends?
SOL trades 24/7 because cryptocurrency markets do not follow traditional stock-market hours. Weekend liquidity can sometimes be thinner, which may increase short-term volatility.
🔥 KuCoin Offers A More Stable Option in A Volatile Market
If you worry about the frequent ups and downs in the market, and pursue a more stable option to earn money passively, KuCoin is the right place to come:
Simple Earn: Deposit and withdraw tokens anytime, earning stable returns.
Kucoin Earn: Earn stable profits with professional asset management.
Hold to Earn: Earn rewards by holding assets in Funding, Trading, Margin, Futures, Mining, and Unified Accounts.
Staking: Unlock the earning potential of on-chain assets.
Advanced Investments: Advanced Investments offer a variety of structured products to help your money grow in any market.
Shark Fin: Principal Protection and Guaranteed Gains
Dual Investment: Buy low and sell high with transparent return calculations.
Snowball: High yields, with price protection.
Discount Buy: Buy crypto at discount prices.
KCS Loyalty: Level up to enjoy exclusive perks by staking ≥ 1 KCS.
KuCoin Wealth: Discover future value and begin your smart investing journey.
KCS Benefits: Hold and stake KCS to access benefits across the platform.
KCS Staking 2.0: Participate in KCS on-chain governance to earn yield.
Disclaimer: This content is for informational purposes only and does not constitute investment advice. Cryptocurrency investments carry risk. Please do your own research (DYOR).