
What is Fibonacci Trading? Master the Golden Ratio in Crypto
2026/04/01 17:24:02

Have you ever stared at a cryptocurrency chart and wondered why Bitcoin or Ethereum suddenly bounces back from a very specific price level? In the highly volatile crypto market, rapid price swings can feel chaotic, unpredictable, and entirely random. But what if there was a hidden mathematical order behind these massive green and red candles?
Fibonacci retracement Originally derived from a 13th-century mathematical sequence, this centuries-old concept has evolved into a powerful strategy for modern traders. It helps predict exactly where a crypto asset's price might find support during a pullback or face resistance during a strong rally.
Think of it as a roadmap for market psychology. When cryptocurrency makes a massive move in one direction, it rarely goes in a straight line; it usually retraces a portion of that move before continuing its trend. Fibonacci levels help you catch those bounces.
Whether you are a day trader looking for the perfect entry point or a long-term investor trying to avoid buying at the absolute top, mastering Fibonacci can significantly elevate your trading strategy.
In this comprehensive guide, we will break down what the Fibonacci sequence is, the math behind the magic, and exactly how you can draw and use these retracement levels on your crypto charts to make smarter, data-driven trading decisions.
Key Takeaways
-
Fibonacci retracement is a highly popular technical analysis tool used by crypto traders to identify potential support and resistance levels.
-
It is deeply rooted in a mathematical phenomenon known as the Fibonacci sequence and the Golden Ratio (1.618), which appear frequently in nature and financial markets.
-
The most critical Fibonacci levels to watch on a crypto chart are 23.6%, 38.2%, 50%, 61.8%, and 78.6%.
-
While powerful for identifying entry and exit points during market pullbacks, Fibonacci is most effective when combined with other technical indicators like Moving Averages or RSI.
What is the Fibonacci Sequence?
The Fibonacci sequence is a famous series of numbers introduced to the Western world in the 13th century by Italian mathematician Leonardo Fibonacci.
The rule of the sequence is remarkably simple: you start with 0 and 1, and every subsequent number is simply the sum of the two preceding ones.
Following this rule, the sequence looks like this: 0, 1, 1, 2, 3, 5, 8, 13, 21, 34, 55, 89... and it goes on toward infinity.
As the sequence progresses, if you take any number and divide it by the number immediately before it (for example, 55 / 34 or 89 / 55), the answer always approaches the exact same value: 1.618.
This mathematical phenomenon is known as the Golden Ratio.
But what does a 13th-century math equation have to do with crypto trading? The Golden Ratio isn't just a math trick; it is the fundamental building block of nature. It dictates the spiral of galaxies, the shape of hurricanes, the petals on a flower, and even the proportions of the human body.
Because financial markets, including highly speculative ones like crypto, are ultimately driven by human psychology, they tend to move in waves that unconsciously follow these exact same natural, geometric patterns.
By applying the Golden Ratio to crypto price charts, traders can mathematically predict the emotional peaks and valleys of the market.
What Are Fibonacci Retracement Levels in Crypto?
When cryptocurrency like Bitcoin experiences a massive price surge (a bull run) or a steep decline (a bear market), it rarely sustains that momentum without taking a breather. Traders use Fibonacci retracement levels to highlight the exact percentages where a price correction is most likely to pause and reverse back into its original trend.
On a standard crypto chart, the most critical Fibonacci retracement levels you will encounter are:
-
23.6%: A shallow pullback, often seen during very strong, aggressive trends.
-
38.2%: A moderate and highly reliable level where many traders look to enter the market.
-
61.8%: The "Golden Pocket." This is the most crucial level, derived directly from the Golden Ratio (1.618). A bounce from this level is considered a strong signal of trend continuation.
-
78.6%: A deep pullback. If the price falls below this level, it often signals a complete trend reversal rather than a simple retracement.
The 50% Anomaly You might notice that the 50% level is almost always included in Fibonacci drawing tools. Interestingly, 50% is not the actual Fibonacci ratio. It is included because of Dow Theory, which suggests that assets often retrace exactly half of their primary move before continuing. In the crypto market, the 50% mark acts as a massive psychological barrier for buyers and sellers.
When you open a price chart on a platform like KuCoin and apply the Fibonacci tool, it automatically draws horizontal lines at these exact percentages. These lines act as invisible floors (support) during a downtrend, or invisible ceilings (resistance) during an uptrend, helping you visualize exactly where the market's safety nets are located.
How to Draw Fibonacci Retracements on a Crypto Chart
Modern crypto exchanges, such as KuCoin, have built-in Fibonacci tools that do heavy lifting for you. Drawing Fibonacci retracements requires you to identify two main points on a chart: Swing High (the peak of a trend) and Swing Low (the bottom of a trend).
Always remember the golden rule: Always draw your Fibonacci lines from left to right.
Step 1: Drawing in an Uptrend (Finding Support)
If cryptocurrency is in a bull market and has just made a massive move upward, you want to find a safe entry point to "buy the dip" before the price shoots up again.
To do this, select the Fibonacci Retracement tool on your chart. Click on the very bottom of the move and drag your cursor up and to the right, releasing it at the very top of the move.
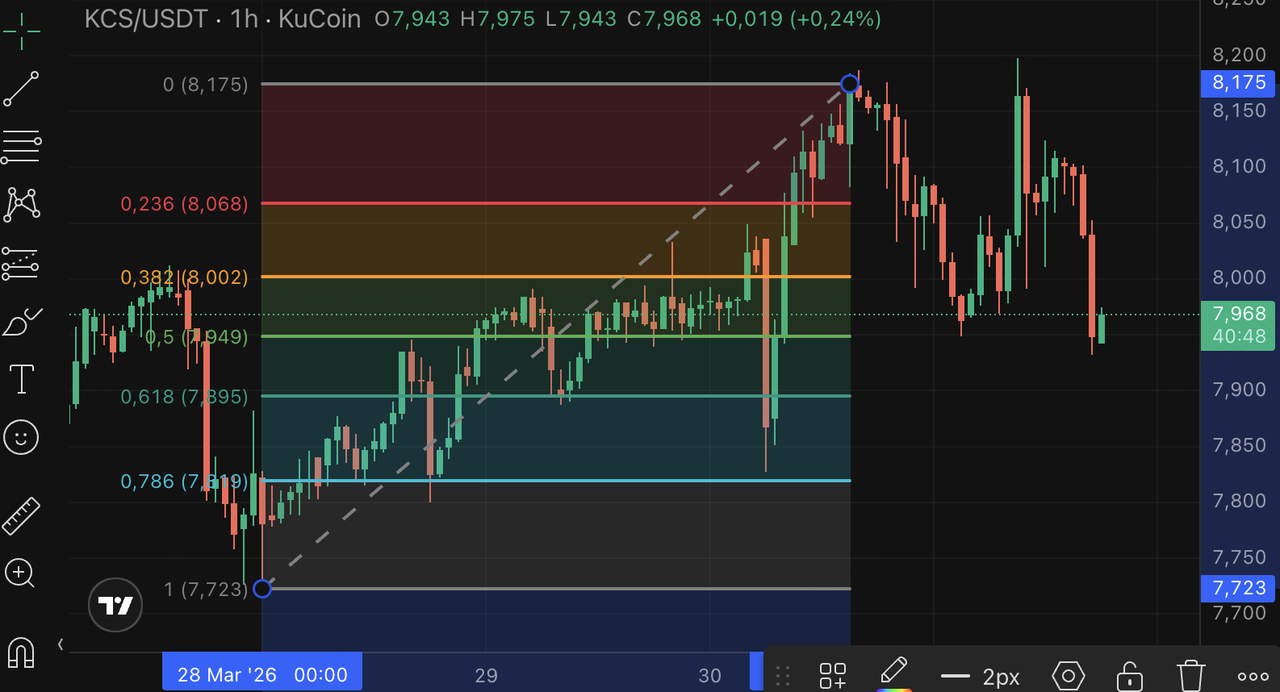
An example on the KuCoin KCS/USDT 1H chart
Once drawn, the tool will automatically display horizontal support lines below the current price. Traders will typically watch the 38.2%, 50%, and 61.8% levels. If the price drops to one of these lines and shows signs of reversing, it presents a strong buying opportunity.
Step 2: Drawing in a Downtrend (Finding Resistance)
If the market is crashing, the price will occasionally experience temporary relief rallies before continuing its downward death spiral. In a bear market, traders use Fibonacci to find resistance levels.
In this scenario, you do the exact opposite. Click on the peak of the crash (the Swing High) and drag your cursor down and to the right, ending at the lowest point of the crash (the Swing Low).
Now, the Fibonacci levels will appear above the current price. If the dead cat bounce reaches the 50% or 61.8% retracement level and struggles to break through, it is a strong signal that the downtrend is about to resume.
Fibonacci Trading Strategies for Crypto Investors
Strategy 1: Trend Continuation (Buying the Dip)
This is the most common and arguably the most reliable Fibonacci strategy. In a strong crypto bull market, prices don't go straight up. They surge, pull back to gather liquidity, and then surge again.
Traders use Fibonacci levels to pinpoint the exact bottom of these pullbacks. If Bitcoin rallies from $50,000 to $60,000 and begins to correct, you can draw your Fibonacci tool to find support. If the price drops to the 38.2% or 61.8% level and you see bullish candlestick patterns (like a hammer or a strong green candle) forming, it is a prime signal to execute a buy order.
Strategy 2: Using Fibonacci for Stop-Loss Placement
Capital preservation is crucial in crypto trading. Fibonacci levels are excellent tools for determining where your thesis is proven wrong, making them perfect for stop-loss placement.
If you buy a token expecting it to bounce off the 50% Fibonacci level, you shouldn't just hope for the best. A smart trader will place their stop-loss just below the next major Fibonacci level.
Strategy 3: Setting Take-Profit Targets with Fibonacci Extensions
Fibonacci isn't just for finding entries; it also tells you where to take profits. While retracements show you pullbacks, a related tool called Fibonacci Extensions shows you where the price might go after the bounce.
Common extension levels are 1.618, 2.618, and 3.618. If you successfully buy a bounce at the 61.8% retracement level, you can set your take-profit orders at these extension levels above the previous high. This allows you to scale out of your position and lock in profits automatically as cryptocurrency reaches new all-time highs. For seamless execution, you can set these specific target prices using KuCoin's Take-Profit/Stop-Loss order.
Combining Fibonacci with Other Technical Indicators
While Fibonacci retracement levels are powerful, they are not magical or infallible. Their predictive power increases exponentially when combined with other popular technical analysis tools. This strategy is known as searching for confluence, where multiple indicators point to the same trading decision at the same price.
Here are the best indicators to pair with Fibonacci:
Fibonacci and Moving Averages (MA)
Moving Averages are trend-following indicators that smooth out price noise. A moving average represents a dynamic support or resistance line based on past price data.
When a Fibonacci retracement level aligns with a major moving average, like the 50-day or 200-day MA, it creates a much stronger support/resistance zone. For instance, if Bitcoin pulls back to the 61.8% Fibonacci level and the 200-day Moving Average is sitting right at that same price point, the likelihood of a strong bounce is very high.
Check out KuCoin's tutorial on A Beginner’s Guide to Cryptocurrency Technical Analysis to master this confluence.
Fibonacci and Relative Strength Index (RSI)
The RSI is a momentum indicator that measures if a cryptocurrency is "overbought (overvalued) or oversold (undervalued).
If the price crashes to the 50% or 61.8% Fibonacci support level, you should immediately check the RSI. If the RSI shows that the asset is also deeply oversold (below 30), it provides powerful confirmation that the selling pressure has likely exhausted, and a reversal is imminent. Combining these two indicators helps traders avoid "false breakouts" where the price moves past a Fibonacci level temporarily.
The Limitations and Risks of Fibonacci Trading
As useful as Fibonacci tools are, they are not a guaranteed oracle. Trading based solely on Fibonacci can lead to significant losses if the risks are not properly managed, especially in the volatile crypto market.
Here are the critical limitations you must keep in mind:
It Can Be Subjective
Fibonacci retracements rely entirely on which Swing High and Swing Low you choose. Different traders might pick different peak and valley points on the same 4-hour BTC chart, resulting in slightly different sets of Fibonacci levels. This subjectivity can lead to confusion if multiple major structures are present.
Market Wicks and Volatility
Cryptocurrencies often experience extreme volatility. It is very common to see "wicks" on a candlestick chart that pierce through a key Fibonacci level (like the 61.8% Golden Pocket) before reversing back. Beginners might see this breach as a signal to close their position (getting "stopped out"), only to watch the price immediately bounce back in their original intended direction.
Not a Standalone Tool
The most important rule is that Fibonacci is not a trading strategy on its own. It is just one component of a broader system. It does not tell you if the overall trend is weak or strong, nor does it guarantee market volume. You must always use proper risk management (like never investing more than you can afford to lose) and confluence from other tools to confirm any Fibonacci signal.
Conclusion
Understanding "What is Fibonacci and how to use it?" is a rite of passage for any serious crypto investor. By translating the ancient mathematical magic of the Golden Ratio into actionable support and resistance levels on a price chart, you gain a massive advantage over the emotional herd. However, always remember the golden rule of crypto trading: no single indicator works 100% of the time. The most successful traders combine Fibonacci retracements with other technical indicators like RSI and Moving Averages, and they never trade without strict risk management and stop-loss orders.
FAQs
What is the Golden Ratio in crypto trading?
The Golden Ratio in crypto trading refers to the mathematical proportion of 1.618 (or the 61.8% retracement level). Derived from the Fibonacci sequence, this specific ratio frequently acts as the strongest support or resistance level during a market pullback.
Does Fibonacci retracement work for day trading crypto?
Yes, absolutely. Fibonacci retracements are fractal, meaning they work across all timeframes. Day traders frequently apply the tool to shorter timeframes, such as the 15-minute or 1-hour charts, to find quick entry and exit points during intraday volatility. However, the signals are generally considered stronger on longer timeframes like the daily or weekly charts.
Which Fibonacci level is the strongest?
While all levels offer valuable insights, the 61.8% and the 38.2% levels are widely considered the strongest and most reliable. Additionally, the 50% level (though technically not a Fibonacci number) acts as a massive psychological barrier and is heavily monitored by institutional and retail traders alike.
Should I draw Fibonacci from the body or the wick of the candlestick?
Most professional crypto traders recommend drawing Fibonacci levels from the extreme wicks (the absolute highest and lowest points of the price action) rather than the candle bodies. In the highly volatile crypto market, wicks represent the true extremes of buyer and seller exhaustion.
Disclaimer
This content is for informational purposes only and does not constitute investment advice. Cryptocurrency investments carry risk. Please do your own research (DYOR).