
Bitcoin Drops Below $63,000 as Crypto Market Crashes: Is Bear Market Continuing in 2026?
2026/06/04 11:58:00
Introduction
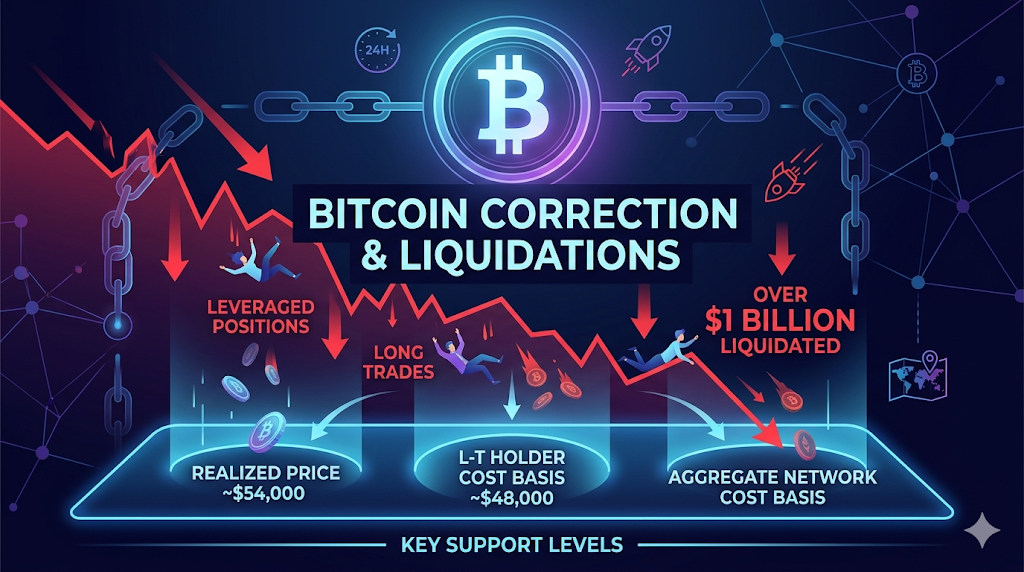
More than $1 billion in leveraged crypto positions were wiped out during several major market sell-offs in 2026, highlighting how quickly sentiment can reverse in digital asset markets. Recent liquidation cascades pushed Bitcoin below key psychological levels and reignited fears that a deeper correction may be underway. According to market data, almost $1.2 billion in crypto liquidations occurred during the past 24 hours on June 4, 2026, with Bitcoin accounting for the largest share of forced position closures. Based on CoinGlass data reported by multiple industry publications in early June 2026, long positions represented the overwhelming majority of liquidated trades.
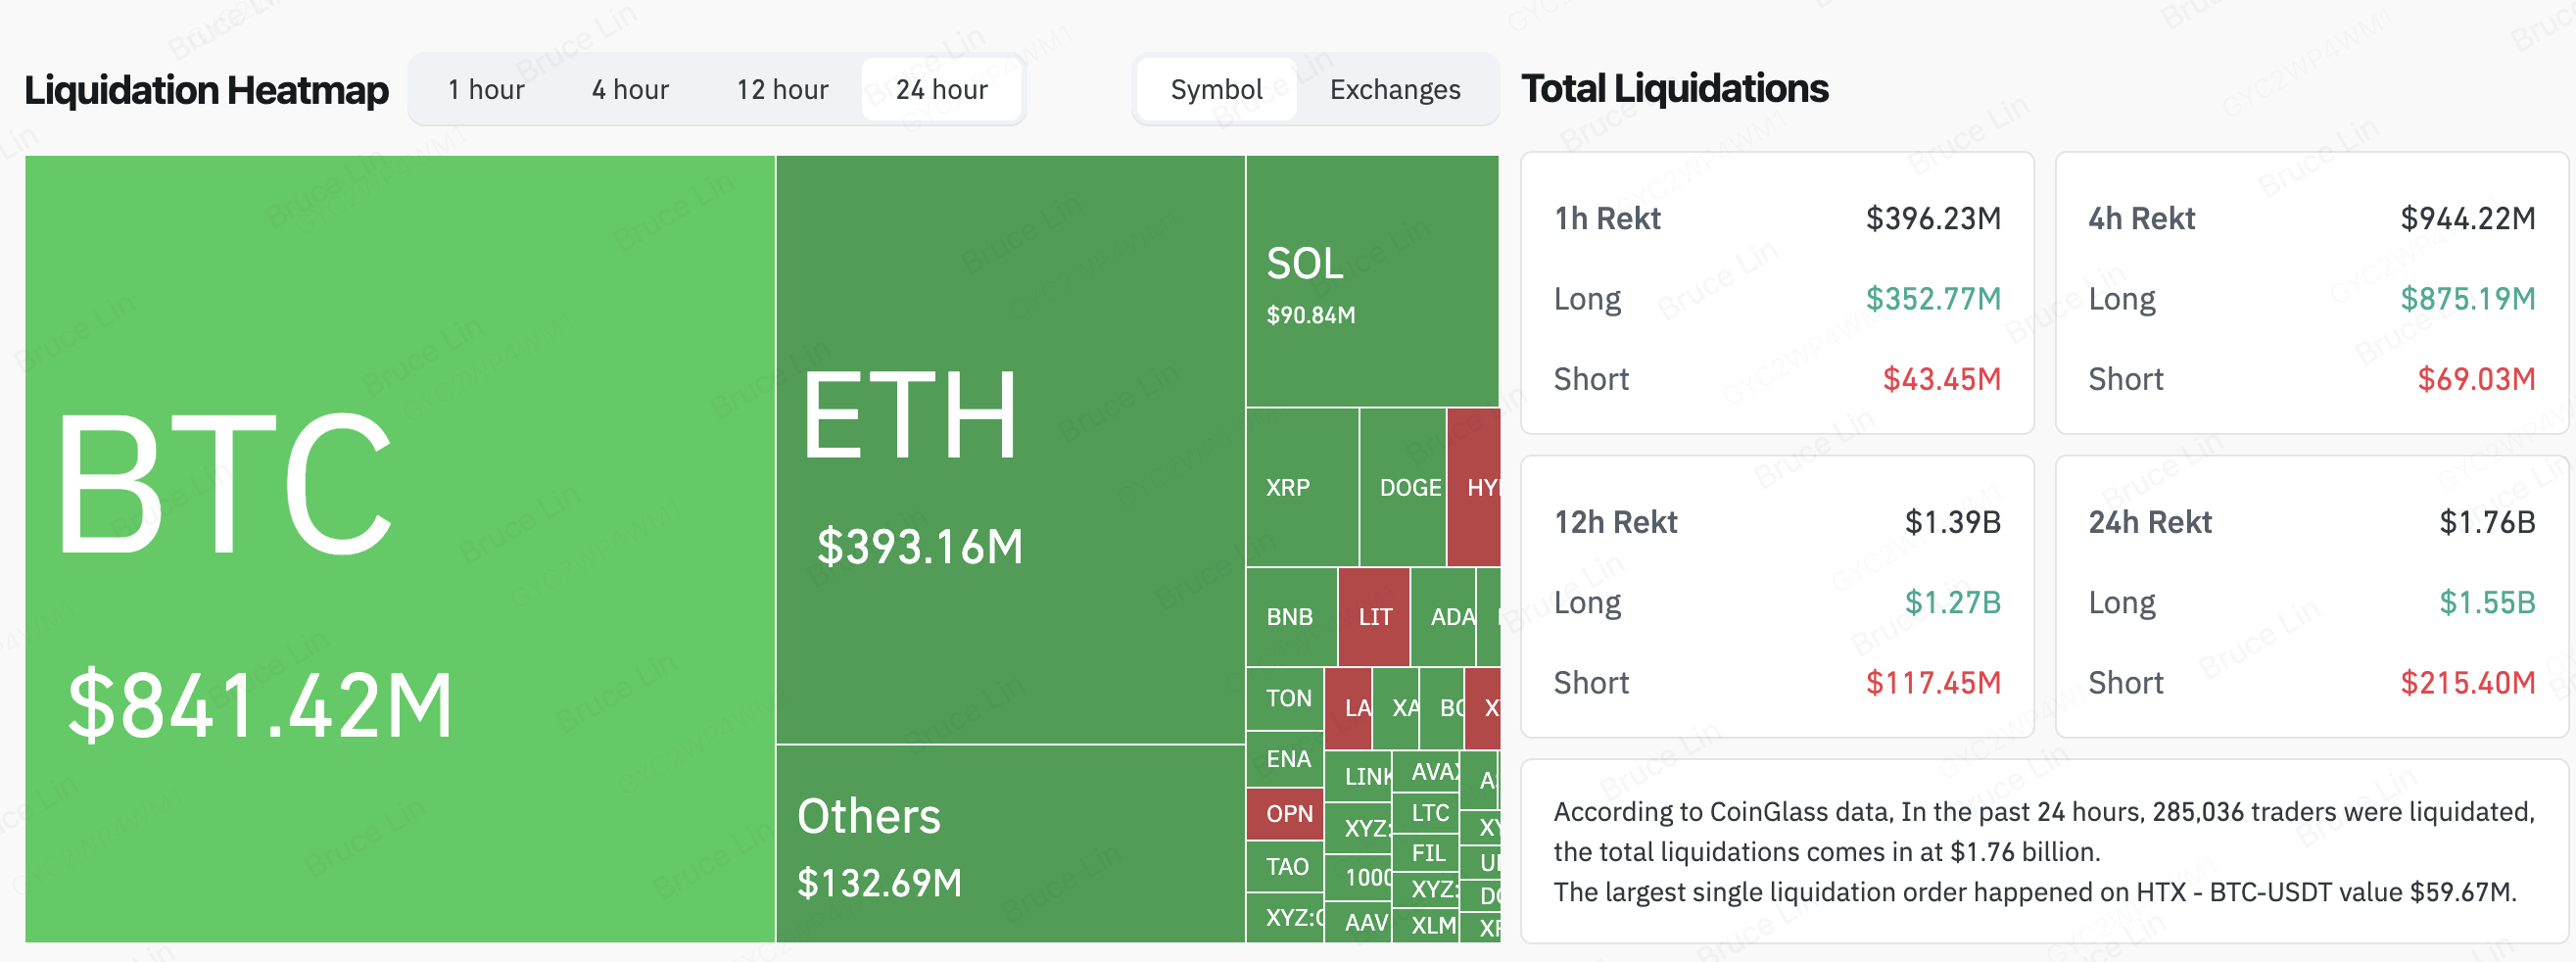
(As of June 4, 2026)
The key question for investors is simple: Is more downside coming, or is Bitcoin approaching a long-term bottom? While no one can predict future prices with certainty, several important on-chain indicators provide valuable clues about where Bitcoin may find support if the correction continues.
Why Did Bitcoin Fall Sharply in 2026?
Bitcoin's recent decline was primarily driven by a combination of leverage unwinding, macroeconomic uncertainty, and weakening market sentiment.
The immediate trigger behind many of the sharp price drops was the forced liquidation of highly leveraged positions. According to CoinGlass data cited by multiple market reports in June 2026, more than $1 billion worth of crypto positions were liquidated within a 24-hour period, with Bitcoin and Ethereum accounting for most losses.
When traders use leverage, even a relatively small price decline can trigger automatic liquidation. These forced sales create additional downward pressure, which can then trigger more liquidations in a cascading effect.
Several broader market factors also contributed to Bitcoin's weakness:
-
Reduced risk appetite across global financial markets
-
Geopolitical tensions affecting investor sentiment
-
Profit-taking after Bitcoin's strong rally in previous quarters
-
Lower inflows into crypto investment products
-
Decreasing speculative demand from short-term traders
Importantly, most of the liquidations came from long positions rather than shorts. This indicates that bullish traders were caught off guard by the speed of the decline.
What Does Bitcoin's 4-Year Cycle Suggest About 2026?
The 4-year cycle remains one of the most widely followed frameworks in Bitcoin analysis. Historically, Bitcoin has moved through recurring phases tied to its halving schedule:
-
Capitulation
-
Hope - Fear
-
Optimism - Anxiety
-
Belief - Denial
-
Euphoria - Greed
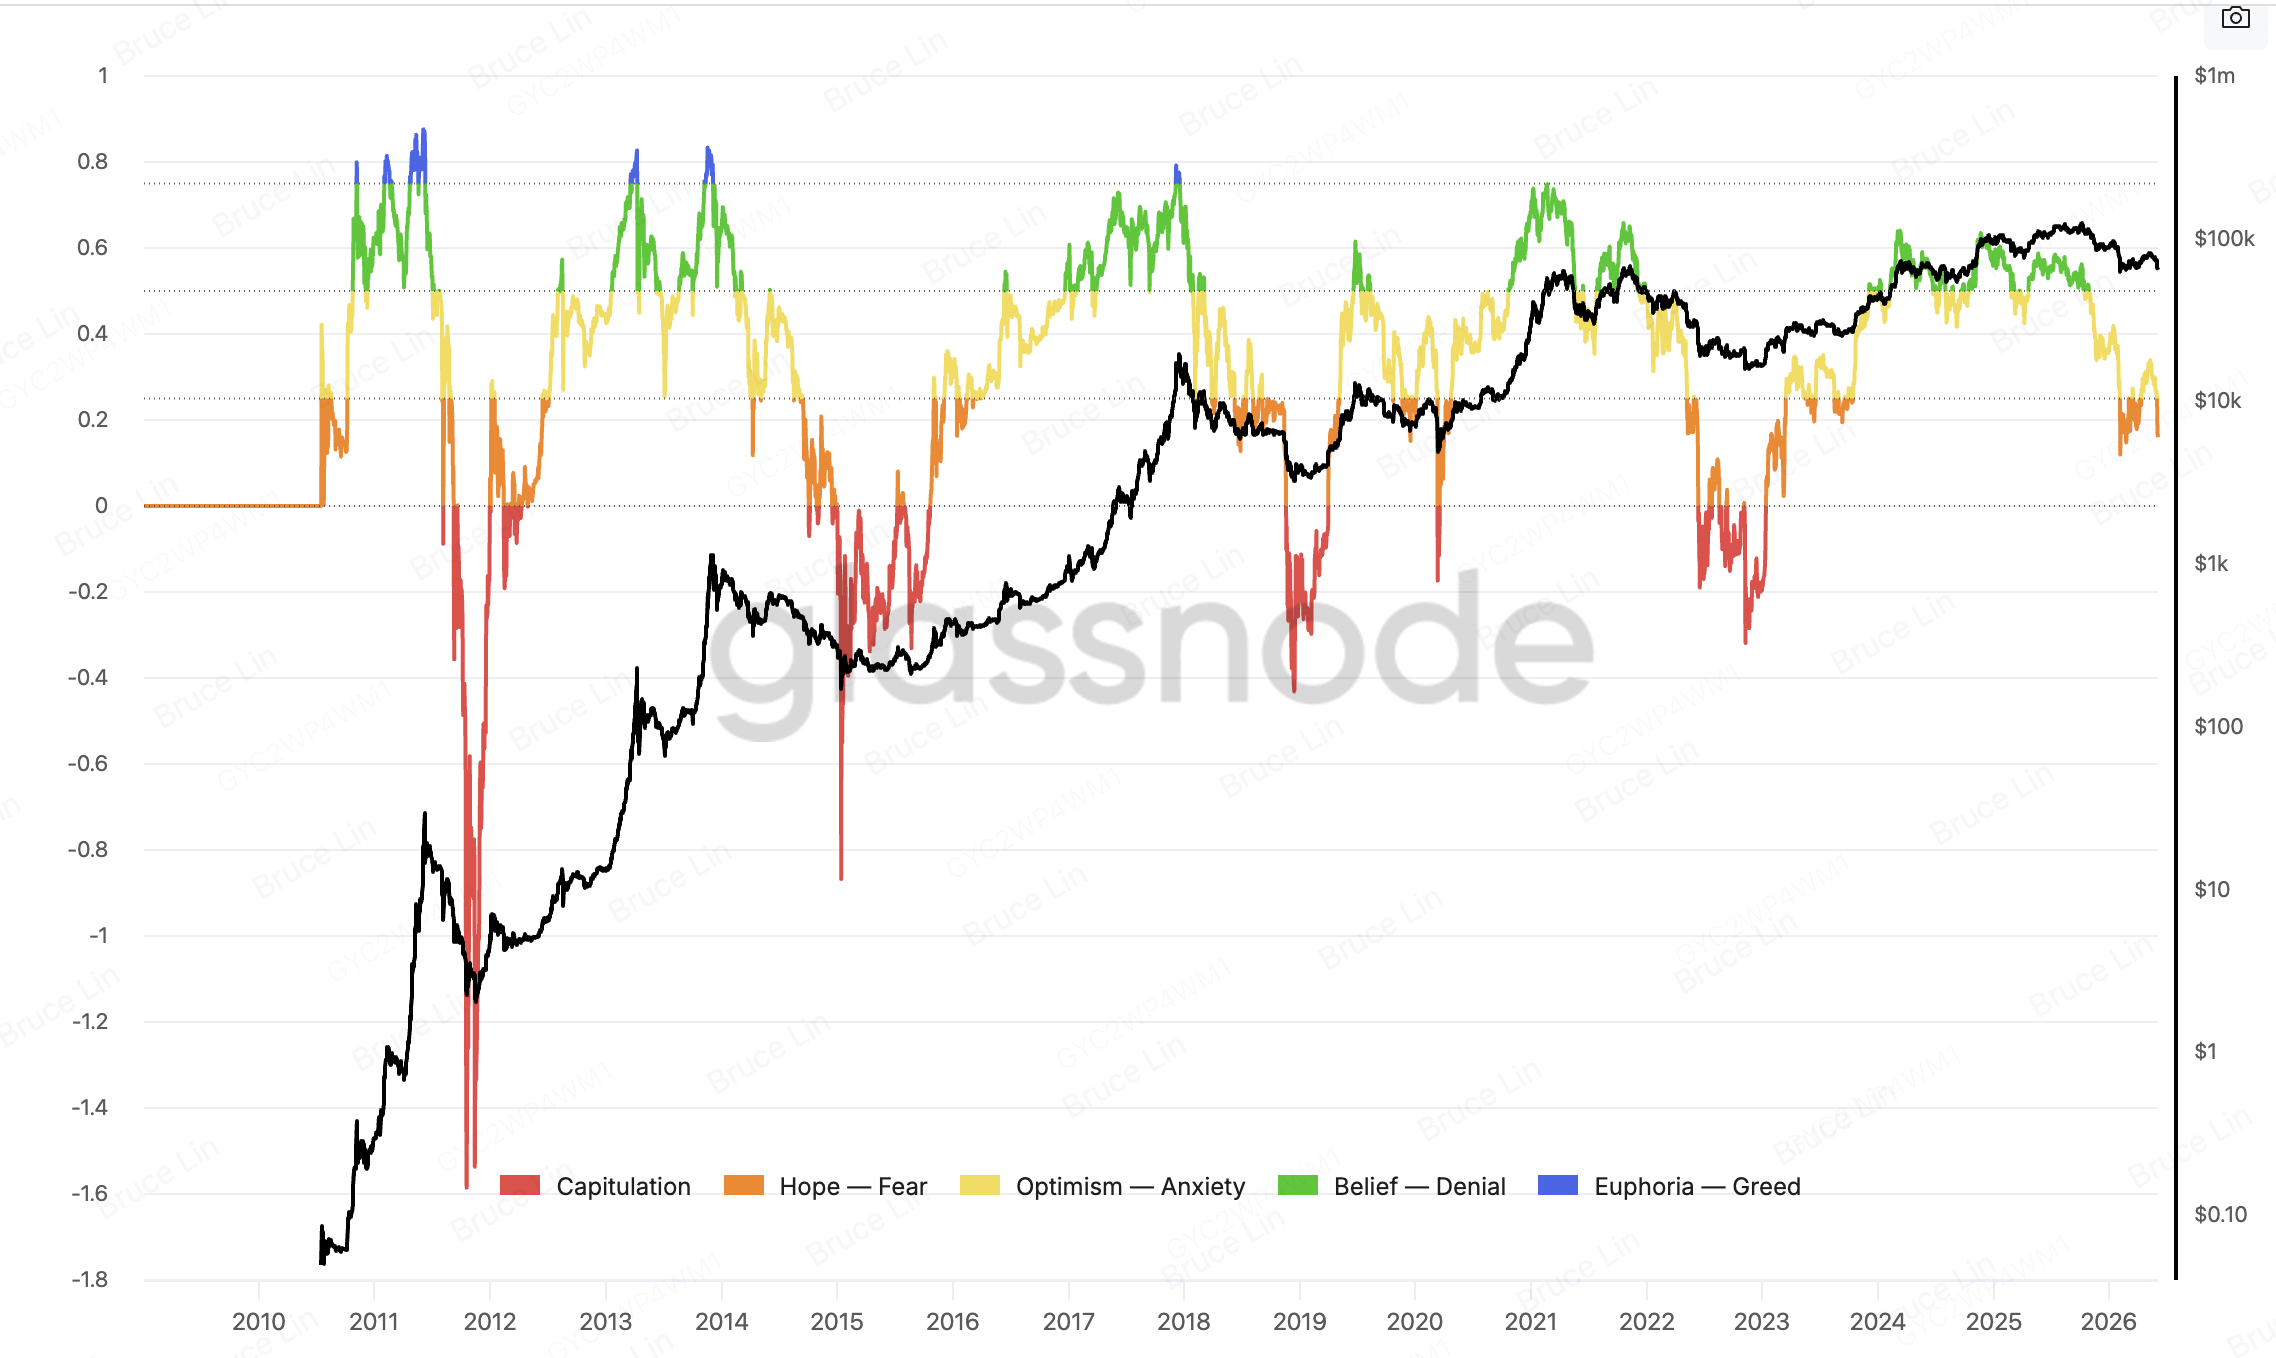
(Source: Glassnode)
While each cycle is different, major corrections typically occur after Bitcoin reaches a cycle peak. One recurring characteristic of previous bear markets is that Bitcoin eventually falls below important on-chain cost basis metrics before establishing a long-term bottom.
In each previous bear market, Bitcoin eventually traded near or below the average acquisition cost of long-term holders before a sustainable recovery began.
This is why many analysts are closely monitoring realized price and long-term holder cost basis levels in 2026.
What Is Bitcoin's Realized Price and Why Does It Matter?
Bitcoin's realized price is one of the most important on-chain valuation metrics. Unlike market price, realized price calculates the average price at which all circulating Bitcoin last moved on-chain. In other words, it estimates the aggregate cost basis of the entire network.
If Bitcoin trades above realized price, most holders are in profit. If Bitcoin trades below realized price, the average holder is underwater.
Historically, prolonged trading below realized price has been rare and often associated with major bear market bottoms.
According to current on-chain data in June 2026, Bitcoin's realized price is approximately $54,000. This level therefore represents a critical support zone from a long-term valuation perspective.
If Bitcoin were to decline toward $54,000, many investors would view the asset as approaching its aggregate network cost basis. That does not guarantee a bottom, but historically it has been an area where significant long-term demand tends to emerge.
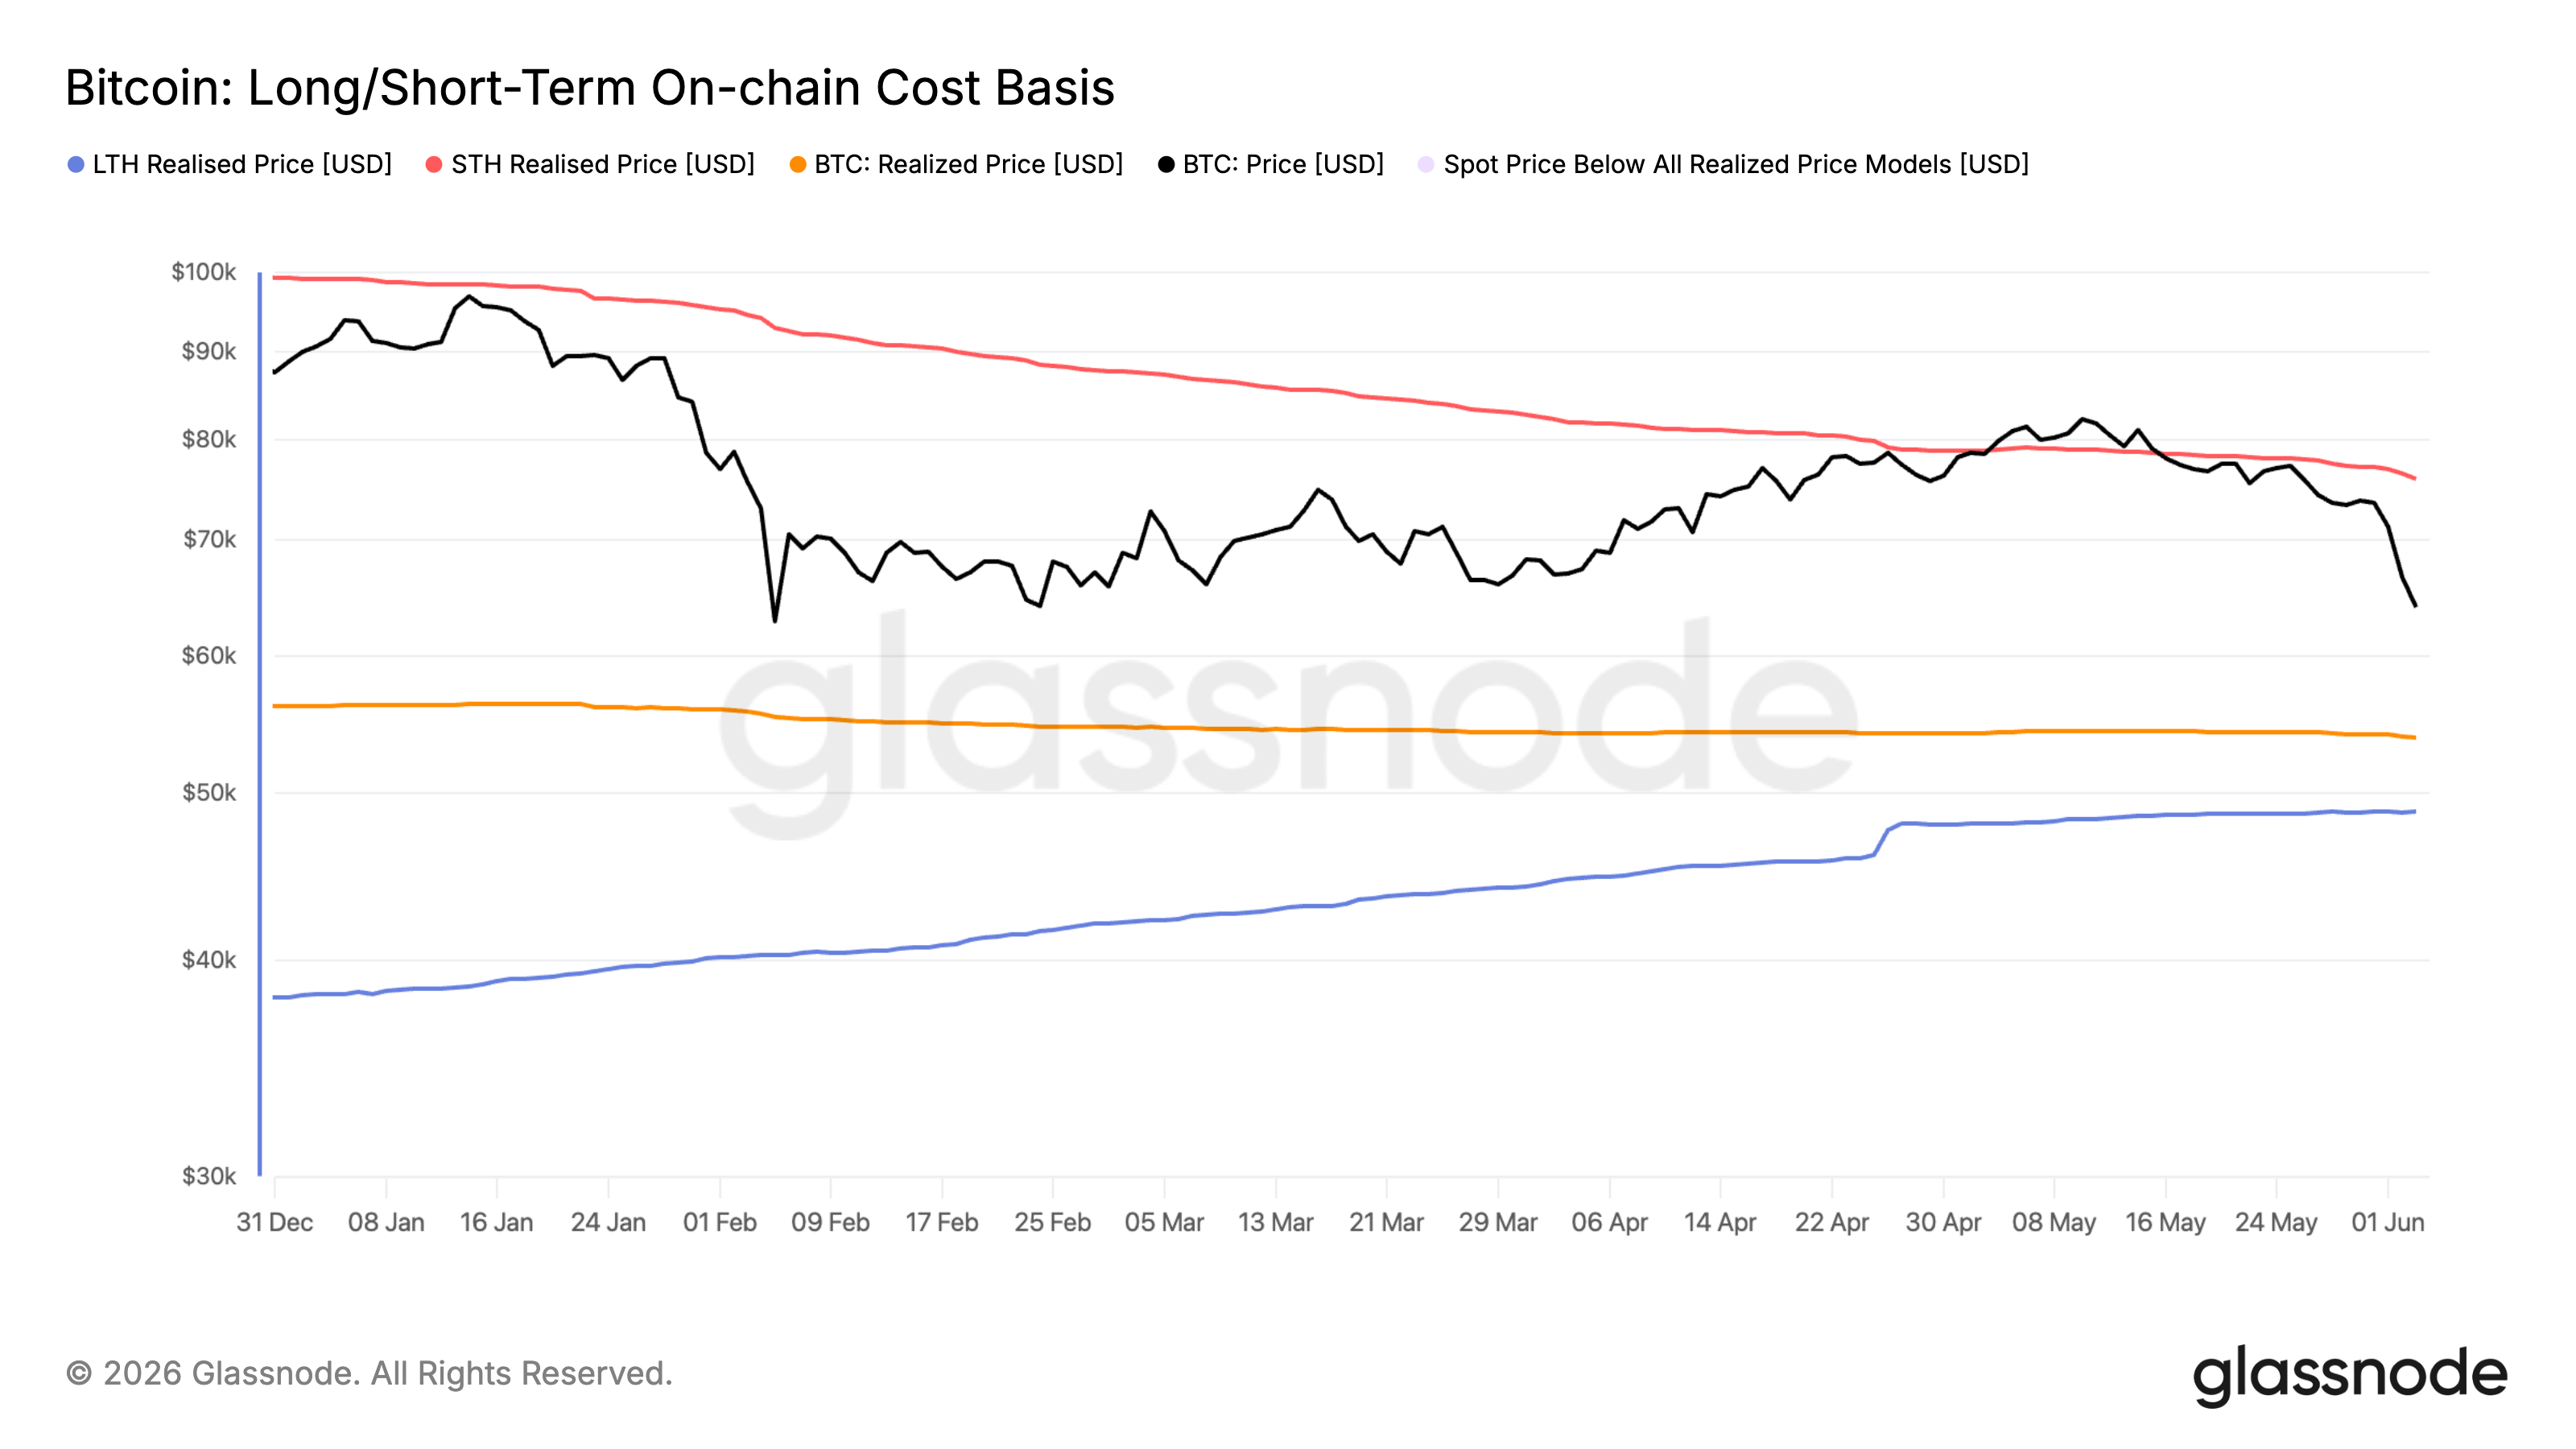
(Source: Glassnode)
Why Is the Long-Term Holder Cost Basis Important?
The average acquisition cost of long-term holders may be even more important than realized price. Long-term holders are typically defined as investors who have held Bitcoin for at least 155 days. These participants have historically demonstrated stronger conviction and lower sensitivity to short-term market volatility.
According to current on-chain estimates, the average cost basis of long-term Bitcoin holders is approximately $48,000. This metric has repeatedly served as a major support level during previous market cycles.
The reason is straightforward. Long-term holders generally represent the strongest hands in the market. When Bitcoin approaches their average purchase price, selling pressure often decreases while long-term accumulation increases.
The relationship can be summarized as follows:
| On-Chain Level | Approximate Value | Historical Significance |
| Realized Price | ~$54,000 | Network-wide cost basis |
| Long-Term Holder Cost Basis | ~$48,000 | Strong historical support |
| Market Price | Variable | Current market sentiment |
If Bitcoin falls below both levels, history suggests the market may be approaching late-stage capitulation. That does not mean prices cannot temporarily overshoot lower, but it has often marked periods of exceptional long-term opportunity.
Could Bitcoin Fall Below $54,000 and $48,000?
Possible.
Bitcoin has historically overshot key support levels during periods of panic. Examples include:
2018 Bear Market
Bitcoin fell substantially below realized price before eventually recovering.
March 2020 Crash
The COVID-related market panic briefly pushed Bitcoin well below several valuation metrics.
2022 Bear Market
The collapse of major crypto firms caused Bitcoin to trade below realized price for an extended period. However, these periods also coincided with some of the most attractive long-term accumulation opportunities in Bitcoin's history.
If Bitcoin falls toward the $54,000 to $48,000 range in 2026, investors should pay close attention to:
-
Exchange inflows and outflows
-
Stablecoin liquidity growth
-
Long-term holder behavior
-
Miner selling activity
-
ETF flows
-
Realized losses across the network
Together, these indicators provide a clearer picture than price alone.
How to Trade Bitcoin on KuCoin During Volatile Markets
Volatility creates both risks and opportunities for crypto traders. For investors who believe Bitcoin's long-term fundamentals remain intact, market corrections can provide opportunities to gradually build positions rather than attempting to time exact bottoms.
KuCoin provides several tools that can help investors navigate volatile conditions, including spot trading (BTC/USDT), futures trading, advanced charting tools, and risk management features.
Many experienced investors prefer dollar-cost averaging during uncertain market environments because it reduces the impact of short-term price fluctuations. Instead of trying to predict the exact bottom, investors gradually accumulate over time while monitoring key on-chain indicators such as realized price and long-term holder cost basis.
New users can now register at KuCoin and Get Up to 11,000 USDT in New User Rewards.

Conclusion
Bitcoin's decline and the liquidation of more than $1 billion in leveraged positions have understandably increased concerns about the possibility of a deeper correction in 2026. However, liquidation events alone do not determine whether a bear market will continue.
The more important signals come from Bitcoin's on-chain data. Current estimates place Bitcoin's realized price near $54,000 and the average cost basis of long-term holders around $48,000. Historically, these levels have served as critical support zones during previous market cycles.
No indicator can guarantee where Bitcoin will bottom. Markets are influenced by macroeconomic conditions, investor sentiment, liquidity, and unexpected events. Nevertheless, the combination of realized price and long-term holder cost basis remains one of the most reliable frameworks for evaluating Bitcoin's long-term valuation.
If Bitcoin eventually declines toward these levels, history suggests investors should pay close attention. While short-term volatility may continue, such periods have often marked the transition from fear-driven selling toward long-term accumulation.
FAQs
What caused the recent Bitcoin liquidation cascade?
Excessive leverage was the primary cause. As Bitcoin prices fell, leveraged long positions were automatically closed, creating additional selling pressure and triggering more liquidations.
Is Bitcoin below realized price automatically a buy signal?
No. Trading below realized price has historically indicated undervaluation, but prices can remain below realized price for extended periods during bear markets.
Why do long-term holder metrics matter?
Long-term holders have historically shown stronger conviction and lower selling activity. Their average cost basis often acts as an important support level.