
What Is the KDJ Stochastic Indicator and How Do Traders Use It in Real Trading?
Thesis
The KDJ indicator is a momentum oscillator that helps traders measure the strength of price moves and spot potential turning points. It builds on the classic stochastic oscillator by adding a third line called J, which makes signals more sensitive to rapid changes. Traders use KDJ across stocks, forex, crypto, and futures to identify when an asset might be overbought or oversold, when momentum is shifting, and when a reversal could be near.
The indicator compares the current closing price to the recent high-low range, then smooths the data into three lines that swing between 0 and 100, with J sometimes going beyond those bounds. This setup gives clear visual cues on charts for timing entries and exits without relying only on price action. Many traders like KDJ for short-term and swing trading because it reacts to momentum shifts faster than some slower indicators.
The KDJ indicator helps traders catch momentum shifts and potential reversals by showing overbought and oversold conditions through its three lines, giving practical signals for buy and sell opportunities in fast-moving markets.
KDJ Indicator Basics: What Makes It Different from Standard Stochastic
The KDJ indicator comes from the stochastic oscillator but adds an extra J line for sharper insights. While the regular stochastic has just %K and %D lines, KDJ includes J, calculated as 3 times K minus 2 times D. This J line amplifies movements and can spike above 100 or drop below 0, highlighting extreme conditions early. The K line tracks raw momentum based on where the close sits in the recent range. The D line smooths K to reduce noise. Together, the three lines help traders see not just direction but also the speed and strength of momentum changes.
KDJ works well in ranging or trending markets, though it shines most when volatility creates clear swings. On charts, the lines appear in a separate panel below price, oscillating like a speedometer for buying and selling pressure. Traders watch interactions between K, D, and J for clues about exhaustion or building force. The tool is popular in crypto and futures because those markets often show quick momentum flips that KDJ can flag before price fully reverses. Understanding the three-line dynamic sets KDJ apart as a more detailed momentum reader than basic two-line versions.
How the KDJ Formula Works Step by Step
KDJ starts with the raw stochastic value, or RSV. For a common 9-period setting, RSV equals (current close minus the lowest low over 9 periods) divided by (highest high minus lowest low over 9 periods), then multiplied by 100. This gives a percentage showing how close the price is to the top or bottom of its recent range.
Next, K is a 3-period moving average of that RSV, smoothing the raw number. D then takes a 3-period moving average of K for even more stability. Finally, J equals 3K minus 2D, creating a faster, more exaggerated line that leads the others. These calculations update with every new period, so the lines keep moving. Default parameters are often 9 for the lookback, 3 for K smoothing, and 3 for D smoothing, written as (9,3,3).
Shorter periods make KDJ more sensitive for scalping, while longer ones smooth it for swing trading. The math focuses purely on price range and closing position, ignoring volume or other factors. This simplicity lets traders calculate values manually if needed or rely on platform tools. The J line's design makes it react quickest, often crossing extremes first and warning of potential turns before K and D confirm.
Understanding the Three Lines: K, D, and J in Action
The K line moves fastest among the three and shows immediate momentum. It reacts quickly to price changes, making it the most sensitive. The D line follows as a smoother version, acting like a signal line that filters out minor wiggles. When K crosses D, it often generates the main trading signals. The J line, being the most aggressive, stretches further and highlights the strength or weakness of the move. If J shoots above 100 while K and D sit high, momentum looks extremely strong but possibly exhausted.
When J drops below 0 with K and D low, selling pressure may be overdone. In practice, traders watch all three together: aligned lines suggest strong momentum in one direction, while divergences or crosses point to shifts. On a daily chart, the lines might stay elevated during a steady uptrend, with J occasionally dipping to test support.
In choppy sessions, they crisscross frequently, signaling caution. The J line adds an early warning layer that standard stochastic lacks, helping traders anticipate rather than just react. Many set alerts when J crosses key levels or when K interacts with D. This three-line view turns raw momentum data into actionable patterns on any timeframe.
Overbought and Oversold Levels: Reading the 80 and 20 Zones
KDJ uses 80 as the overbought threshold and 20 as oversold. When lines climb above 80, especially with J pushing past 100, the asset has risen sharply and buying momentum may be tiring, raising chances of a pullback or reversal. Conversely, readings below 20, with J under 0, suggest heavy selling that could be nearing an end, opening the door for a bounce. These zones do not guarantee immediate turns but flag when prices have stretched far from average.
In strong trends, price can stay overbought for long periods, so traders avoid selling solely on high readings without confirmation. The same holds for oversold in downtrends. J often hits extremes first, giving an advance heads-up. For example, in crypto on a 15-minute chart, J spiking above 100 near resistance might prompt watching for a short setup if K crosses below D. Many adjust levels slightly for different assets, perhaps 85/15 in volatile markets, to reduce false signals. Combining zone readings with price action, such as candles rejecting highs in overbought territory, strengthens the message. This approach helps traders decide when to take profits, tighten stops, or prepare for counter-trend moves.
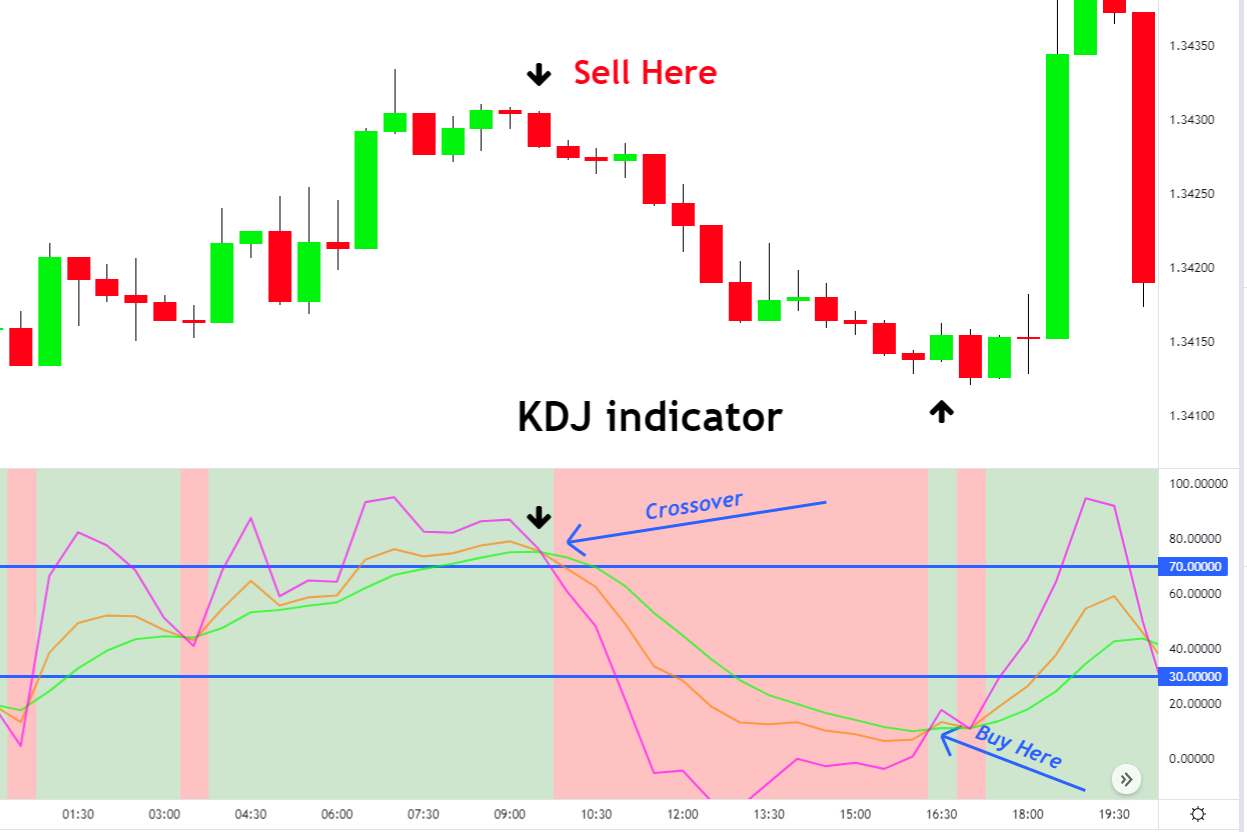
Golden Cross and Death Cross Signals in KDJ
A golden cross in KDJ happens when the K line crosses above the D line, particularly in the oversold zone below 20. This setup often signals building bullish momentum and a potential buy opportunity. The death cross is the reverse: K crossing below D in the overbought zone above 80, pointing to weakening momentum and a possible sell. When J joins the move, crossing with or ahead of K, it adds conviction. For instance, all three lines turning upward from low levels after a golden cross can confirm a short-term rebound.
These crosses work best with context, like support or resistance on the price chart. In ranging markets, crosses happen often and can produce whipsaws, so many traders filter them by requiring the cross to occur near extremes. On higher timeframes, such as daily charts for stocks, a golden cross near 20 might mark the start of a multi-day swing higher.
Scalpers on lower timeframes use quicker settings to catch intraday versions of these signals. The J line's sensitivity helps time entries more precisely around the cross. Traders often wait for the cross to complete and then look for a retest or continuation candle before acting.
Divergence Trading with KDJ for Reversal Setups
Divergence occurs when price and KDJ move in opposite directions, hinting at weakening momentum. Bullish divergence shows price making lower lows while KDJ forms higher lows, suggesting selling pressure is fading and a turnaround could come. Bearish divergence appears as price hits higher highs but KDJ makes lower highs, indicating buying strength may be running out. The J line often highlights these mismatches clearly because of its range. Traders watch for regular or hidden divergences near overbought or oversold zones for higher-probability reversals.
In practice, a bearish divergence at resistance with J rolling over from above 100 might encourage a short position. Confirmation comes from a K-D death cross or price breaking structure. Crypto traders frequently spot these on 4-hour charts during volatile swings. Divergences do not always reverse immediately, so risk management with stops beyond recent highs or lows is essential.
Combining divergence with volume or another momentum tool like RSI reduces false signals. This method shifts focus from pure crosses to underlying strength changes, offering earlier clues in maturing trends. Many successful setups involve waiting for divergence plus a cross in the expected direction.
Practical KDJ Settings for Different Trading Styles
Settings matter because they balance sensitivity and reliability. The default (9,3,3) suits many short-term traders, providing responsive lines without excessive noise. Day traders and scalpers often shorten to (5,3,3) or (7,3,3) on 5-minute or 15-minute charts to catch quick momentum shifts in crypto or forex. Swing traders prefer (14,3,3) or longer smoothing on daily charts for steadier signals that filter intraday chop. In high-volatility assets, some increase periods to (14,5,5) to smooth the J line and cut false crosses. Test settings on historical data for your market, crypto might need faster parameters than blue-chip stocks. Platforms let you adjust the lookback for RSV and smoothing for K and D separately.
Shorter settings generate more signals but increase whipsaws in sideways conditions. Longer ones miss early moves but confirm bigger turns. Many traders run two versions on the same chart: a fast one for timing and a slow one for trend bias. Always match the period to your holding time, quick for intraday, extended for multi-day swings. Backtesting different combinations on your assets reveals what performs best in trending versus ranging environments.
KDJ Scalping and Day Trading Strategies in Volatile Markets
Scalpers apply KDJ on low timeframes like 15-minute charts with short parameters to exploit brief momentum exhaustion. Look for J spiking above 100 near resistance, followed by K crossing below D as a short entry, especially if price shows rejection candles. The reverse, J below 0 at support with a K-D golden cross, signals longs. Tight stops go just beyond the recent swing, targeting quick moves to the next level or average true range. Volume confirmation helps avoid traps in low-liquidity periods. In crypto, where volatility spikes, these setups appear multiple times per session. Day traders combine KDJ with support/resistance or a fast moving average for bias, only take longs when price stays above a key average and KDJ turns bullish from oversold.
Exit rules might include J reaching the opposite extreme or a opposite cross. Risk small portions per trade since signals can fail in news-driven moves. Practice on demo accounts to master the rhythm of crosses and extremes. This style demands quick decisions but offers frequent opportunities when markets move with clear range behavior.
Swing Trading with KDJ: Capturing Multi-Day Moves
Swing traders use KDJ on 4-hour or daily charts with moderate settings to ride momentum over several days or weeks. A golden cross from below 20 near chart support often marks a good entry for longs, with J confirming by turning higher. Trail stops using the D line or recent lows as price advances. Take profits when J hits overbought and K crosses down, or when price reaches a measured target. In downtrends, death crosses from above 80 near resistance trigger shorts. Divergences add weight, bullish ones at lows encourage holding through pullbacks. Combine with trend filters like a 50-period moving average so you align with the bigger picture.
This reduces counter-trend losses. In stocks or forex pairs, these setups capture swings after earnings or economic data when momentum builds steadily. Position size based on account risk keeps drawdowns manageable. The smoother signals on higher timeframes mean fewer trades but higher average wins when trends develop. Review weekly charts to confirm the larger context before committing to a swing.
Common Pitfalls with KDJ and How to Avoid Whipsaws
KDJ can produce many false signals in sideways or low-volatility markets, where lines cross repeatedly without follow-through. To counter this, add filters such as requiring crosses only in extreme zones or confirming with price breaking structure. Strong trends can keep readings overbought or oversold for extended periods, so avoid mechanical selling at 80 without additional evidence like divergence or volume drop. The J line's sensitivity creates extra noise, some traders ignore minor J wiggles and focus on K-D interactions. News events or gaps often distort readings temporarily, making it wise to pause trading around major releases.
Over-optimizing parameters on past data leads to poor live performance, so keep settings simple and test across market conditions. Relying solely on KDJ without support from price action or other tools increases risk. Use it as part of a system rather than in isolation. Proper risk management, with stops based on recent swings or ATR, protects capital when signals fail. Reviewing trades in a journal helps spot patterns in when KDJ works best versus when it struggles.
Combining KDJ with Other Indicators for Stronger Confirmation
Traders rarely use KDJ alone. Pairing it with moving averages provides trend context, take KDJ buy signals only when price sits above a rising 50-period EMA. RSI can confirm extremes: an oversold KDJ plus RSI below 30 strengthens a long case. MACD crossovers alongside a KDJ golden cross add momentum agreement for higher conviction. Volume should rise on valid signals to show real participation. In crypto, some overlay on-chain metrics for extra depth. Bollinger Bands help by showing when price touches bands at KDJ extremes, highlighting potential reversals. A simple rule might require a K-D cross, J turning in the same direction, and price respecting a key level.
This multi-indicator filter cuts marginal setups. Avoid overcrowding the chart, two or three complementary tools usually suffice. Test combinations on your assets to find synergy without conflicting signals. The goal is confirmation that reduces false entries while keeping the system responsive. Many profitable approaches use KDJ for timing within a trend defined by moving averages or higher-timeframe structure.
How to Add KDJ to Your Charts and Start Trading with It
Most charting platforms make adding KDJ straightforward. Search for “KDJ” or “Stochastic” in the indicators menu, then adjust parameters to your preferred settings like (9,3,3). Choose clear colors, perhaps blue for K, orange for D, and red for J, to spot interactions easily. Start on a familiar asset and timeframe, such as a daily stock chart or 1-hour crypto pair. Use the replay feature to scroll through past price action and practice reading crosses, zones, and divergences in real time. Keep a simple journal noting setups, outcomes, and what confirmed or invalidated the signal. Begin with paper trading to build confidence before risking capital.
Focus first on identifying overbought and oversold zones, then add crosses and divergences. Review performance weekly and tweak one element at a time if needed. Many free resources and built-in strategy testers help refine usage. Over time, KDJ becomes intuitive, turning momentum data into clear stories about exhaustion or strength. Consistent practice reveals its value in trending phases and teaches patience during choppy ones.
Frequently Asked Questions
1. What exactly is the KDJ indicator?
The KDJ indicator is a momentum oscillator based on the stochastic formula that adds a third J line to the standard K and D lines. It measures where the current close sits within the recent high-low range to highlight momentum strength and potential reversals.
2. How is KDJ different from the regular stochastic oscillator?
KDJ uses the same core calculation as stochastic but includes the J line, calculated as 3K minus 2D. This extra line reacts faster and can move beyond 0-100, providing earlier and more exaggerated signals for overbought or oversold conditions.
3. What do the overbought and oversold levels mean in KDJ?
Readings above 80, especially with J over 100, indicate overbought conditions where upward momentum may exhaust and a pullback could occur. Readings below 20, with J under 0, signal oversold conditions where selling may be overdone and a bounce is possible.
4. What are golden cross and death cross in KDJ?
A golden cross is when the K line crosses above the D line, often from oversold levels, suggesting a buy opportunity. A death cross is K crossing below D from overbought levels, pointing to a potential sell or short setup. J confirmation strengthens these signals.
5. Can KDJ be used for day trading and scalping?
Yes, with shorter settings like (5,3,3) on 5-minute or 15-minute charts, KDJ helps scalpers and day traders spot quick momentum shifts, exhaustion at extremes, and intraday cross signals, especially when combined with support and resistance levels.
6. What are the main limitations of the KDJ indicator?
KDJ can generate frequent false signals or whipsaws in sideways markets, lag in very strong trends where it stays extreme for long periods, and produce noise from the sensitive J line. It works best with confirmation from price action or other tools rather than in isolation.
Disclaimer
This content is for informational purposes only and does not constitute investment advice. Cryptocurrency investments carry risk. Please do your own research (DYOR).