

Is Bitcoin's Bear Market Ending in 2026 H2? What Traders Should Expect
2026/07/21 17:01:00
Introduction
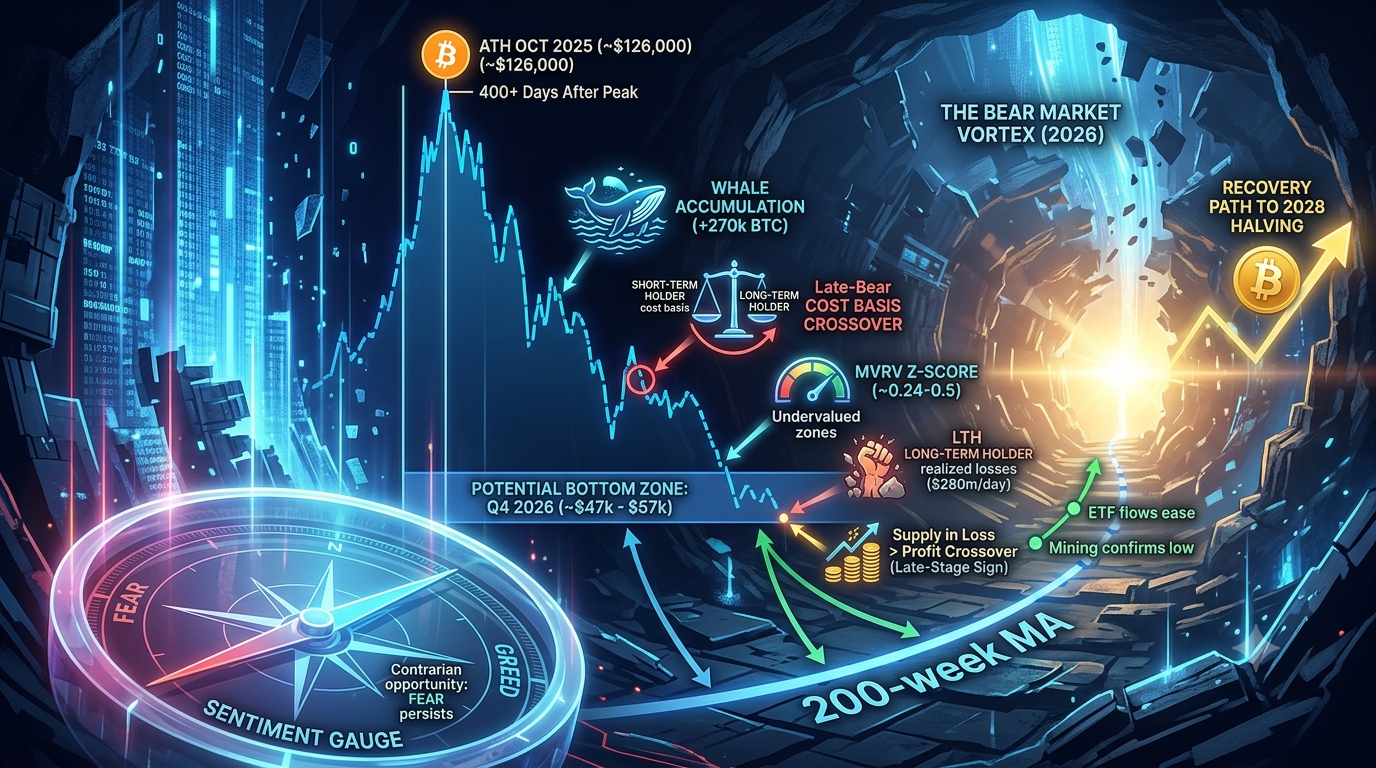
Bitcoin trades near $64,000 in mid-July 2026, roughly 50% below its October 2025 all-time high around $125,000–$126,000. This qualifies as a bear market by standard definitions, yet multiple on-chain signals, historical cycle patterns, and whale accumulation indicate the downturn has entered its final stages.
The bear market is not fully over yet, but evidence strongly suggests a bottom could form in Q4 2026, potentially between $47,000 and $57,000, before a new bull phase. Short-term holder cost basis recently crossed below long-term holder levels—a classic late-bear signal—while whales added over 270,000 BTC worth billions. Investors should prepare for possible further volatility rather than expecting an immediate reversal.
What Defines the Current Bitcoin Bear Market Status?
Bitcoin remains in a bear market as of July 2026 because it sits more than 20% below its cycle peak, with sentiment in fear zones and several valuation metrics still depressed. The drawdown of approximately 48–52% stays milder than the 70–85% drops in prior cycles (2018, 2022), reflecting a maturing market with stronger institutional support.
Price action shows resilience: BTC rebounded from a June low near $57,700–$58,500 toward $64,000–$65,000 following cooler CPI data. However, it trades well below key cost bases—the True Market Mean (~$76,600) and short-term holder cost basis (~$69,000–$72,000)—for over five months.
This prolonged period in "deep value" territory historically precedes bottoms, not mid-cycle declines. ETF outflows eased in July with some positive days, but net flows for Q2 stayed negative, underscoring incomplete capitulation.
How Do Historical 4-Year Cycles Compare to 2026?
Bitcoin's halving-driven cycles provide the clearest roadmap. Previous bear markets bottomed an average of ~384 days after the peak; as of July 2026, roughly 280–300 days have passed since the October 2025 high, placing us in the final stretch.
Every prior bear market tested the 0.618 Fibonacci retracement of the previous bull run and often the 200-week or 350-week moving average. Analysts note the current cycle has only tapped upper ranges of these levels so far, suggesting room for a final low in Q4.
Drawdown patterns have moderated: Earlier cycles saw 70–80%+ drops; the current ~50% decline aligns with institutionalization reducing volatility extremes. The 91-day window that ended prior bears (final quarter capitulation) opened in July 2026, pointing to October as a high-probability bottom timeframe.
Models project a potential floor near $47,000 (regression) to $44,000–$57,500 (Fib and LTH cost basis overlap), a 22–26% drop from recent highs.
Which On-Chain Indicators Signal a Late-Stage Bear Market?
Several metrics flash bottoming signals:
-
MVRV Ratio and Z-Score: The Market Value to Realized Value ratio hovers near 1.2, approaching undervalued zones that marked 2018 and 2022 bottoms. The Z-score nears 0.24–0.5, close to the zero line where every cycle low occurred.
-
Cost Basis Crossover: Short-term holder cost basis dipped below long-term holder levels, requiring only short confirmation to validate the final bear phase.
-
Long-Term Holder Capitulation: Realized losses from LTHs hit $280 million daily peaks—the highest since December 2022—indicating exhaustion among strong hands. Miner capitulation and Puell Multiple also echo prior lows.
-
Supply in Loss: Bitcoin in unrealized loss recently exceeded supply in profit for the first time since the FTX collapse, a crossover that preceded bottoms within 3 months historically.
Whales accumulated aggressively—$4.2 billion in two months and 270,000 BTC total—while open interest de-risked, flushing leverage.
These indicators collectively show the bear market is aging and exhausted, even if one final flush remains possible.
What Technical Levels Matter Most for a Potential Bottom?
Bitcoin holds critical support near the 200-week moving average (~$62,000 range). A break lower targets the 0.618 Fib retracement and deeper supports around $47,000–$55,000.
Weekly bullish divergences appear, mirroring the 2022 setup 147 days in (vs. 161 days then). RSI and MACD show constructive signals on higher timeframes, but momentum stays fragile below $67,000–$70,000 resistance.
A sustained reclaim of $65,000–$70,000 on weekly closes would shift bias bullish. Until then, risk of retesting June lows or lower persists into Q3/Q4.
How Do Macro Factors and Sentiment Influence the Outlook?
Macro conditions dominate: Cooling inflation and potential Fed easing later in 2026 could catalyze recovery, while persistent hawkishness risks deeper pain. ETF flows, stablecoin liquidity, and corporate adoption serve as key demand barometers.
Sentiment remains negative, with Bull Score Index in bearish territory (~20/100), creating contrarian opportunity. July seasonality provided relief rallies even in past bears, but August–September often resumed weakness before Q4 turns.
Should You Trade Bitcoin on KuCoin During This Phase?
KuCoin offers efficient tools to navigate late-bear volatility and position for the next leg up. With low fees, advanced charting, futures for hedging, and spot trading, KuCoin suits both accumulation on dips and tactical swings.
Whether you’re spot trading BTC/USDT pairs, using futures for leveraged exposure, or exploring margin, KuCoin provides seamless access. The exchange supports instant deposits via multiple channels and features user-friendly charting for monitoring cycle developments.
If you worry about the recent volatility, you may resort to KuCoin's copytrading hub or TraderPro campaign, to follow other lead traders' strategies, or register as the lead traders.

Conclusion
Bitcoin's 2026 bear market shows clear late-stage characteristics: cost basis signals flashing, aggressive whale accumulation, MVRV nearing capitulation zones, and cycle timing aligning with Q4 bottoms. While a final leg down toward $47,000–$57,000 cannot be ruled out, the foundation for recovery strengthens as leverage unwinds and long-term holders demonstrate resilience.
Historical patterns, moderating drawdowns, and improving macro tailwinds suggest the pain phase nears its end. Patient investors focusing on fundamentals rather than short-term noise stand best positioned for the next bull cycle leading into the 2028 halving. KuCoin provides the platform to act decisively—whether accumulating dips or hedging exposure—during this transitional period. The data points to opportunity amid exhaustion, not endless decline.
FAQs
1. Has Bitcoin already reached its cycle low in 2026?
While June lows near $58,000 marked a significant trough, multiple indicators—including incomplete LTH capitulation and untested deeper Fib supports—suggest a final low likely remains ahead in Q4.
2. What price target do analysts project for the Bitcoin bottom?
Consensus clusters around $47,000–$57,500, based on regression models, 0.618 Fib retracement, and long-term holder cost basis overlap.
3. Are Bitcoin ETFs still seeing outflows?
Q2 recorded heavy outflows exceeding $4 billion, but July showed initial positive days. Sustained inflows will be crucial for confirming the bear market's end.
4. How does the current drawdown compare to previous Bitcoin bears?
The ~50% drop is milder than the 70–85% corrections in 2018 and 2022, reflecting institutional participation and market maturation.
5. When might a new Bitcoin bull market begin?
Confirmation likely follows a Q4 2026 bottom, with recovery accelerating into 2027 as ETF demand stabilizes, leverage resets, and macro easing supports risk assets.