
Beyond the Static Price: Mastering Market Rhythm with the Average True Range(ATR)
2026/04/19 18:20:42

The Average True Range serves as the definitive heartbeat of financial markets, shifting the focus from where a price is going to how much it is moving, thereby providing a mechanical blueprint for risk management and trade sizing that adapts to shifting volatility in real-time.
The Hidden Pulse of Price Action Mechanics
Understanding the Average True Range begins with recognizing that markets do not move in straight lines but in rhythmic expansions and contractions. Developed by J. Welles Wilder Jr., the ATR is not a trend indicator but a volatility gauge that calculates the true distance a price travels over a specific period.
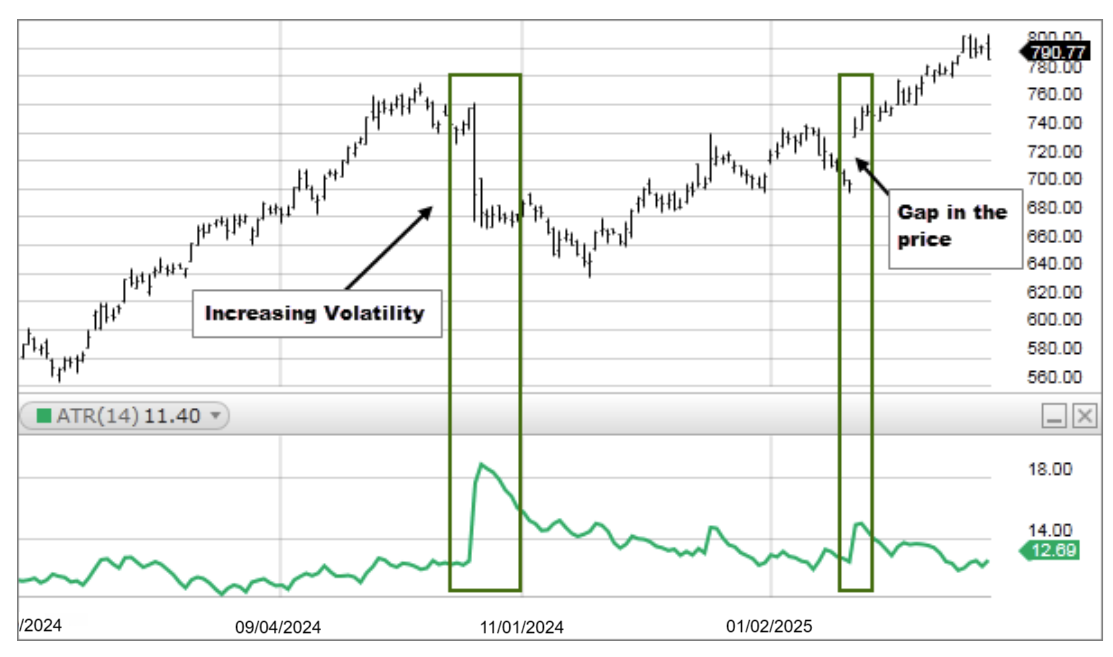
By looking at the current high minus the current low, and accounting for price gaps from the previous close, the ATR captures the total market energy that standard range calculations often miss. In today’s high-frequency trading environment, the ATR acts as a vital filter, helping traders distinguish between a meaningful breakout and standard statistical noise.
When the ATR spikes, it signals a period of heightened emotional intensity among participants, often preceding a major trend shift. Conversely, a shrinking ATR suggests a market that is falling asleep, potentially coiling for an explosive move. Professional desks leverage this metric to safeguard against unexpected price swings that could potentially eliminate a poorly positioned position.
Decoding the Math Behind the True Range Formula
While the concept of a price range is simple, the "True Range" component is what makes this tool indispensable for modern charting. The formula takes the greatest of three values: the current high minus the current low, the absolute value of the current high minus the previous close, and the absolute value of the current low minus the previous close.
This specific inclusion of the previous close is critical because it accounts for "gaps" that occur overnight or during news events. If a stock closes at $100 and opens the next day at $105, a standard range calculation would ignore those five dollars of movement, whereas the ATR captures them as part of the total volatility. The "Average" part of the name typically refers to a 14-period moving average of these True Range values. By smoothing these numbers, the indicator provides a stable baseline that reflects the recent historical temperament of the asset.
Why Modern Volatility Defies Traditional Fixed Targets
A major pitfall for many retail participants is the use of fixed-pip or fixed-dollar stop losses regardless of market conditions. In a quiet market, a 20-pip stop might be excessive, while in a volatile session, that same 20-pip stop is likely to be triggered by random noise before the trade has a chance to breathe. The ATR solves this by providing a dynamic yardstick. If the ATR on a daily chart is 1.50, it means the asset typically moves $1.50 from high to low each day. Setting a stop loss at 0.50 in this environment is mathematically suicidal.
By aligning trade parameters with the current ATR, a trader ensures that their strategy respects the current environment rather than an arbitrary number. This shift toward volatility-adjusted trading is a hallmark of sophisticated risk systems. Data from platforms like TradingView shows that traders who adjust their stops based on ATR tend to stay in winning trades longer because they aren't "shaken out" by standard daily fluctuations.
Setting the Perfect Buffer for Stop Loss Placement
The most practical application of ATR is the creation of a "volatility buffer" for exits. Most professionals use a multiple of the ATR, such as 2x or 3x, to set their stop losses. If the current ATR is $2.00, a 2x ATR stop would be placed $4.00 away from the entry price. This ensures that the stop is placed outside the "statistical noise" of the market. If the price reaches that stop, it is no longer just a random fluctuation; it is a genuine change in market character.
This method removes the ego from the equation, as the exit is dictated by the asset’s own movement patterns rather than the trader’s fear or greed. Using this systematic approach allows for a more relaxed trading experience, as you know your stop is backed by the current reality of the market's reach. Detailed strategies on stop placement using these multiples are frequently discussed in technical analysis circles.
The Art of Sizing Positions Based on Market Heat
Position sizing is often the difference between a career trader and a hobbyist, and ATR is the primary engine for this calculation. Instead of trading a fixed number of shares or contracts, volatility-based sizing adjusts the quantity based on the ATR. When volatility is high (high ATR), the stop loss must be wider to accommodate the swings, which means the position size should be smaller to keep the total dollar risk constant. When the market is calm (low ATR), the stop can be tighter, allowing for a larger position size without increasing the total risk to the account.
This balancing act ensures that a single "wild" market doesn't cause a disproportionate loss compared to a "calm" one. This principle, often referred to as "risk parity" at the individual trade level, is a cornerstone of institutional portfolio management. Many educators at BabyPips emphasize that mastering this specific application of ATR is more important than the entry signal itself for long-term survival.
Identifying Exhaustion Points and Overextended Rallies
ATR is an exceptional tool for identifying when a move has likely run its course for the day. Every financial instrument has a fuel tank represented by its daily ATR. If an asset has an average daily range of $3.00 and it has already moved $2.90 by noon, the statistical probability of it moving significantly further without a pullback is low.
Contrarian traders look for these ATR extensions to fade the move or at least to avoid entering a fresh position at the top. It is essentially a "speed limit" for the market. Entering a long position when the price is already at the upper boundary of its daily ATR is often referred to as buying the top of the range, a high-risk move that ignores the statistical reality of mean reversion. By monitoring the percentage of the daily ATR that has been consumed, a trader can gauge the remaining room to run. This concept of exhaustion is vital for day traders who need to know if they are late to the party.
Filtering Fake Breakouts with Volatility Confirmation
Breakout trading is notoriously difficult due to "bull traps" and "bear traps" where price briefly moves past a level only to reverse. ATR provides a filter to help validate these moves.
A genuine breakout is often accompanied by an expansion in ATR, indicating that the move has the momentum and participation required to sustain itself. If the price breaks a key resistance level but the ATR is flat or declining, the move lacks "oomph" and is more likely to fail.
This relationship between price distance and volatility expansion is a key "confluence" factor. Some traders require the price to move a certain multiple of the ATR above a resistance line before they consider the breakout confirmed.
This patient approach might lead to missing the very start of a move, but it significantly reduces the number of losing trades caused by false signals.
Adapting to the Chaos of News-Driven Environments
Economic releases, earnings reports, and geopolitical events cause temporary spikes in ATR that can distort longer-term averages. A skilled analyst knows how to read these spikes not as a permanent change in market regime, but as a temporary increase in temperature.
During these times, the standard 14-period ATR might jump significantly, forcing a trader to decide whether to stay on the sidelines or to radically reduce their position size.
This adaptability is what keeps traders in the game during "black swan" events or high-impact news days. Ignoring the ATR during a news spike is equivalent to driving through a storm without adjusting your speed.
The indicator serves as a warning light, signaling that the "cost of admission" for a trade has increased. By checking the ATR before a major event, you can visualize the potential "splash zone" of the price action.
Using the Chandelier Exit for Maximum Profit Retention
The Chandelier Exit is a specific technical strategy that hangs a trailing stop from the highest high of a trend, with the distance determined by a multiple of the ATR. As the price moves higher and the trend continues, the Chandelier Exit rises along with it, but it never moves downward.
This ratchet effect ensures that a significant portion of open profits is locked in if the market suddenly reverses. It is named because it hangs from the ceiling of the market price.
The beauty of this exit strategy is that it widens during volatile periods to avoid being stopped out prematurely and tightens during calm periods to protect gains. It effectively creates a dynamic safety net that breathes with the market. For traders who struggle with the when to sell dilemma, the ATR-based Chandelier Exit provides a systematic, emotion-free answer.
How Timeframes Alter the Interpretation of Range
The ATR value changes dramatically depending on the timeframe of the chart. A 5-minute ATR reflects the immediate noise of the session, while a weekly ATR shows the structural volatility of the asset over months.
Traders must match their ATR settings to their holding period. A scalper using a daily ATR for their stops would have a stop so wide they would never be filled, while a swing trader using a 1-minute ATR would be stopped out by a single large order.
This concept of fractional volatility is essential for multi-timeframe analysis. Often, a contraction in ATR on a higher timeframe suggests that a massive move is brewing, which can then be timed using ATR expansions on a lower timeframe.
Understanding these layers of volatility allows a trader to see the big picture while acting on the small picture.
Comparing ATR Across Different Asset Classes
ATR is an absolute value, not a percentage, which means it cannot be used to compare two different stocks directly. For example, a $1,000 stock with an ATR of $10 is actually less volatile (1%) than a $10 stock with an ATR of $1 (10%).
To solve this, some analysts use the ATR Percentage (ATRP) to normalize the data across different assets. This allows for a level playing field when deciding which stocks or cryptocurrencies to trade.
If you are looking for high-growth, high-risk plays, you would scan for assets with the highest ATRP. If you are looking for stable, income-generating assets, you would look for the lowest. This cross-asset comparison is vital for building a diversified portfolio that isn't overly concentrated in high-volatility hot sectors.
FAQs
What is the best period setting for the ATR indicator?
The standard 14-period setting is the most reliable for balancing speed and accuracy. While scalpers sometimes use a 7-period setting to capture rapid shifts, the 14-period remains the professional benchmark for consistent volatility measurement.
Can the ATR predict which direction a price will break?
No, the ATR is strictly non-directional and only measures the magnitude of price movement. It functions as a market speedometer rather than a compass; you must pair it with trend indicators to determine the actual trade direction.
How is ATR used to calculate an exact position size?
Divide your total dollar risk by your volatility-based stop distance. For example, if you risk $100 and your 2x ATR stop is $2 away, your position size is 50 shares. This keeps your total risk constant regardless of how much the market swings.
Does a rising ATR always confirm a healthy market trend?
Not always, as extreme ATR spikes often signal "exhaustion" or panic rather than a sustainable move. While steady growth confirms a trend's strength, a vertical jump in volatility usually suggests a reversal or a period of sideways consolidation is imminent.
Why do ATR values vary between different charting platforms?
Differences usually arise from the smoothing method used, such as Wilder’s Smoothing versus a standard Simple Moving Average. Additionally, some platforms include or exclude pre-market and weekend data, which alters the calculation of the True Range.
Is it possible for the ATR to ever reach a value of zero?
It is virtually impossible in a live market, as some level of price fluctuation always exists. However, an exceptionally low ATR indicates extreme market compression, which is a high-probability signal that a violent and explosive breakout is about to occur.
Disclaimer
This content is for informational purposes only and does not constitute investment advice. Cryptocurrency investments carry risk. Please do your own research (DYOR).