
How to Read Candlestick Charts like a Pro
2026/03/26 14:42:02
In the fast-paced world of cryptocurrency trading, understanding market sentiment is the difference between profit and liquidation. Whether you are trading Bitcoin, Ethereum, or the latest altcoins, candlestick charts serve as the primary visual language for price action. Mastering this skill allows traders to decode complex market dynamics and anticipate potential shifts in supply and demand effectively.
In this comprehensive guide, we will explore the essential techniques regarding how to read candlestick charts to help you identify high-probability trading opportunities across various timeframes and market conditions.
Key Takeaways
-
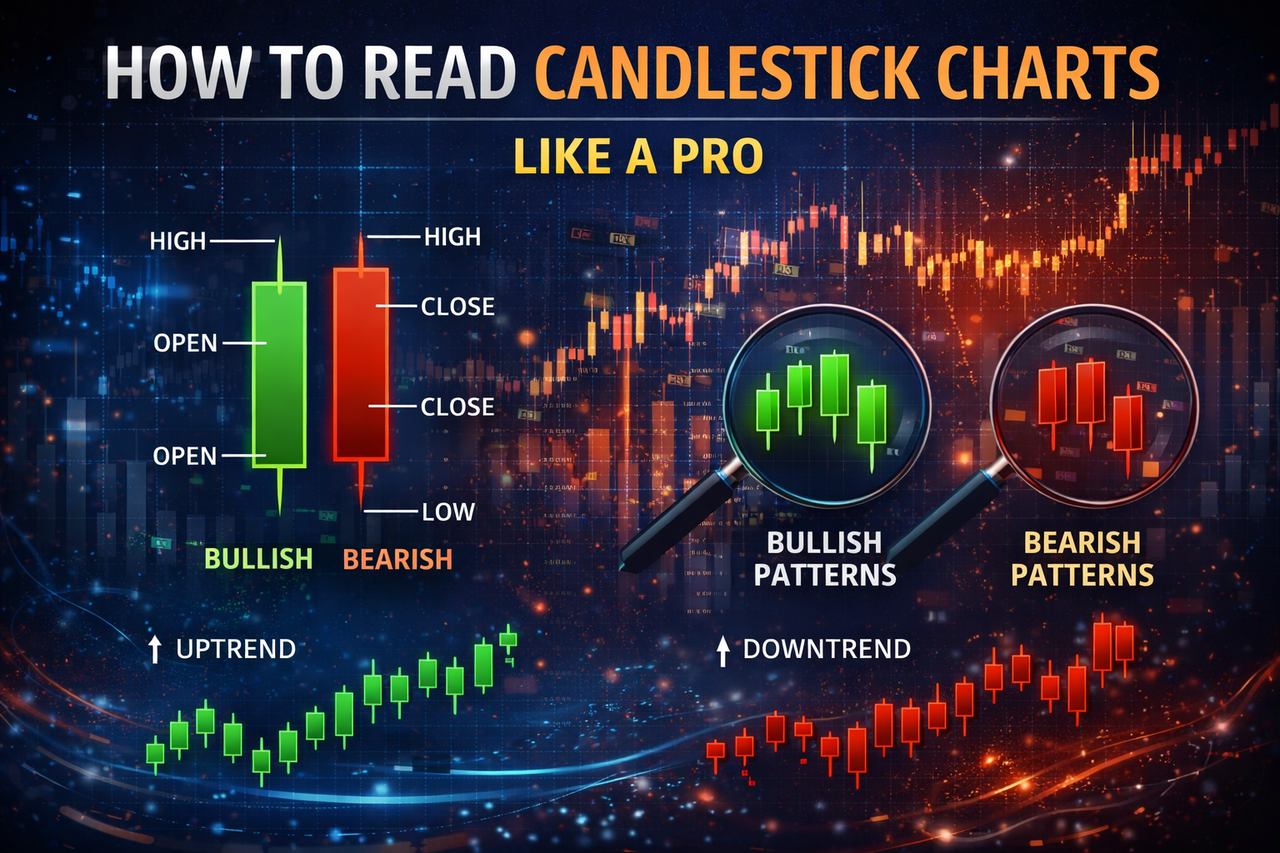
Candlestick charts provide a detailed view of price action, including the open, high, low, and close (OHLC) for a specific period.
-
Understanding the relationship between the "body" and the "shadow" is crucial for gauging buyer and seller exhaustion.
-
Reliable trading signals often emerge from specific patterns like the Hammer, Shooting Star, and Engulfing candles.
-
Context is king; always combine candlestick analysis with volume and support/resistance levels for better accuracy.
The Anatomy and Fundamentals of Candlesticks
Before you can spot a trend, you have to understand the individual "unit" of the chart. Each candle tells a story of a specific period (e.g., 5 minutes, 1 day). Unlike a standard line chart that only tracks closing prices, a candlestick provides a four-dimensional view of the market's battle.
The Four Pillars of Price
Every candle is built from four specific data points that represent the "OHLC" values. These pillars are the foundation of how to read candlestick charts accurately:
-
Open: The price at the very start of the time period.
-
Close: The price when the time period ended. This is often considered the most important data point.
-
High: The highest point the price touched during the period, marking the limit of bullish momentum.
-
Low: The lowest point the price touched, marking the limit of bearish pressure.
The Importance of the Closing Price
In technical analysis, the "Close" is frequently viewed as the summary of the day’s (or period's) sentiment. If a crypto asset closes near its high, it suggests that bulls maintained control until the very last second. Conversely, a close near the low indicates that bears successfully overwhelmed the market during that window.
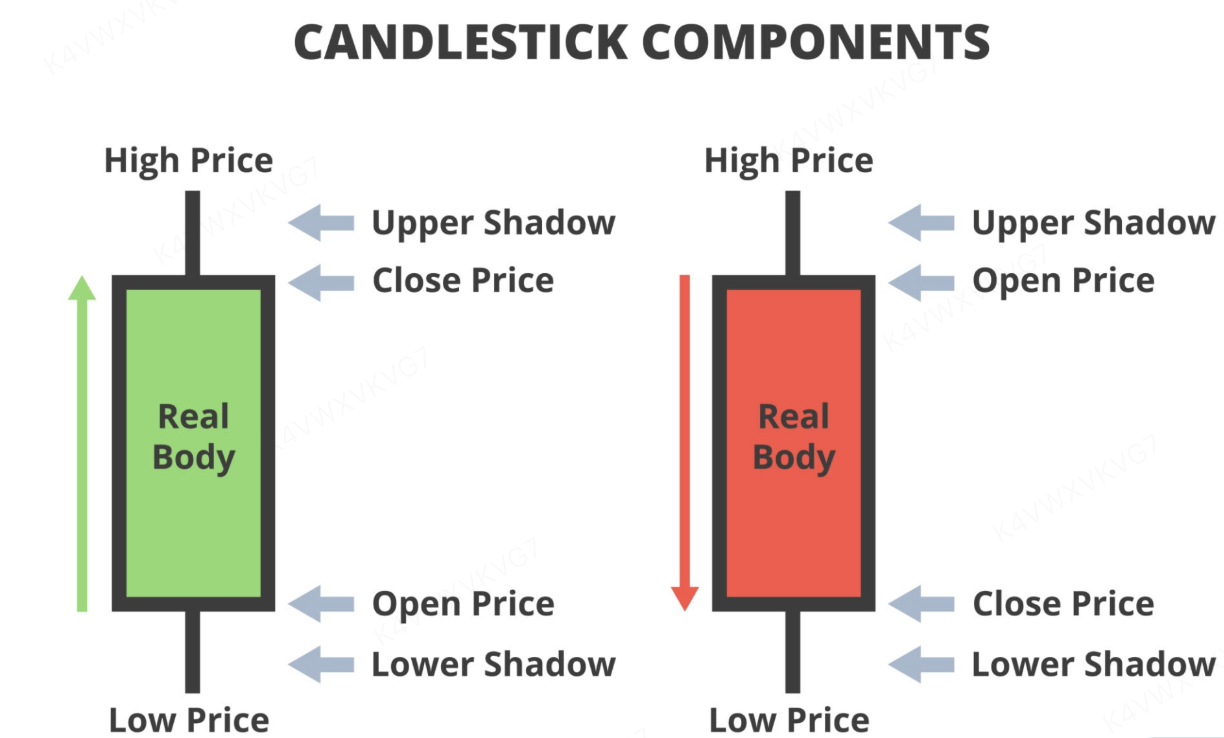
Body vs. Shadows (Wicks)
The visual structure of a candle is split into two distinct parts that tell you who is currently winning the tug-of-war.
-
The Real Body: The colored middle part. If it's Green (or White), the close was above the open, signaling bullish dominance. If it's Red (or Black), the close was below the open, signaling bearish dominance.
-
The Shadows (Wicks): The thin lines poking out from the top and bottom.
-
A long upper shadow means sellers pushed the price back down from its high, showing resistance.
-
A long lower shadow means buyers stepped in at the low, showing support or "dip buying."
-
Interpreting Volatility through Wick Length
When you see candles with very long wicks and small bodies, it indicates a period of high volatility and rejection. If a Bitcoin candle has a massive upper wick, it tells you that while the price tried to moon, the sell pressure was too intense to sustain the level.
Identifying High-Probability Patterns
Patterns aren't magic—they are visual representations of human psychology. When thousands of traders see the same rejection at a certain price point, they react, creating predictable movements on candlestick charts. We categorize these by the number of candles involved in the formation.
Single-Candle Reversal Signals
Sometimes, one single candle is enough to signal that a trend is about to flip. These are often the most popular entry signals for day traders.
-
The Hammer: This features a small body at the top with a long lower wick (at least twice the size of the body). It suggests the "bottoming out" of a move where sellers exhausted themselves and buyers reclaimed control.
-
The Shooting Star: The inverse of a hammer. It has a small body at the bottom with a long upper wick. It signals that a rally has run out of steam and a downward correction may be imminent.
-
The Doji: A candle where the open and close are nearly identical, resulting in a "plus sign" shape. It represents total indecision. After a long trend, a Doji often warns that the current momentum is stalling.
Multi-Candle Continuation and Reversal
While single candles are great for quick hints, multi-candle patterns offer higher confirmation for long-term trends.
The Power of Engulfing Patterns
-
Bullish Engulfing: Occurs when a small red candle is followed by a much larger green candle that completely "swallows" the previous one. This shows a massive surge in buying power.
-
Bearish Engulfing: The opposite occurs at the top of a trend; a large red candle engulfs a small green one, signaling that the bears have taken over the narrative.
Morning and Evening Stars
These are three-candle patterns that act as "macro" turning points.
-
Morning Star: A large red candle, followed by a small-bodied candle (Doji or spinning top), followed by a large green candle. It marks the transition from a downtrend to an uptrend.
-
Evening Star: A large green candle, a small indecisive candle, and a large red candle. This is a classic top-of-market signal.
Practical Strategy and Market Context
A pattern in isolation is just a shape. To trade successfully, you must "read the room" and understand the broader environment. Learning how to read candlestick charts involves looking beyond the individual shapes and into the flow of the market.
Reading Momentum and Range
The size and sequence of candles provide a "heartbeat" of the market. Observing how candles change over time helps you stay on the right side of the trade.
-
Expanding Bodies: When you see consecutive candles getting larger, it indicates increasing volatility and strong conviction. This is usually the best time to "ride the trend."
-
Decreasing Bodies: If the bodies are getting smaller (often called "climbing the stairs"), the momentum is tiring. This is a warning that the trend may be coming to an end.
-
Long Wicks in a Row: When you see multiple candles with long shadows at the same price level, it is a sign of strong "resistance" or "support." The market is trying to break through but is being rejected repeatedly.
Identifying Trend Strength
A strong trend usually features "clean" candles—mostly one color with minimal wicks against the direction of the move. If a crypto asset is trending up but the candles are messy with long shadows on both sides, the trend is "noisy" and more likely to fail.
Combining Candles with Other Tools
Don't trade candles alone. Your win rate will increase significantly if you use "confluence"—where multiple indicators tell the same story.
-
Support and Resistance Levels: A Hammer at a major historical support line is much stronger than a Hammer appearing in the middle of a random price range.
-
Volume: Volume acts as a lie detector for candlestick charts. A reversal pattern (like a Bullish Engulfing) on massive volume is far more "valid" than one on low, tapering volume.
-
Moving Averages: Watch how candles react when they touch the 50-day or 200-day Moving Average. Reversal patterns at these levels are highly significant for institutional traders.
Conclusion
Mastering how to read candlestick charts is a fundamental requirement for anyone serious about navigating the crypto markets. By understanding the anatomy of a candle—from its open and close to its shadows—you gain a deeper insight into market psychology and the ongoing battle between bulls and bears. While individual patterns like the Hammer or Engulfing candle offer powerful signals, they are most effective when analyzed within the broader context of support, resistance, and volume. Consistently applying these principles to your candlestick charts will refine your timing and help you trade with the precision of a professional.
FAQ
What is the most reliable candlestick pattern?
While no pattern is 100% accurate, the Bullish/Bearish Engulfing and Morning/Evening Stars are widely considered highly reliable. These patterns reflect a significant shift in market sentiment and are best used on higher timeframes like the daily or 4-hour charts.
How do I start learning how to read candlestick charts?
Start by identifying the "four pillars" (OHLC) on a live chart. Practice spotting single-candle patterns like Dojis or Hammers at key support levels. Using a paper trading account on a crypto exchange can help you practice without risking real capital.
Are candlestick charts different for crypto than for stocks?
The visual rules of candlestick charts are identical across all markets. however, crypto markets are often more volatile and trade 24/7. This means you may see fewer "gaps" between candles compared to the stock market, but the psychological patterns remain the same.
Why do some candles have no wicks?
A candle with no wicks is known as a Marubozu. It indicates that the price opened at one extreme and closed at the other without any retracement. This is a sign of absolute dominance by either buyers or sellers during that specific period.
What timeframe is best for reading candlestick charts?
For beginners, the Daily (1D) and 4-Hour (4H) timeframes are best. Lower timeframes like the 1-minute chart contain a lot of "noise" and false signals, making it much harder to apply consistent technical analysis effectively.