

Bitcoin Shifts From Panic Selling to Buying the Dip: What CryptoQuant’s Darkfost Is Seeing
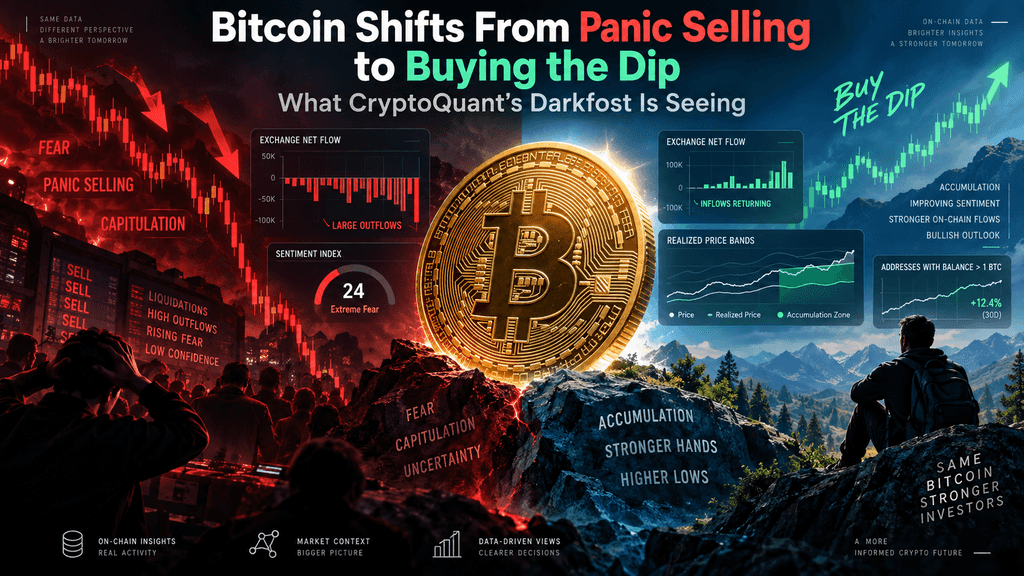
Bitcoin may be undergoing an important change in investor behavior. After months in which price declines frequently triggered more selling, CryptoQuant contributor Darkfost says the market has crossed a meaningful threshold: similar pullbacks are increasingly being treated as opportunities to buy rather than reasons to panic. His observation arrived at a critical moment. Bitcoin survived a volatile week that included the U.S. Senate’s CLARITY Act setback and the Federal Reserve’s first interest-rate increase in more than three years, then surged back above $80,000 on September 18. Darkfost described the change as a shift from “panic selling” toward “buying the dip,” making further downside more difficult for bears than it had been earlier in the correction.
But a change in behavior is not the same thing as confirmation of a new bull market. Bitcoin’s rebound has been supported by several forces at once: improving short-term holder conditions, renewed spot ETF inflows, previous deleveraging and forced short covering. At the same time, institutional flows remain volatile and CryptoQuant still identifies important resistance above the current market. The bigger question is therefore whether investors are genuinely accumulating Bitcoin during weakness—or whether the latest move is another temporary rebound amplified by derivatives positioning.
What Does “Buying the Dip” Really Mean?
“Buying the dip” is often used casually to describe investors purchasing an asset after its price falls. In the context of Darkfost’s analysis, however, the idea is more important because it describes a possible change in the market’s feedback mechanism. During a weak market, falling Bitcoin prices can create additional selling. Recent buyers move into losses, confidence deteriorates and holders transfer coins to exchanges to exit their positions. That selling pushes prices lower, potentially encouraging another wave of liquidation. The market effectively reinforces its own weakness.
Darkfost argues that this behavior is beginning to change. Instead of every meaningful decline producing another wave of panic selling, buyers are increasingly treating lower prices as an opportunity to accumulate. That means the same negative price move can now produce a different response: supply enters the market, but demand appears quickly enough to absorb part of it. On September 19, Darkfost described this as a “substantive shift” in Bitcoin market behavior and said the environment had become more difficult for traders expecting a much deeper decline.
This does not mean that Bitcoin cannot fall again. Buying the dip is a behavioral pattern, not a guarantee that every support level will hold. The important question is whether demand continues to appear during future corrections. A genuine regime change would require buyers to keep absorbing supply when volatility returns, rather than appearing only after the market has already started recovering.
Short-Term Holders Are Under Less Pressure
One useful way to understand the change is through the position of Bitcoin’s short-term holders. These investors are generally more sensitive to price movements than long-term holders because they entered the market recently and are more likely to respond to changes in unrealized profit or loss. When Bitcoin trades below their aggregate cost basis, many recent buyers are underwater. That can encourage investors to sell into rebounds simply to recover their original capital.
Recent estimates placed the short-term holder cost basis near the low-$70,000 range. One September 19 dataset put the level at approximately $71,594, while Bitcoin was around $81,320. At that point, only about 1.3% of short-term holder supply in the dataset remained underwater. This created a sizeable cushion between spot price and the average acquisition level of recent buyers.
That difference matters psychologically. When BTC is below the short-term holder cost basis, a rally toward that level can generate “break-even selling” as investors use the recovery to exit. When Bitcoin trades comfortably above it, pullbacks that remain above the cost basis may instead look like opportunities to increase exposure. In other words, recent investors can move from thinking “sell the rebound” to “buy the pullback.” The change does not eliminate selling pressure, but it reduces one of the mechanisms that previously turned ordinary corrections into larger waves of capitulation.
Who Is Actually Buying the Dip?
The phrase “investors are buying” can hide an important question: which investors? Bitcoin demand now comes through several different channels, and distinguishing them matters because each type of buyer behaves differently. Crypto-native whales can accumulate coins directly, institutional investors can gain exposure through regulated ETFs, and speculative traders can enter through futures. All three create buying activity, but they do not necessarily provide the same degree of long-term support.
U.S. spot Bitcoin ETFs provide one of the clearest recent examples of fresh demand. On September 18, the products recorded approximately $433 million in net inflows, their strongest daily inflow since early September. Fidelity’s FBTC accounted for roughly $310.7 million, while BlackRock’s IBIT added about $108.4 million. The flow coincided with Bitcoin pushing back above $80,000, offering evidence that regulated investment vehicles were attracting capital as market conditions improved.
The weekly number, however, was far less dramatic. Bitcoin ETFs finished the week ending September 18 with only around $6.2 million in net inflows because earlier withdrawals almost completely offset Friday’s buying. That distinction is crucial. Institutional investors clearly returned at an important moment, but the data does not yet show uninterrupted accumulation. For the buy-the-dip thesis to become stronger, ETF demand would ideally remain constructive through multiple sessions and, more importantly, appear again during the next significant Bitcoin pullback.
| Signal | Recent Development | What It Suggests |
| Bitcoin price | Reclaimed $80,000 | Buyers absorbed recent weakness |
| Short-term holder cost basis | Around low-$70,000 range | Recent holders have more profit cushion |
| Spot Bitcoin ETFs | +$433M on Sept. 18 | Institutional demand returned |
| Weekly ETF flow | Only +$6.2M | Demand is still inconsistent |
| Futures leverage | Major deleveraging recently | Some forced-selling risk was cleared |
| Key resistance | $81,700–$88,700 | Buyers still face heavy overhead supply |
Was the $80K Rally Real Buying or a Short Squeeze?
Bitcoin’s return above $80,000 provides the most visible evidence of changing sentiment, but price alone cannot tell investors where the demand originated. On September 18, BTC climbed more than 5% and reached approximately $80,587 in morning trading, its strongest level in around two weeks. The move came despite the Senate setback for the CLARITY Act and the Federal Reserve’s rate hike earlier in the week. Market analysts argued that some of those negative catalysts had already been priced in, allowing investors to shift their attention from anticipated risks toward the market’s ability to absorb them.
Part of the rally likely reflected short covering. When traders borrow exposure to bet on Bitcoin falling and the price instead rises sharply, they may need to close positions by buying BTC or equivalent derivatives exposure. Liquidations can force that process automatically. The result is a feedback loop in which higher prices force short sellers to buy, which pushes the market higher again. This can make a rebound look more powerful than the underlying spot demand alone would justify.
That distinction is essential for evaluating Darkfost’s thesis. Short covering is genuine buying pressure in the mechanical sense, but it does not necessarily represent investors making a long-term decision to accumulate Bitcoin. If forced purchases disappear once bearish positions are closed, price can stall quickly. A stronger signal would be sustained spot demand after the squeeze ends—especially from ETFs, large holders and unleveraged buyers willing to absorb supply near major resistance.
Deleveraging Made the Market Less Fragile
The derivatives market helps explain why the recent decline did not automatically develop into another liquidation cascade. Earlier in September, Darkfost described Bitcoin as having undergone its most severe deleveraging phase since 2023. Binance Bitcoin open interest fell sharply and briefly moved below its 180-day average as oversized leveraged positions were closed or liquidated. Darkfost said the adjustment represented one of the largest liquidation episodes of the current cycle.
A reduction in leverage can make subsequent declines easier for spot buyers to absorb. In an overcrowded futures market, a relatively small fall can trigger long liquidations, which create forced selling, push prices lower and trigger still more liquidations. Once part of that leverage has been removed, the same price decline may generate less automatic selling. This creates more room for genuine buyers to provide support rather than competing against a cascade of forced exits.
The risk has not disappeared. Darkfost noted that Binance open interest subsequently recovered to about $9.6 billion, above its roughly $8.3 billion 180-day average at the time, showing that traders were already returning. Separate September data also showed meaningful reductions in Bitcoin-denominated open interest before major macro events, suggesting traders had actively reduced exposure rather than simply watching the dollar value of contracts decline with price. If leverage rebuilds much faster than spot demand, another correction could recreate precisely the liquidation dynamics the market recently cleared.
ETF Buying Matters More Than One Big Day
The development of spot Bitcoin ETFs has created a new dip-buying mechanism that did not exist during earlier Bitcoin cycles. Traditional investors can now increase BTC exposure through familiar regulated securities without moving funds onto a crypto exchange or managing private keys. That creates a direct channel through which asset managers, advisers and other investors can respond when Bitcoin falls to prices they consider attractive.
September illustrates both the importance and the limitations of that channel. The $433 million September 18 inflow was significant, but monthly data through September 18 showed only about $313.6 million in net inflows across the first 18 days of the month, with positive and negative sessions frequently alternating. Only six of the first 13 trading sessions were positive, while seven produced net outflows. The picture is therefore one of active two-way institutional positioning rather than a simple wall of uninterrupted buying.
That is why future ETF behavior matters more than one dramatic inflow figure. A single $433 million session can reinforce a rebound, but a true institutional dip-buying pattern would be more convincing if several future Bitcoin corrections repeatedly attract fresh ETF capital. If the opposite happens and lower prices generate persistent redemptions, ETFs could transmit risk-off behavior back into the spot market just as efficiently as they currently transmit demand.
Bitcoin’s $81.7K Test Could Decide What Comes Next
The next challenge is already visible. CryptoQuant said in its September 12 market analysis that Bitcoin needed to clear approximately $81,700, its 365-day moving average at the time, to provide stronger confirmation of a new bull market. The firm also identified additional resistance around $83,600 and $88,700. Bitcoin had already rallied about 24% over two weeks before encountering those barriers, meaning the market was moving from a recovery phase into an area where existing holders may be increasingly willing to sell.
Why Overhead Supply Matters
CryptoQuant identified the $77,100–$80,200 region as a particularly heavy on-chain supply area, where long-term holders had previously sold as much as 539,000 BTC over a 30-day period. A move above $80,000 therefore does more than satisfy a psychological milestone. It pushes Bitcoin directly into territory where substantial historical supply has already appeared. The $81,700 level represented the next important technical hurdle, followed by the $83,600 network-valuation level and $88,700, where active traders have historically shown greater willingness to take profits.
This is where Darkfost’s buy-the-dip thesis faces a more difficult test. Buying BTC at $70,000–$75,000 after a sharp decline is one thing; continuing to buy after the market enters an area where existing holders want to realize profits is another. The real question is whether new demand can absorb old supply. If Bitcoin moves through these resistance zones while ETF flows and spot demand remain constructive, the behavioral shift would gain stronger evidence. If buying disappears as soon as BTC reaches overhead supply, the latest rally may prove more fragile.
Why This Is Not Yet a Confirmed Bull Market
CryptoQuant’s broader market analysis remains constructive, but it has deliberately stopped short of saying that a new bull market is already confirmed. Its September 12 report argued that the 365-day moving average around $81,700 had historically played an important role in separating recovery phases from more durable bullish trends. A failure to close decisively above that level could leave Bitcoin trading within a range rather than beginning a new sustained advance.
There are also reasons to remain cautious outside crypto-specific indicators. The Federal Reserve has restarted rate hikes, Treasury yields remain elevated, and global risk assets continue to face pressure from inflation and tighter financial conditions. U.S. equity funds experienced more than $31 billion in weekly outflows around the same period, demonstrating that broader investor risk appetite remains uneven. Bitcoin’s ability to rally in that environment is notable, but it does not remove the macro headwinds.
The most accurate description may therefore be that Bitcoin has moved from capitulation toward accumulation without yet completing the transition into a confirmed bull trend. Investor behavior has improved, recent holders are under less pressure and buyers are appearing on declines. But confirmation requires more than one rally above $80,000.
What Could Turn Dip Buying Back Into Panic Selling?
One potential reversal would be persistent ETF outflows. The September 18 inflow showed how quickly institutional money can return, but the preceding withdrawals showed the opposite is equally possible. If Bitcoin weakens while ETF investors redeem shares across several consecutive sessions, a source of support could become an additional channel for sell-side pressure. That would be especially significant if price simultaneously falls back toward the short-term holder cost basis.
Leverage is another vulnerability. Darkfost’s own analysis warns that traders have already rebuilt positions after the recent deleveraging. If open interest rises rapidly while spot demand remains weak, Bitcoin could again become highly sensitive to forced liquidations. A decline in that environment may no longer attract buyers calmly; it could trigger margin calls first, creating a new wave of mechanical selling before spot investors have an opportunity to absorb the supply.
Finally, a sustained move back below the short-term holder cost basis would alter investor psychology. Recent buyers currently have a relatively comfortable profit cushion. If that disappears and a growing share of short-term supply moves underwater, rallies could once again become opportunities to exit at break-even rather than opportunities to add exposure. The strongest test of Darkfost’s thesis will therefore come not during the current rally, but during the next meaningful drawdown.
What Should Bitcoin Investors Watch Next?
The most useful approach is to monitor several indicators together rather than treating any single metric as proof of a trend change. Price structure comes first: Bitcoin must show that it can remain above important short-term holder cost levels and absorb supply around the $81,700–$83,600 resistance zone. A brief move above those levels matters less than whether buyers continue supporting the market after volatility returns.
ETF flows provide the next layer. Repeated net inflows during weaker Bitcoin sessions would offer stronger evidence that institutional investors are actively buying dips rather than simply chasing a rebound. At the same time, open interest and funding rates can reveal whether price gains are being driven primarily by spot capital or by leveraged derivatives traders. If leverage expands rapidly while ETF and spot demand weaken, the rally becomes more vulnerable.
The strongest confirmation would come from several signals aligning at once: Bitcoin holding above recent holder cost bases, spot and ETF demand remaining constructive, overhead supply being absorbed and leverage staying controlled. Until then, the shift from panic selling to dip buying should be treated as an emerging market behavior rather than a completed regime change.
🔥 Beyond the Headlines: What KuCoin 5.0 Means for You
Market news moves fast — but where you act on it matters just as much. This October, KuCoin launches KuCoin 5.0, transforming KuCoin into a rebuilt platform. Here's what actually changes for you:
-
One account for everything. Older platforms split your money across separate "spot," "margin," and "futures" accounts and expected you to understand why. KuCoin 5.0's unified account removes that entirely — deposit once, and everything is simply there.
-
Stocks, indices, and commodities. KuCoin 5.0 expands beyond crypto into global markets. When crypto chops sideways and equities rally (or the reverse), you rotate in minutes instead of opening a brokerage account and waiting days for fiat rails.
-
Real-world assets (RWA). Tokenized exposure to traditional assets like commodities, right inside your crypto account. One of the fastest-growing segments in global finance is no longer reserved for institutions — you access it from the same balance you trade with.
-
Earn while you learn. Not ready to trade? KCUSD lets your stablecoins earn daily, auto-compounding interest. The lowest-stress way to put your idle deposit to work for 4% yield.
-
An AI assistant in plain language. Ask questions, get market context, understand what you're looking at — built into the platform, no jargon required.
-
An app that doesn't overwhelm. Faster, cleaner, and consistent — intuitive from the first tap, not after a tutorial.
-
Safety you can check, not just trust. A MiCAR-licensed EU entity, Proof of Reserves you can verify yourself, and internationally certified security (SOC 2 Type II, ISO 27001:2022).
Create your account in minutes — and start on the platform built for where crypto is going, not where it's been.
Conclusion
Darkfost’s observation captures an important change in the way Bitcoin investors are reacting to volatility. Earlier in the correction, falling prices often produced more selling as recent buyers realized losses and leveraged positions were liquidated. More recently, similar pullbacks have increasingly attracted demand. Bitcoin survived a difficult week of regulatory and monetary-policy news, recovered above $80,000, and saw $433 million flow into U.S. spot ETFs on September 18. Recent holders are also sitting further above their average cost basis, while an earlier deleveraging event removed part of the market’s forced-selling pressure.
Yet the transition remains incomplete. ETF flows are still volatile, leverage is returning, and some of the $80,000 rally was likely amplified by short covering. Most importantly, Bitcoin is now confronting the $81,700–$88,700 resistance structure identified by CryptoQuant.
Bitcoin may indeed be moving from a market that sells every rebound toward one that buys meaningful pullbacks. But the strongest evidence will not come from how aggressively investors bought the latest recovery. It will come from what they do during the next serious Bitcoin decline.
FAQs
What Is Bitcoin Capitulation?
Bitcoin capitulation describes a period when investors sell aggressively after prolonged losses, often because confidence has deteriorated or holders can no longer tolerate further downside. Capitulation can involve unusually large realized losses, exchange inflows and forced liquidations, but it does not automatically identify the exact market bottom.
What Is the Difference Between Buying the Dip and Dollar-Cost Averaging?
Buying the dip involves deliberately increasing exposure after a meaningful price decline. Dollar-cost averaging follows a predetermined schedule, such as investing the same amount every week or month, regardless of whether Bitcoin has risen or fallen. The first responds to price; the second is designed to reduce dependence on short-term timing.
Do Bitcoin Exchange Outflows Always Mean Investors Are Accumulating?
No. Coins leaving exchanges can indicate long-term storage, but transfers can also result from institutional custody arrangements, ETF-related movements, wallet reorganizations or changes in exchange infrastructure. Exchange balances are therefore more useful when interpreted alongside holder behavior, transaction data and other on-chain indicators.
Can On-Chain Data Predict Bitcoin’s Next Price Move?
On-chain data can reveal how different groups of holders are behaving, where investors acquired their coins and whether profits or losses are being realized. It can help identify market structure and potential areas of supply or demand, but it cannot reliably predict the exact timing or direction of Bitcoin’s next move because macroeconomic news, derivatives positioning and investor sentiment can change quickly.
Why Do Short Liquidations Push Bitcoin Higher?
A trader who shorts Bitcoin is positioned to profit if the price falls. When Bitcoin rises instead, the trader may need to close the short by buying back the position. If leveraged shorts are automatically liquidated at the same time, those forced purchases can accelerate an upward move. This creates a short squeeze, although the resulting buying pressure does not necessarily represent long-term investment demand.
Disclaimer: This article is for informational purposes only and does not constitute investment advice. Crypto assets can be highly volatile, and market conditions, token liquidity and project developments may change rapidly. Readers should conduct their own research and assess their risk tolerance before making financial decisions.